
Abstract
The effects of zinc oxide nanoparticles (nZnO) were examined for nitrifying bacterial enrichments by measuring substrate (ammonia) specific oxygen uptake rates (sOUR) in conjunction with the transcript level of functional genes involved in nitrification quantified by reverse transcriptase-quantitative polymerase chain reaction. Samples from nitrifying bioreactor were exposed in batch vessels to nZnO (1, 5 and 10 mg/L) for either 3 or 6 h. There was considerable increase in sOUR-based nitrification inhibition with increasing dosages of nZnO. At 10 mg/L nZnO, the inhibition was about 35% and 50% for 3 and 6 h exposure, respectively. As the nZnO dosage was increased, the transcript levels of amoA, hao, and nirK for 6 h exposure samples were decreased which corresponded well with sOUR data. In addition, an increase in intracellular reactive oxygen species content was observed for the cells of nitrifying bacteria when the total nZnO concentrations were 5 and 10 mg/L. The agreement between the relative expression of functional genes and sOUR shown in this study reveals the effectiveness of using transcriptional responses in conjunction with physiological activity for better understanding the impact of inhibitory compounds such as nanoparticles on nitrification process.
Introduction
The use of metal-based nanoparticles in a broad range of commercial products has grown exponentially in the recent years. As the use of these nanomaterials in industry and consumer products is growing, zinc oxide nanoparticles (nZnO) are of particular interest based on their ever increasing use in the production of solar cells, sensors, and transistors, as well as for their application in the textile and food packaging industry due to their ultraviolet-blocking and antibacterial properties (Gottschalk et al., 2009; Moezzi et al., 2012). An inevitable outcome of this pattern is their release into the environment and wastewater streams in turn impacting the performance of wastewater treatment plants (WWTPs) (Wu et al., 2010; Zheng et al., 2011). Previous studies have estimated that the concentrations of nZnO in the effluent of WWTPs ranged from 430 ng/L to 1.58 μg/L, while in the WWTP sludge, it could range from 2 to 22 μg/kg (Gottschalk et al., 2009; Majedi et al., 2012; Dumont et al., 2015). Since nZnO posses novel physicochemical properties resulting in their wide range of applications in industrial and commercial products, it is expected that the concentration of nZnO will keep increasing in the environment. The introduction of nZnO into WWTPs and environmental aquatic systems such as rivers and streams through domestic and industrial discharges can be toxic to microorganisms carrying out important biological processes, such as nitrification. Although there are multiple factors, such as temperature, pH, inorganic nutrients, and organic matter in wastewater that could affect the stability, hydrodynamic size, reactivity, or bioavailability of nanoparticles (Choi and Hu, 2008; Yang et al., 2009; Chambers et al., 2013), the total nitrogen removal efficiencies of activated sludge systems were found to decrease in the presence of 10 and 50 mg/L nZnO (Choi and Hu, 2008). However, it is still not well known how ZnO nanoparticles interact with nitrifying bacteria and which step of nitrification is more sensitive to nanoparticle-based inhibition.
One of the increasingly important roles of a WWTP is reduction of reactive nitrogen discharges to receiving water bodies, which is achieved through biological nitrogen removal by promoting autotrophic nitrification. Nitrification is a two-step process, in which ammonia is converted to nitrite by ammonia oxidizing bacteria (AOB), and nitrite is converted to nitrate by nitrite oxidizing bacteria. AOB are widely identified as one of the most vulnerable microorganisms present in biological wastewater treatment, (Siripong and Rittmann, 2007) making them a critical screening species to monitor upon exposure to emerging contaminants such as nZnO. Our current understanding of the inhibitory effects of nZnO on nitrification is limited. Most nanoparticle-based inhibition of nitrification has been studied using physiological responses, such as rates of substrate (ammonia, NH3) consumption, and/or specific oxygen uptake rate (sOUR), while only a few studies have used molecular measures such as gene expression analysis (Choi and Hu, 2008; García et al., 2012; Wu et al., 2018). While these techniques are all eminently applicable for characterizing the impact of different nanoparticles on nitrification, these chemical methods alone often do not provide sufficient information regarding the molecular interaction of nanoparticles with nitrifying bacteria. In general, respirometry-based methods measure total inhibition, but cannot determine which genes/enzymes remain active or which metabolic steps are significantly inhibited after toxicant exposure. To date, the pure cultures of nitrifiers such as Nitrosomonas europaea have been used in most of inhibition studies (Radniecki et al., 2011; Yu et al., 2015), thus limited data are available on how different nitrifying groups present in a complex microbial consortia like activated sludge respond to the presence of nZnO.
The molecular inspection of gene transcription profiles can be a potential tool for inhibition of AOB in mixed communities. In nitrification, the most sensitive step is the oxidation of ammonia to nitrite carried out by AOB. This step involves the expression of ammonia monooxygenase (amoA) and hydroxylamine oxidoreductase (hao) genes (Hooper et al., 1997). Thus, the transcriptional responses of these genes have been proposed as targets to study nitrification inhibition due to their sensitivity to environmental perturbations (Yu and Chandran, 2010; Kapoor et al., 2016a; Li et al., 2016). The change in expression of the gene coding for autotrophic nitrite reduction to nitric oxide (nirK) has also been linked to imbalances in the metabolism of AOB. Thus, during nitrification inhibition, autotrophic denitrification may be preferred leading to the expression of nirK gene. Based on the treatment performance of the process, these genes may serve as early warning indicators of nitrification inhibition in WWTPs. Since the activity of enzymes that are coded by these genes can be correlated with gene expression, it is rational to assume that nZnO exposure to nitrifying bacteria can induce oxidative stress that would affect the transcription of the genes coding for these enzymes. In addition, it was hypothesized that the oxidative stress to microbial cells is mainly caused by the production of the reactive oxygen species (ROS) from nanoparticles.
The primary objectives of this study are the examination of the impact of nZnO on the physiological activities and gene expression of nitrifying enrichments under short-term exposure. Particularly, the transcriptional responses of nitrifying enrichments upon 3 and 6 h exposure to nZnO with varying concentrations (1, 5, and 10 mg/L) has been investigated. The transcription of amoA, hao, and nirK, three key functional genes involved in redox N transformations was measured in response to nZnO inhibition using reverse transcriptase-quantitative polymerase chain reaction (RT-qPCR) assays. Batch exposure experiments were conducted for 3 and 6 h periods and the selected concentrations were chosen based on previously reported inhibition thresholds (Wang et al., 2015; Wu et al., 2018) and since many nanoparticle-contaminated wastewaters typically had concentrations below or within these ranges, they likely represented worst-case scenario for municipal WWTPs (Zheng et al., 2011; Rasool and Lee, 2016; Kapoor et al., 2018).
Recently, few studies have attempted to characterize the transcriptional responses of nitrifying bacteria in response to nitrification inhibition by nZnO, however, they were performed for a single exposure time period (Wang et al., 2015; Wu et al., 2018). There has been a gap on examination of the correlation between the data obtained from molecular and chemical methods for the same samples of nitrifying bacteria inhibited by nZnO at different exposure times. Thus, in this study, we examined the transcriptional responses of three associated genes implicated in the nitrification process and compared those to ammonia-dependent sOUR measurements for the same set of samples for two different exposure times. The effectiveness of using functional-gene transcript levels (amoA, hao, nirK) as indicators of nitrification inhibition in bacterial cells exposed to nZnO was evaluated. Furthermore, intracellular ROS generation was measured during nZnO exposure since previous studies reported that nZnO could generate intracellular ROS and inhibit the nitrifying bacterial processes (Choi and Hu, 2009; Yin et al., 2010; Zheng et al., 2011; Wu et al., 2018).
Materials and Methods
Nitrifying bioreactor
The nitrifying microbial communities were enriched in a laboratory-scale bioreactor (V = 10 L) operated at hydraulic retention time of 1 day and solid retention time of 35 days as described in previous studies (Kapoor et al., 2015, 2016a) by using return activated sludge obtained from Dos Rios WWTP in San Antonio, Texas. The reactor was fed with a nutrient medium containing an ammonium source [(NH4)2SO4, 500 mg/L NH3-N] and essential macro- and micronutrients (Supplementary Table S1), and devoid of any organic carbon to minimize heterotrophic activity. The pH was maintained at 7.5 ± 0.1 with 1 M sodium bicarbonate using an automated pH Controller (Bluelab). The aeration was provided at 1 L/min from near the bottom of the reactor and magnetic stirring at 350 rpm provided mixing. The dissolved oxygen (DO) concentration in the reactor was maintained between 3 and 4 mg/L. The performance of the reactor was monitored regularly through measuring total suspended solid (TSS), chemical oxygen demand, effluent N-NH4+, N-NO2−, and N-NO3− concentrations. Biomass from the reactor was withdrawn for batch studies when the reactor reached steady state condition regarding ammonia and biomass concentration (ammonia removal ≥99%).
Characterization of nZnO
nZnO used in this work was purchased from Alfa Aesar with 40–100 nm in diameter and 10–25 m2/g in specific area. According to the manufacturer's specifications, the nanoparticles did not have any surface functionalization. nZnO were suspended in Milli-Q water to a concentration of 100 mg/L and sonicated in ice water bath (Bransonic 3510R) for 60 min before use. nZnO were characterized for morphology using scanning electron microscopy (SEM, Hitachi STEM S5500; Hitachi Ltd., Tokyo, Japan) and the size distribution was determined using a Delsa Nano C particle analyzer (Beckman Coulter).
Batch studies
The exposure studies were carried out in batch vessels with samples from the nitrifying bioreactor and absence (control) and presence (exposure) of nZnO. Aliquots were withdrawn from the bioreactor and the biomass was allowed to settle. After settling, the biomass was washed three times to remove residual salts from the samples that could interfere with the batch experiments. The washed biomass was resuspended in Milli-Q water to a final volume of 200 mL. Batch vessels (250 mL beaker, Erlenmeyer) were prepared with 100 mL media containing 50 mg/L of N-NH4+ and other macro- and micronutrients and buffered with 20 mM MOPS [3-(N-morpholino) propanesulfonic acid] to stabilize pH (Odzak et al., 2014). Three test concentrations (1, 5 and 10 mg/L) of nZnO were examined in this study. When necessary, the sample pH was adjusted to 7.5 with 1 M NaOH or HCl. Right before the exposure experiment, the washed biomass was added to a final concentration of 800 mg/L TSS. The flasks were stirred for either 3 or 6 h (25°C ± 1°C and 300 rpm) to simulate short-term exposure to nanoparticles. After incubation, 2 × 1 mL of biomass samples were collected, centrifuged, and the pellets were immediately frozen at −80°C for nucleic acid extraction. The concentrations of N-NH4+, N-NO2−, and N-NO3− were estimated at intervals of 1.5 h during the 6 h exposure experiment and analyzed using TNT kits (HACH). Control samples were treated the same way as described above, but without any addition of nanoparticles. All experiments were performed in duplicates.
sOUR measurement
sOUR was determined using respirometry as previously described (Hu et al., 2002). After 3 or 6 h exposure period, the biomass suspensions were transferred to water-jacketed glass vessels, maintained at room temperature (20°C ± 1°C) and aerated with pure oxygen followed by substrate injection (20 mg N-NH4+ L−1) to yield substrate-independent maximal oxygen uptake rates. Ammonia oxidation levels were determined from decrease in DO, which was measured and recoded in real-time via a DO probe (YSI 5100A; Yellow Springs Instruments) connected with a computer interface. The difference between the measured sOUR with and without nZnO exposure was used to measure nitrification inhibition. The inhibition (%) is calculated by measuring the differences between the maximum sOUR in the absence (sOURcontrol) and presence (sOURsample) of nZnO exposure as follows (Kapoor et al., 2016a):

RT-qPCR assays
RT-qPCR assays were used to determine the transcriptional levels of amoA, hao, and nirK in the tested samples. DNA and RNA were extracted from the stored biomass pellets using AllPrep DNA/RNA Mini Kit (Qiagen GmbH, Hilden, Germany) as described previously (Kapoor et al., 2015). The purified RNA extracts were used to synthesize complementary DNA (cDNA) by using the Superscript III, following the manufacturer's instructions (Life Technologies, Grand Island, NY). RT-qPCR was performed on CFX96 Real-Time PCR system (Bio-Rad, Hercules, CA) with SsoAdvanced™ Universal SYBR® Green Supermix (Bio-Rad) for amoA, hao, and nirK markers (Supplementary Table S2) (Chandran and Love, 2008; Yu and Chandran, 2010). Plasmids containing the sequences for each of the targeted genes were used to generate the standard curves. The relative abundance of AOB was determined by qPCR using AOB 16S ribosomal RNA (rRNA) gene primers (Hermansson and Lindgren, 2001). The transcript levels (the quantification of cDNA) of each functional gene were normalized against AOB 16S rRNA gene copies. Additional details regarding RNA, DNA extraction, and qPCR assays are provided in the Supplementary Data.
Determination of ROS
Intracellular ROS was determined by using OxiSelect™ Intracellular ROS Assay Kit (Cell Biolabs) according to manufacturer's instruction with a slight modification. In brief, the aliquot from nitrifying reactor was centrifuged at 10,000 rpm for 15 s and gently washed three times with Dulbecco's phosphate-buffered saline (DPBS; Thermo Fisher Scientific). The biomass pellets were resuspended in DPBS containing 50 μM 2′,7′-dichloro-dihydro-fluorescein diacetate (DCFH-DA; Cell Biolabs) and incubated at room temperature in dark. After 60 min of incubation, the phosphate buffer containing DCFH-DA was removed by centrifugation at 10,000 rpm for 15 s and gently washed three times with DPBS. The biomass pellets were then resuspended in nitrifying media (pH = 7.5) containing 0, 1, 5, or 10 mg/L of nZnO and plated into a 96-well plate and incubated at 25°C ± 1°C. After 3 or 6 h of incubation with regular mixing, the samples were briefly centrifuged, and the supernatant from each well was discarded. The remaining biomass were washed 3 times by using DPBS and resuspended to 100 μL followed by addition of 100 μL of 2
Dissolution of ZnO nanoparticles
To determine dissolution of nZnO in aqueous environments, dosages of 1, 5, and 10 mg/L nZnO, respectively, were added to deionized (DI) water and biomass samples. The concentration of Zn2+ in the resulting solutions was determined after 3 or 6 h by Inductively Coupled Plasma Optical Emission Spectrometry (ICP-OES; PerkinElmer). In brief, nZnO and/or cells were removed by centrifugation at 15,000 rpm for 20 min and the supernatant was filtered through 0.2 μm filter (Cellulose Acetate; VWR) and diluted 50 times by DI water followed by acidification by 1% HNO3 (Trace metal grade; Fisher) (Wu et al., 2010; Senapati and Kumar, 2018). The Zn2+ concentration in the resulting solution at different time points was measured by ICP-OES.
Statistical analysis
sOUR-based inhibition was expressed as relative percent inhibition, while the results for RT-qPCR-based inhibition were represented as change in relative gene expression with respect to the control. All the experiments were performed in duplicates. Nonparametric Kruskal–Wallis one-way analysis of variance was used to test the significance of the results using p ≤ 0.05 as statically significant. All the analyses were performed using GraphPad Prism 8.3.0.
Results
Nitrifying bioreactor operation
The reactor reached a steady state after about a month and maintained stable operation during the course of the study, characterized by >99% ammonia removal (Fig. 1). During the steady state nitrification, the average effluent NH4+-N concentration was less than 5 mg/L, and average biomass concentration was about 1,500 mg/L as TSS, and no NO2−-N accumulation was observed (Supplementary Figs. S1 and S2). In addition, the amoA and hao genes abundance in the bioreactor was measured throughout the course of the study and varied between 106 and 109 copies/mL, indicating a high population of nitrifying communities in the reactor (Fig. 1).

Bioreactor performance as measured ammonia removal and RT-qPCR derived amoA and hao gene abundance during steady-state operation of the reactor. RT-qPCR, reverse transcriptase-quantitative polymerase chain reaction.
Characterization of ZnO nanoparticles
According to the manufacturer, nZnO have 40–100 nm particle size and surface area of 10–25 m2/g. The particle size and distribution of nZnO were characterized by SEM and Delsa Nano C particle analyzer. Results indicated that the particle size of nZnO ranged from 40 to 100 nm, which is consistent with the manufacturer's report, although few particles were shown with bigger size (Supplementary Fig. S3a). The nearly spherical nZnO displayed a mean particle size of ∼65 nm (Supplementary Fig. S3b).
Effect of nZnO on sOUR
The percent inhibition of nitrification activity based on the sOUR method was plotted against the total ZnO nanoparticle dosage for each exposure period (Fig. 2). In general, the nitrification inhibition as determined by sOUR increased as the applied dosage of nZnO to nitrifying biomass increased. A linear relationship was observed between nZnO concentration and sOUR-based inhibition after 3 or 6 h exposure (3 h, R2 = 0.86; 6 h, R2 = 0.98). When the total nZnO concentration was 1 mg/L, nitrification was slightly inhibited after 3 h exposure (Fig. 2), while 6 h exposure rendered an increase of about 9% in sOUR-based inhibition (Fig. 2). At 10 mg/L nZnO, the inhibition was about 35% and 50% for 3 and 6 h exposure, respectively.
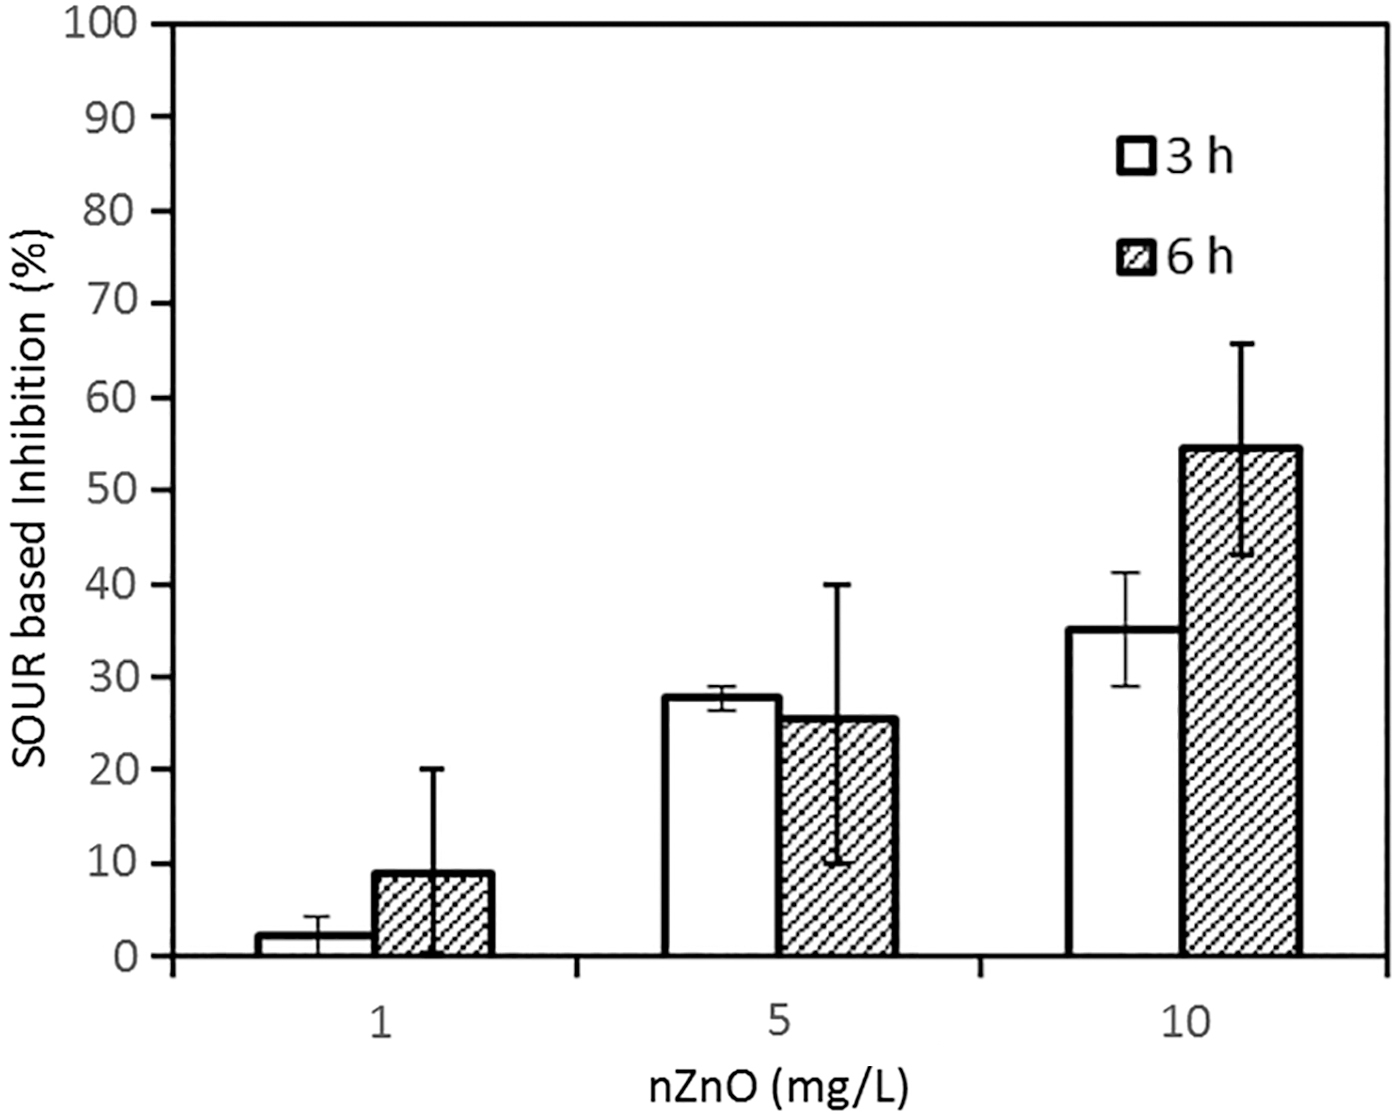
Comparison of ammonia oxidation inhibition measured by sOUR as a function of total nZnO concentration after 3 and 6 h exposure of nZnO (1, 5 and 10 mg/L). Each bar graph represents average of experimental duplicates. nZnO, zinc oxide nanoparticles; sOUR, specific oxygen uptake rates.
Although the present study is based on the effects of total dosed nZnO in solution, it should be noted that dissolution of nZnO may result in release of Zn2+ ions in solution (Mudunkotuwa et al., 2012; Leung et al., 2019). To determine the solubility of nZnO at neutral pH, dosages of 1, 5, and 10 mg/L nZnO, respectively, were added to biomass samples and the concentrations of Zn2+ was determined after 3 or 6 h by ICP-OES (Table 1). At high nZnO dosage (10 mg/L), the final dissolved concentrations for Zn2+ were measured low (∼3.5 mg/L) suggesting that nZnO might adsorb onto the biomass during the incubation. For the 5 mg/L nZnO exposure samples, Zn2+ concentration reduced initially indicating that the nZnO started to aggregate or adsorb onto the biomass (at 3 h incubation), followed by increase in concentration after 6 h. It was found that the Zn2+ could be up to 2.4 mg/L when the total ZnO NP concentration was 5 mg/L after 6 h of incubation. In addition, higher amounts of Zn2+ released after 6 h compared with 3 h may have attributed to increase in nitrification inhibition with increasing incubation times.
Differences Between the Zinc Ion Concentration (mg/L) in the Biomass Suspensions Between the Exposure Experiments (With Zinc Oxide Nanoparticles) and Control (Without Zinc Oxide Nanoparticles)
nZnO, zinc oxide nanoparticles.
Effect of nZnO on amoA, hao, and nirK gene expression
The relative changes in transcript levels of amoA, hao, and nirK (normalized against AOB 16S rRNA gene copies) were measured by using RT-qPCR for the same samples tested for sOUR. After 3 h exposure, there was a notable decrease in amoA, hao, and nirK genes expression for 1 and 5 mg/L nZnO (Fig. 3a), however, the amoA expression was slightly stimulated upon exposure to 10 mg/L of nZnO. For 3 h exposure, the hao and nirK expression for 10 mg/L nZnO exposure sample was still less than the control but considerably higher than the 1 and 5 mg/L nZnO exposure (p < 0.05) (Fig. 3a). After 6 h exposure, there was a notable decrease in amoA, hao, and nirK gene expression levels for 1, 5, and 10 mg/L nZnO (Fig. 3b). In addition, the amoA gene expression levels were higher under 1 mg/L nZnO than the 5 or 10 mg/L ones after 6 h exposure (Fig. 3b). The amoA gene expression levels decreased with the increase of nZnO concentration, this corresponded well with the sOUR rates.

Relative change in the transcript levels of amoA, hao, and nirK measured by RT-qPCR as a function of nZnO concentration after
Effect of nZnO on ROS generation
Intracellular ROS content was determined as a function of nZnO concentrations under 3 and 6 h exposure. It was observed that the significant amounts of excessive ROS were produced in the cells of nitrifying bacteria when the total nZnO concentrations were 5 and 10 mg/L (p > 0.05) (Fig. 4). There were no significant changes in ROS content for low nZnO concentration (1 mg/L) under 3 h exposure, but it was increased slightly after 6 h exposure.
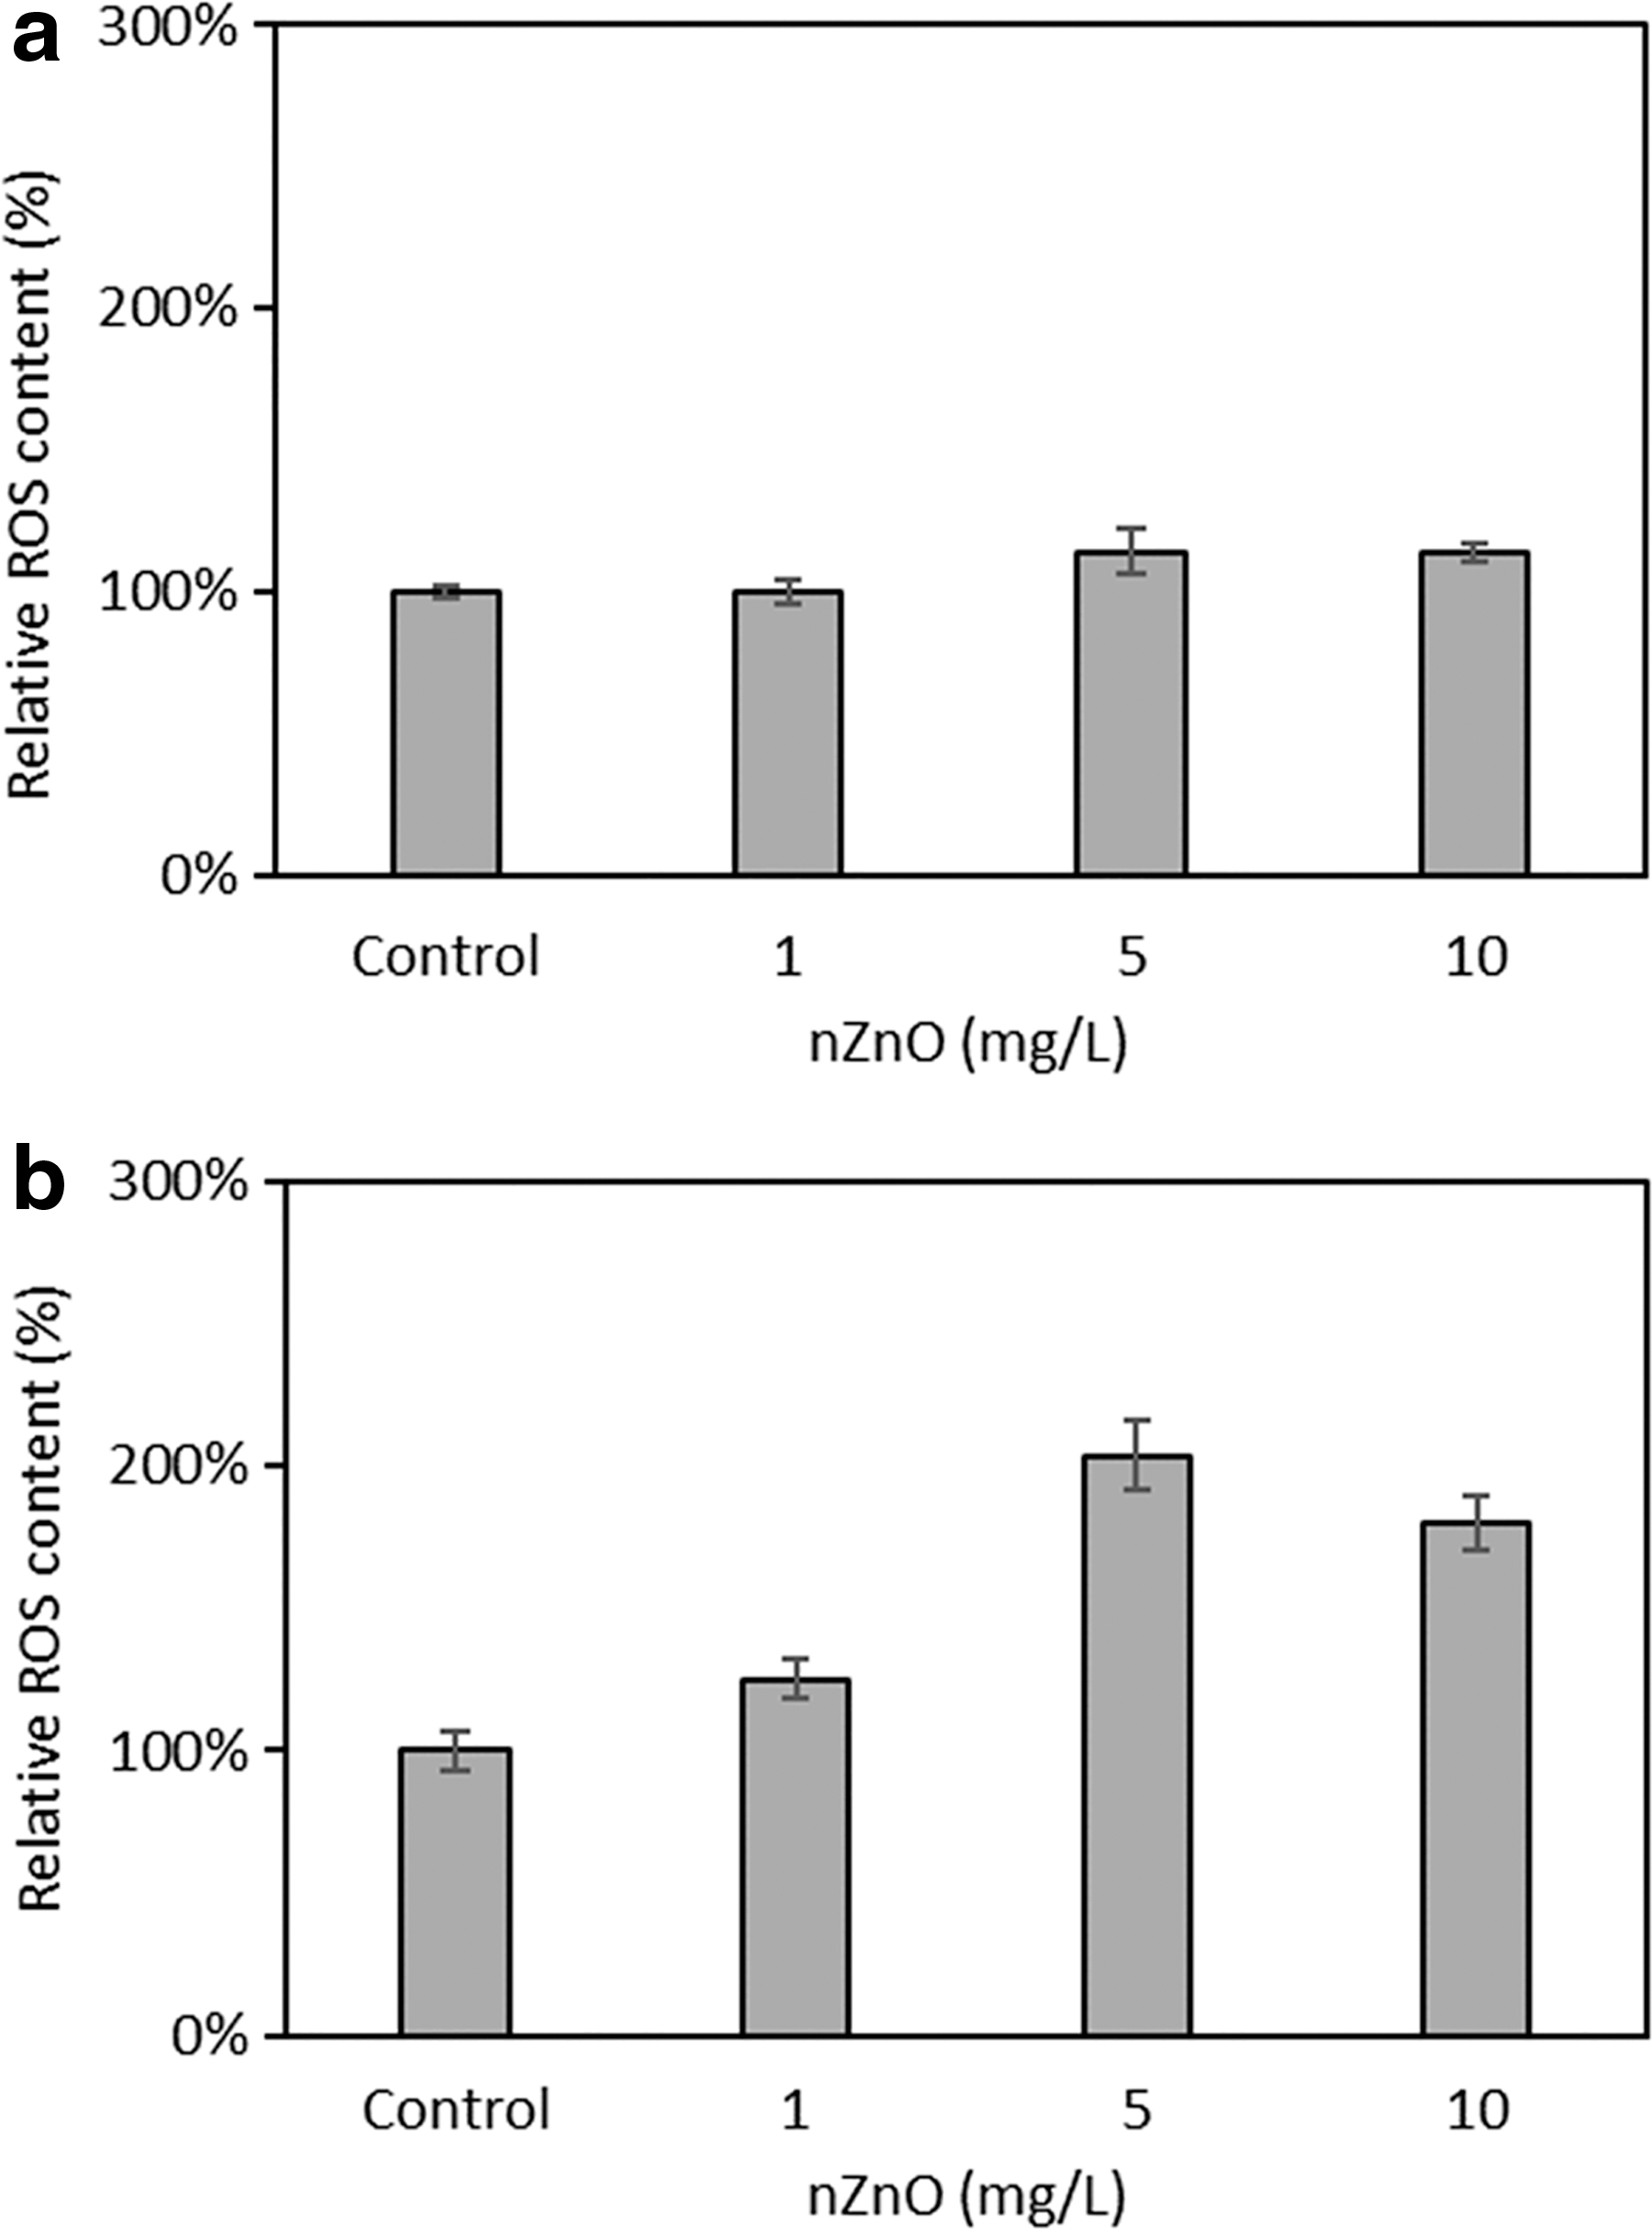
Comparison of intracellular ROS content of nitrifying bacteria as a function of total nZnO concentration after
Effect of nZnO on ammonia, nitrite and nitrate profiles during exposure experiments
The concentration profile of ammonia, nitrite, and nitrate indicated that increasing nZnO concentrations caused the inhibitory effects on the nitrification process. We conducted a nitrogen mass balance under different conditions and observed there was no loss of nitrogen during conversion from ammonia to nitrite (Supplementary Table S3). After 6 h of exposure, the final concentration of NH4+ was notably greater in the presence of 10 mg/L nZnO than its absence (8.96 vs. 5.06 mg/L) (Fig. 5a), although there were no significant changes (p > 0.05) in the NH4+ removal efficiency of the nitrifying bacterial community when they were exposed to 1 mg/L nZnO. Furthermore, there was a decrease in NO2− concentration with an increase of nZnO concentration during the course of exposure experiment from 3 to 6 h (Fig. 5b). This was attributed to the ROS production due to the presence of nZnO that could oxidize NO2− to NO3− (Supplementary Data and Supplementary Figs. S4 and S5). As a result, the average NO3− concentrations were higher in the presence of nZnO than those of control (Fig. 5c). Our data suggested that by increasing the release of nZnO into the environment could not only inhibit the ammonia oxidation process but also can lead to the significant increase in NO3− production due to the presence of ROS.
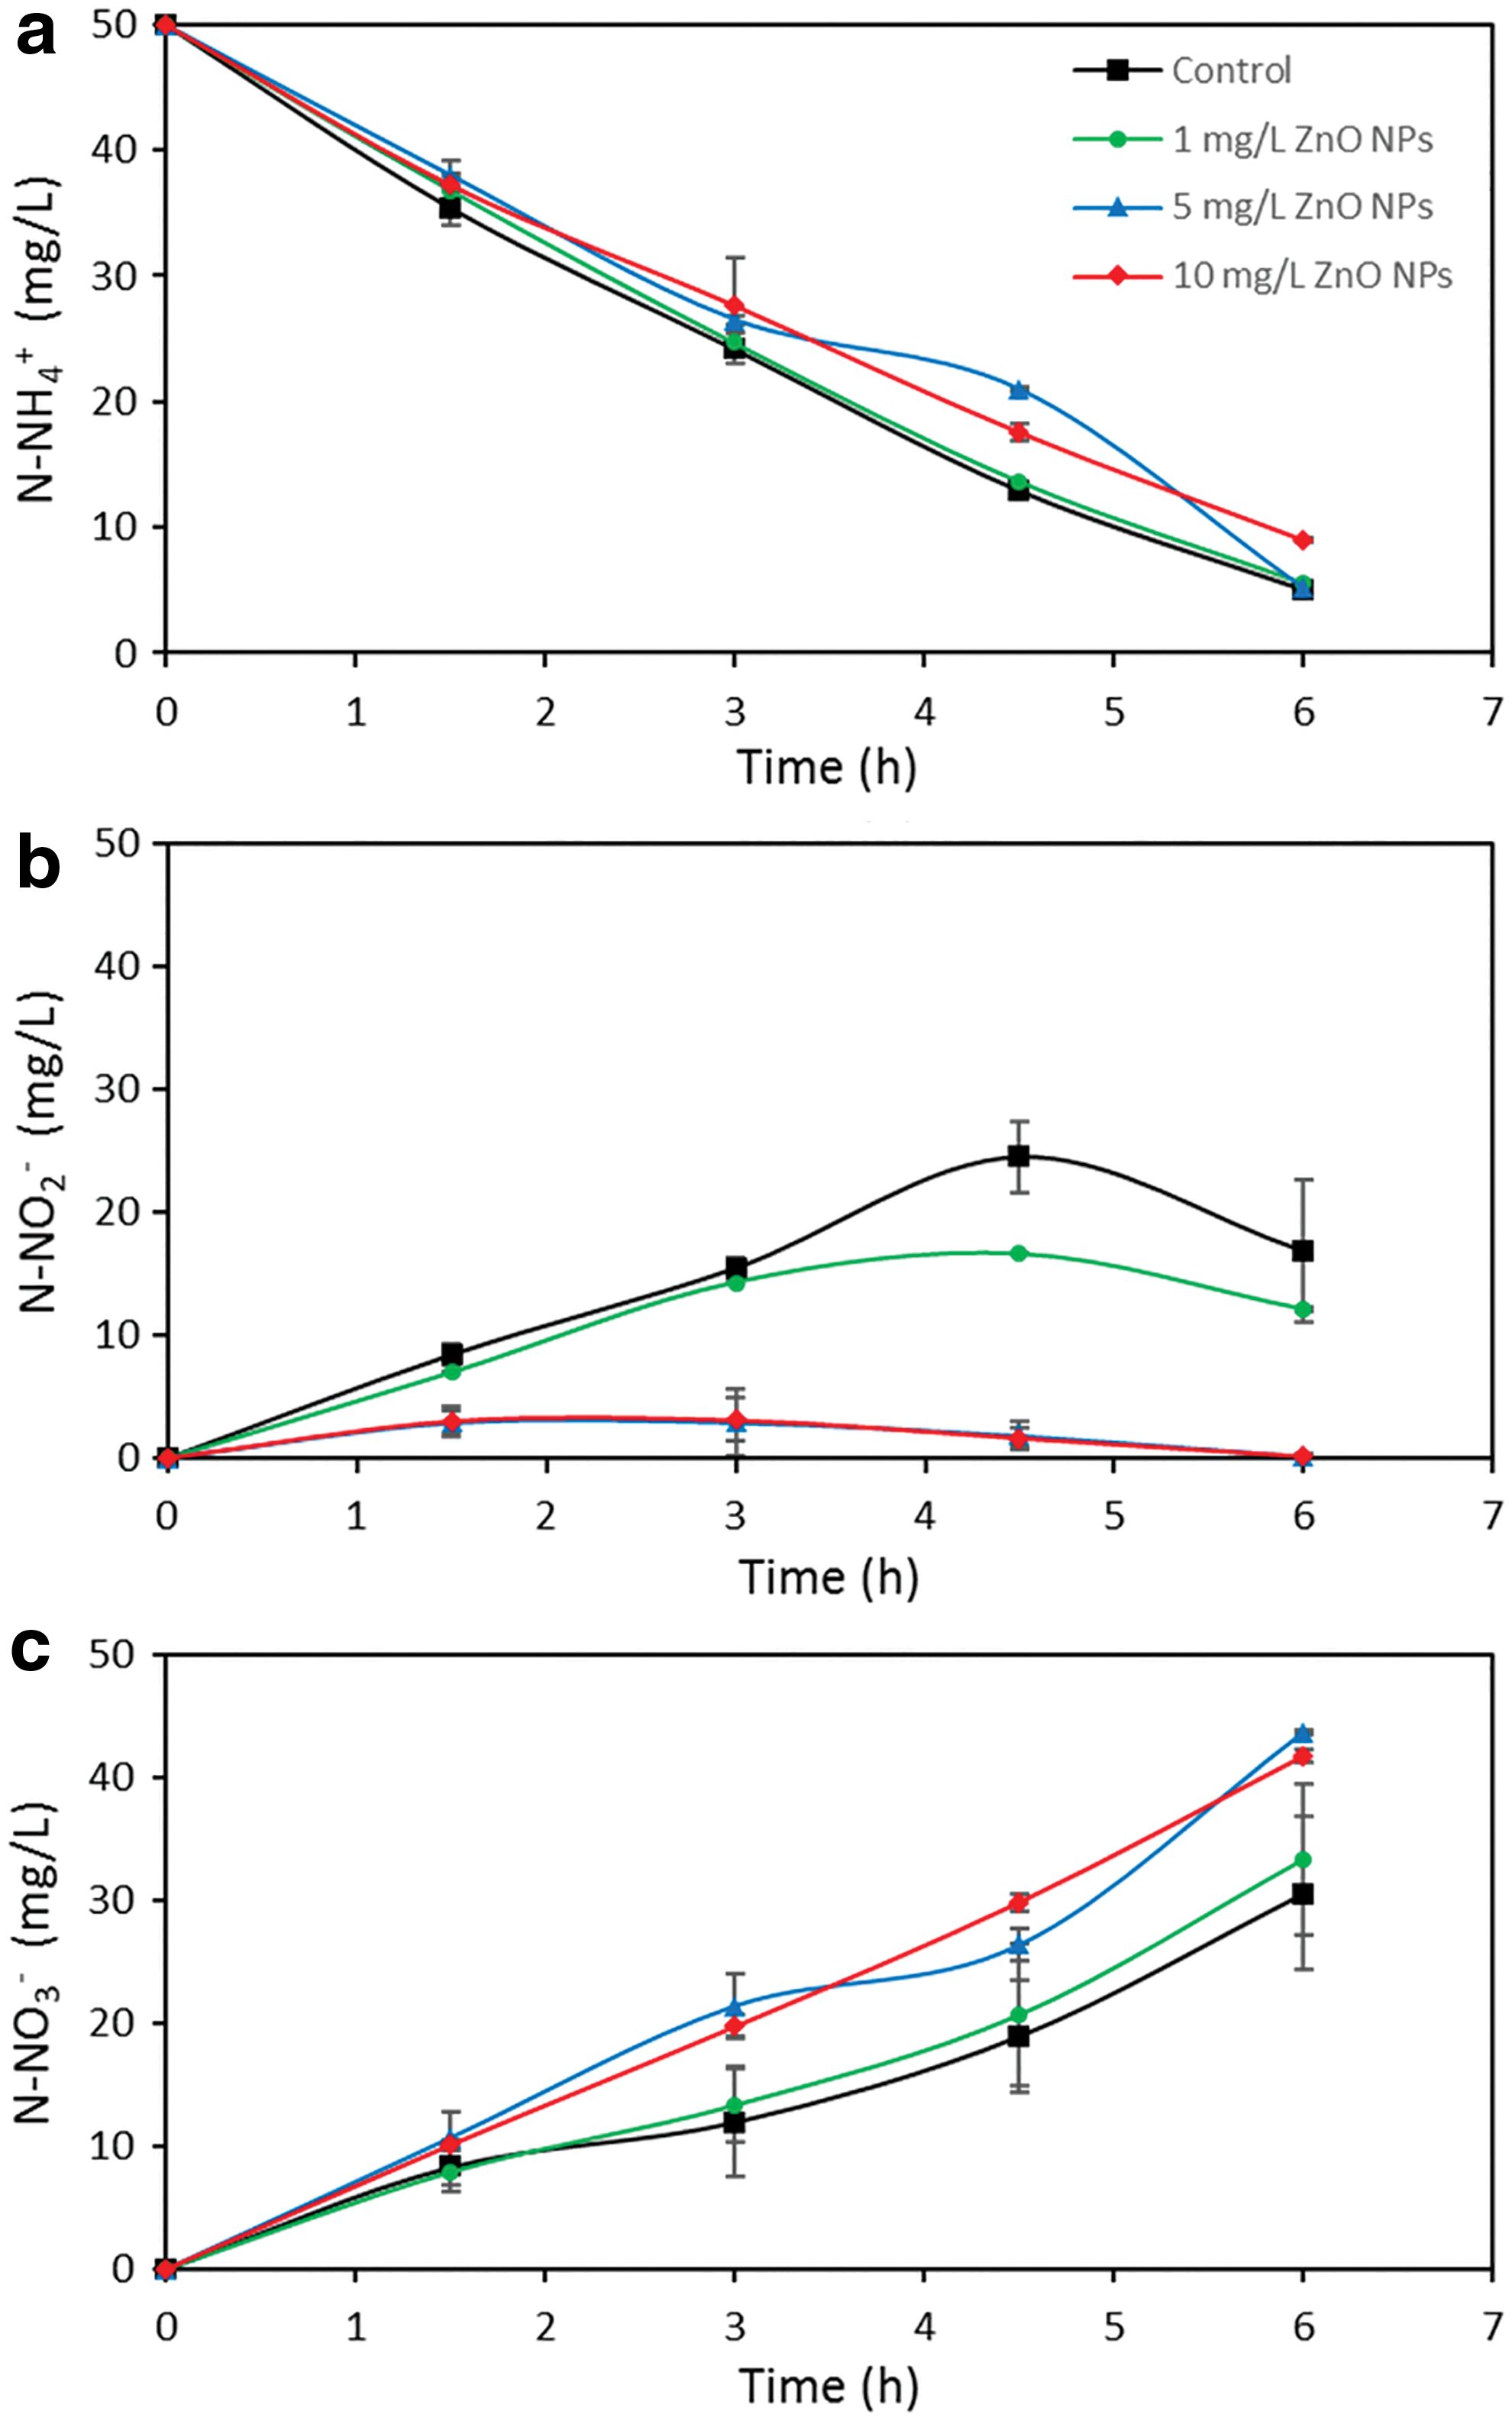
Concentrations of
Discussion
The widespread use of consumer products containing nanoparticles is causing the release of nanoparticles into the environment during their transport, manufacturing, utilization, and disposal processes (Brar et al., 2010; Brunetti et al., 2015). Several studies have used respirometry to assess the inhibitory effects of nanoparticles impacting biological processes. The decrease in respiration rates as a response to the increasing nZnO concentrations has been observed for nitrifying bacteria cultures in a previous study (Kuo et al., 2010). In our study, we observed that ammonia-dependent sOUR was significantly inhibited after exposure to 10 mg/L nZnO. In contrast, cells exposed to 1 mg/L nZnO did not exhibit considerable changes in sOUR for 3 and 6 h exposure. This is consistent with previous reports on no obvious inhibition of nitrification at low nZnO concentrations (Wang et al., 2016; Wu et al., 2018). Nitrification was only severely inhibited when nZnO levels reached either 5 or 10 mg/L. It should be noted that nanoparticles used in consumer products generally have surface functionalization, whereas nanoparticles used in our study were devoid of any surface functionalization. This can impact the fate and transport of nanoparticles, and have different inhibitory effects.
In this study, kinetics of nZnO dissolution was studied to determine the total concentration of the released Zn2+ in biomass samples. Previous studies have suggested that the release of Zn2+ due to particle dissolution play a major role on inhibition of nitrification in batch cultures (Zheng et al., 2011; Wu et al., 2018). These results were consistent with our findings that as the nZnO dissolution increases (from 1, 5, and 10 mg/L of nZnO), the sOUR-based nitrification inhibition increases as under 3 and 6 h of exposure. In another study (Kapoor et al., 2015) using zinc chloride as a source Zn2+ ions, the sOUR-based inhibition increased with Zn concentration up to 3 mg/L, after which activity did not increase upon exposure to 10 mg/L Zn. This is in contrast with our study, where we observed significant inhibition at 10 mg/L nZnO, however, the difference between the dissociated Zn2+ concentrations between these two materials and the additional inhibitory effect of nanoparticles may contribute to these differences.
There are a number of factors that could cause the variability in nitrifying bacterial inhibition rates due to the presence of nanoparticles. For example, the reported values for concentration of ZnO nanoparticles that can cause >50% decrease in nitrification activity range from 10 to 200 mg/L (Zheng et al., 2011; Yu et al., 2015). Recently, few studies have investigated this variability by characterizing the physiological and transcriptional responses of nitrifying bacteria in response to nitrification inhibition by nanoparticles; however, most of these studies have used pure cultures, mainly N. europaea as model organisms (Radniecki et al., 2011; Yu et al., 2015). Thus, limited information is available on how mixed nitrifying cultures, such as those from activated sludge, will respond to the presence of nanoparticles. In this study, we have attempted to fill this gap through detailed tracking of the physiological and transcriptional responses of nitrifying cultures as well as dissolution of nZnO throughout the exposure process.
The application of RNA-based RT-qPCR assays have already been used to measure transcript level responses of several functional genes in nitrifying enrichment exposed to different concentrations of heavy metals, including zinc (Kapoor et al., 2015, 2016b). We used a similar approach in this study to determine the impact of ZnO nanoparticles on functional gene expression in the nitrifying bacteria. An important assumption in our study is that the changes in RNA transcription levels reflect sensitive cellular responses to changing environmental conditions and could be precursors of more detrimental whole cell impacts. We investigated the transcriptional levels of amoA, hao, and nirK in response to nZnO inhibition using RT-qPCR assays. In general, decreased transcription of amoA, hao, and nirK occurred in presence of 1, 5, and 10 mg/L nZnO, however, slight upregulation in amoA expression was observed for 10 mg/L nZnO under 3 h exposure. Since the amoA gene expression is more sensitive to environmental perturbations than the substrate utilization rate, there was downregulation in amoA gene expression for 6 h exposure as the cells were approaching starvation and were also in contact with nZnO for a longer time, but the ammonia utilization rate was not affected drastically. The inhibition by nZnO may be related to dissolution of Zn ions resulting in complexation with intracellular functional groups and/or binding of metal cation at metabolic sites in enzymes, which may disrupt protein structure and function. On the contrary, the expression of ammonia oxidation process-associated amoA gene may increase due to the cells' responses to nanoparticle stress to promote the de novo AMO synthesis and overcome the AMO activity inhibition at the transcript level as observed in Zn-impacted cells in previous studies (Radniecki et al., 2009; Kapoor et al., 2015). In addition, the possible onset of a susceptibility mechanism via transcription activation of the antioxidant response elements or detoxification enzymes in cells impacted by high dosage of nanoparticles (Nel et al., 2006) might contribute to the higher amoA gene expression levels observed in the cells exposed to 10 mg/L nZnO for 3 h than the 1 or 5 mg/L ones to regain the required AMO activities at the genetic level. In wastewater treatment systems prone to acute exposure, changes in gene transcription levels may be more dramatic and could supplement sOUR-based assays as early warning indicators to avoid excessive nitrification inhibition.
Several studies have reported that metal oxide nanoparticles were able induce ROS production in bacterial cells, thereby causing adverse effects on microorganisms. Intracellular ROS were found to be harmful to cytoplasmic lipids, proteins, and other intermediates in bacterial cells (Kumar et al., 2011; Ezraty et al., 2017). In addition, cellular internalization and/or attachment of nanoparticles to cell surface may lead to alterations in the cells' morphology (Xie et al., 2011). Previously published research has suggested that ZnO nanoparticle-induced cytotoxicity may involve membrane damage due to the accumulation of ZnO nanoparticles in the bacterial membrane (Brayner et al., 2006), and ROS production, which subsequently damage significant macromolecules, including DNA, lipoproteins, and enzymes (Zheng et al., 2011). In our study, notable increase in intracellular ROS content was observed with increasing dose of nZnO, which also correlated well with sOUR-based inhibition in nitrification activity. Our results were also consistent with a previous study that reported an increase in ROS content with an increase in nZnO concentration after 12 h exposure (Wu et al., 2018). Generally, nanoparticles can easily lead to ROS production, because of their exceptionally small sizes and high catalytic activities. This behavior might induce changes in cell physiology as well as other chemical responses, such as catalytic oxidation of NO2− to NO3−, as observed in our study.
From a fundamental viewpoint, this study is one of the first contemporaneous and complementary examinations of process performance, biokinetics, gene expression, and chemical signatures to study nitrification inhibition by nanoparticles. From a practical engineering perspective, the potential of functional gene expression (amoA, hao, and nirK genes) as a predictive biomarker in conjunction with sOUR as a chemical marker of nitrification performance was investigated. We have determined the concentrations of ZnO nanoparticles that are inhibitory to the nitrifying bacteria in activated sludge systems and delineated the underlying factors responsible for inhibition of nitrification by these nanoparticles. It should be noted that the composition of the common primary and secondary influent in WWTPs typically have more constituents and are more complex than the media used in this study. Therefore, additional research with more complex wastewater streams is needed to determine the impact of nZnO on nitrification in engineered systems. Furthermore, the batch conditions that we used in this study provided important insights into the possible inhibition mechanism due to the impact of nZnO to nitrifying bacteria. Further studies with continuous systems that are much closer to the real wastewater treatment systems are warranted to have better understanding of the inhibition mechanisms. Ultimately, the methodology used herein will serve as a valuable tool to assess the microbial toxicity of emerging nanomaterials and provide recommendations for mitigating the harmful effects of nanoparticles on important biological processes.
Conclusions
In this study, the effect of nZnO on nitrification activity was assessed by using molecular methods (functional gene expression) combined with conventional nitrification inhibition assays (i.e., sOUR and ROS) to better understand the response of nitrifying bacteria in activated sludge systems in the presence of nZnO. The transcript level of amoA, hao, and nirK were measured in enriched nitrifying bacterial cultures exposed to ecologically relevant concentrations of nZnO. There were considerable changes in the expression level of the studied functional genes which corresponded well with sOUR assay. It was observed that nZnO are inhibitory to nitrification activity for concentrations above 1 mg/L. It was speculated that nitrification inhibition was caused due to the release of zinc ions during ZnO NP dissolution, and generation of ROS due to catalytic activity of nanoparticles. Thus, the inflow of higher concentrations of nZnO to WWTPs could have harmful effects on nitrifying bacteria that can inhibit the nitrogen removal.
Overall, the results presented here validate the use of molecular methods as tools that complement conventional respirometry assays to better evaluate the response of nitrifying bacteria to the presence of nanoparticles. We demonstrated that RNA-based RT-qPCR assays can be used to quantify the relative expression of functional genes such as amoA and hao for nitrifying bacteria exposed to nZnO and therefore may be used in conjunction with sOUR for better understanding the effects of harmful contaminants on biological processes.
Footnotes
Acknowledgments
We thank Christopher Impellitteri and Jorge Santo Domingo (U.S. Environmental Protection Agency) for donating components of the bioreactor. We thank the San Antonio Water System for supplying the activated sludge to support this project. The authors thank the Kleberg Advanced Microscopy Center and Dr. Kelly Nash's research group, and Dr. Heather Shipley's research group at UTSA for their help in nZnO characterization and zinc dissolution measurements.
Author Disclosure Statement
No competing financial interests exist.
Funding Information
D.C.P. was supported, in part, by the Graduate Presidential Distinguished Research Fellowship at University of Texas at San Antonio.
References
Supplementary Material
Please find the following supplemental material available below.
For Open Access articles published under a Creative Commons License, all supplemental material carries the same license as the article it is associated with.
For non-Open Access articles published, all supplemental material carries a non-exclusive license, and permission requests for re-use of supplemental material or any part of supplemental material shall be sent directly to the copyright owner as specified in the copyright notice associated with the article.