
Abstract
Natural bentonite is an adsorbent that can be easily modified as a low-cost material effective for the removal of persistent pharmaceutical micropollutants from water bodies. In this study, the modification of untreated bentonite by sodium is addressed to obtain Na-bent, which was further modified with L-Tryptophan (L-Trp) as well as with FeCl2.4H2O to produce Trp-Na-bent and Fe-Na-bent, respectively. The nonmodified and modified bentonite samples were tested for the adsorption of the pharmaceutical micropollutant 17α-ethinylestradiol (EE2) present in water bodies, a synthetic estrogen with very high toxicity. The structure of bentonite, before and after modification, was characterized using Fourier transform infrared, X-ray diffraction, Brunauer-Emmett-Teller, and thermal analysis (thermogravimetric analysis and differential scanning calorimetry) techniques. The influence of various experimental parameters on the adsorbent/adsorbate interaction was investigated. Equilibrium and kinetic studies of EE2 micropollutant adsorption were performed varying the initial adsorbate concentration, mass of bentonite, and contact time. The maximum adsorption for an initial concentration of 10 mg/L of EE2 was 4.20 mg/g, reaching the equilibrium after 2 h. The equilibrium data were fitted with Langmuir, Freundlich, and Dual-mode model equations. Adsorption kinetic data were analyzed using the pseudo-first order, pseudo-second order, and intraparticle diffusion models. The pseudo-second order model was the one that better described the kinetic data. The highest value of the equilibrium rate constant was obtained for Trp-Na-bent, followed by Fe-Na-bent. The results obtained show that the Trp-Na-bent complex exhibits a promising performance for the adsorption of EE2.
Introduction
The contamination of aquatic and terrestrial environments by xenobiotics is becoming a growing health risk (Togola et al., 2008). The presence of pharmaceuticals and personal care products has been identified in surface and wastewater since the 1960s, in the United States and Europe (Deegan et al., 2011; Kyzas et al., 2015). The potential ecological risks of synthetic estrogens present in human drugs were identified in river fishes showing disturbances in their growth and reproduction (Carlsson et al., 2006). The reason for pharmaceuticals being an environmental problem is linked to their specific biological effects not only in humans but also in aquatic organisms (Doll and Frimmel, 2003; Laurenson et al., 2014). Several studies have demonstrated the presence of more than 80 pharmaceutical compounds in wastewater from urban and hospitals at concentrations ranging from ng/L to μg/L (Furgal et al., 2014; Wu et al., 2017). However, even at very low concentrations, some of these compounds may have short- or medium-term toxic effects on the environment (Gunnarsson et al., 2019).
A variety of treatment methods has been employed to remove several pharmaceutical compounds and hormones present in wastewaters, such as photocatalysis using ultraviolet (UV) and UV/H2O2 processes (Zhang et al., 2010; Nasuhoglu et al., 2012), electrochemical degradation (Feng et al., 2010a), biodegradation (Moschet, 2009), ozonation (Ternes et al., 2002), electrocoagulation (Ouaissa et al., 2014), Fenton process (Zhao et al., 2008), membrane processes (Sanches et al., 2012), combined coagulation-adsorption (Joseph et al., 2013), and adsorption (Kyzas et al., 2015). However, their implementation is still expensive.
Regarding the adsorption processes, activated carbon is one of the most commonly used adsorbents to remove organic and inorganic pollutants from wastewater. Although activated carbon presents high adsorption capacity, due to its high specific surface area, it is an expensive adsorbent material.
This work aims at assessing the use of cheaper natural materials for the adsorption of pharmaceutical pollutants. Hence, the objective is to evaluate a natural material, a low-cost clay, which exhibits a high adsorption capacity (Cheknane et al., 2010; Hua, 2015) and can be further modified with organic and/or inorganic substituents.
The most important properties of clays are their chemical and mineral composition, particularly the presence of montmorillonite, which is the essential element of bentonite.
Bentonite was selected for this study based on its lack of toxicity, high specific surface area, cation exchange ability, hydration, swelling, and presence of specific active sites and hydrophilicity that allow for easy fixation of biomolecules and the adsorption of a large diversity of substances, namely organic micropollutants (Orolínová et al., 2012; Kalburcu et al., 2014). Moreover, bentonite is a low-cost material, ∼0.17€/kg, being its price near 2 orders of magnitude lower in comparison to other adsorbents: activated carbon (∼7€/kg), activated alumina (∼8.5€/kg), and molecular sieves (∼11€/kg). This material is composed of a clay mineral layered structure of montmorillonite, with quartz and calcite as main impurities. The layer structure consists of sheets of octahedral alumina and tetrahedral silica shared in a 2:1 ratio (Bilgiç et al., 2014; Kalburcu et al., 2014). Montmorillonite can be described as Mx(Al4−xMgx) Si8O20(OH)4, where M is the monovalent cation and x is the degree of replacement (Kim and Park, 2007).
Since clays have an extreme low adsorption capacity to anionic or neutral and hydrophobic molecules, due to their negative charge and hydrophilic surface, the amphoteric nature of amino acids may present a potential advantage for improving the selectivity and adsorption capacity of these materials by adjusting the environmental conditions (e.g., pH). In this context, L-Tryptophan (L-Trp) was selected to modify untreated and purified bentonite, to increase its ability for the adsorption and removal of target organic micropollutants from aquatic environments. It is useful to stress that L-Trp is an essential amino acid for humans and animals (Leuchtenberger et al., 2005; Ikeda, 2006), and its use does not represent an environmental risk (Xie et al., 2011).
17α-ethinylestradiol (EE2) was selected as a target organic micropollutant for this study. It is a synthetic estrogen, being the main compound used in birth control pills (excreted by urine) and has been also found in surface waters at ng/L levels (Snyder et al., 2007; Jardim et al., 2012). Its toxicity is up to 50 times higher compared with estrone and 17b-estradiol (Joseph et al., 2013).
The objective of this study is to evaluate the use of modified clays, testing different approaches: modification with L-Trp and modification with FeCl2.4H2O, organic clay and inorganic clay complexes, respectively. The structure and texture of the clay samples were characterized by X-ray diffraction (XRD), Fourier transform infrared (FTIR), thermal analysis (thermogravimetric analysis and differential scanning calorimetry [DSC/TG]), and the Brunauer-Emmett-Teller (BET) specific surface area techniques. The clay complexes were then tested for the adsorption of the hormone 17α-ethynylestradiol. The adsorption parameters were optimized, namely, the initial concentration of EE2, the mass of adsorbent, and the contact time between adsorbent and adsorbate. Moreover, to describe the interaction between the molecules of adsorbate and the adsorbent surface, the equilibrium data at different concentrations were fitted by nonlinear isotherm models, such as Langmuir, Freundlich, and Dual-mode model equations.
The adsorption kinetic data obtained were also examined by employing pseudo-first order, pseudo-second order, and intraparticle diffusion models.
As an outcome of this study, it is expected to gather a better understanding of the performance of modified bentonite, both in terms of its equilibrium and kinetics behavior, for the adsorption of a target organic micropollutant, EE2, which represents a group of compounds of growing environmental concern.
Experimental Procedure and Theoretical Background
Materials and reagents
The sample of raw bentonite used in this study was provided by Chemical Ltd., National Company of non-Ferrous (ENOF). The predominant component of the bentonite is Ca-montmorillonite with a particle size of 74 μm. The dry solids were sieved through a 45 μm sieve and characterized before its use in all experiments.
NaOH, HCl, NaCl (purity 99.5%), FeCl2.4H2O (99% purity Reagent Plus), NaBH4 (powder 98%), L-Trp with purity higher than 98%, 17α-ethinylestradiol (C20H24O2; 98% purity), acetonitrile, and ethanol were purchased from Sigma-Aldrich (Milan, Italy) and used without further purification.
Purification and modification of the bentonite
The Na-bent was prepared by classical NaCl treatment. Fifty grams of raw bentonite was added to 500 mL of 1 M NaCl solution and stirred magnetically for 24 h. After three successive treatments, the supernatant was washed with distilled water until complete elimination of chloride ion, confirmed by AgNO3, and the dispersion was centrifuged at 4,000 rpm. The Na-bent was recovered by decantation and dried at 105°C for 24 h, ground with mortar, sieved, and particles with size ≤45 μm were collected. The Trp-Na-bent materials were prepared according to a modified literature method (Marsal et al., 2009). The cation exchange capacity (CEC) of Na-bent (98.37 meq/100 g) was calculated by the classical BaCl2/MgSO4 method (Choo and Bai, 2016). The Na-bent was dispersed at 1% (w%) in a solution containing L-Trp (0.20 g/g of clay) with the amount equivalent to 1 time of CEC of Na-bent. The mixture was stirred for 24 h at room temperature, and then the dispersion was centrifuged and washed with deionizer water. The Trp-Na-bent was finally dried at 105°C for 24 h in the oven. Afterward, it was crushed and sieved for collection of particles with a size lower than 45 μm.
The Fe-Na-bent was prepared by borohydride reduction (Shahwan et al., 2010) at an Fe-/Na-bent mass ratio of 2:25 w/w. Three grams of FeCl2.4H2O was dissolved in 300 mL of ethanol/MilliQ water (80:20, v/v) mixture, and then 10 g of Na-bent was added to this mixture and stirred for 4 h. The borohydride solution, prepared by dissolving 6 g of NaBH4 in 1,000 mL of MilliQ water, was added at a rate of 5 mL/min to the dispersion (Na-bent/iron). After completing addition, the dispersion was stirred for 1 h; then the solid phase was filtered and washed three times with absolute ethanol and finally dried at 50°C for 24 h in the oven.
Characterization of the adsorbents
The adsorbents were analyzed by XRD. The XRD pattern was recorded on a RIGAKU Miniflex II diffractogram type, from 2θ = 3° to 80°, 2°/min using Cu Kα radiation at 30 kV and 15 mA. The FTIR was performed using a Perkin Elmer Spectrum 2 FTIR spectrometer, in pressed KBr pellets at a resolution of 4 cm−1 in a spectral range between 4,000 and 400 cm−1; the coupling between thermogravimetric analysis and differential scanning calorimetry (DSC/TG) makes possible to observe a mass variation and its associated thermal effect, using Instrument SDT Q600 V20.9 Build 20 (0600-1671). The analyses were carried out from room temperature up to 1,000°C, under an argon atmosphere, with a heating rate of 10°C/min. The BET specific surface area was measured by nitrogen adsorption at 77 K using the ASAP 2010 Micromeritics equipment.
Determination of point of zero charge (pHpzc) of adsorbents
The pHpzc of adsorbents was determined by a pH titration procedure. Fifty cubic centimeters of 0.01 M NaCl solution was poured in several Erlenmeyers flasks. The initial pH (pHinitial) values of the NaCl solutions in each flask were adjusted to a desired value between 2 and 12 by addition of HCl 0.1 M or NaOH 0.1 M solutions, and then 0.15 g of each adsorbent was added to each flask. The dispersions were shaken and allowed to equilibrate for 48 h, and afterward, were centrifuged at 4,000 rpm for 10 min and the final pH (pHfinal) of the supernatant liquid was measured. The pHpzc is defined as the point where the curves pHfinal and pHinitial cross the line pHpzc = pHinitial (Putra et al., 2009; Santos et al., 2016).
Adsorption tests
The adsorption of the EE2 pollutant (pKa = 10.4) was studied. The solutions were filtered using an organic Millipore membrane filter of 0.2 μm and analyzed by HPLC at a 222 nm wavelength. A stock solution of EE2 was prepared by dissolving 30 mg of 17α-ethinylestradiol in 20 mL of acetonitrile. The stock solution was diluted to obtain the defined concentrations and the adsorption experiments were carried out using a batch procedure, under room temperature. The pH values were adjusted with a negligible amount of 0.1 M HCl or NaOH. In all adsorption experiments, the measurements were performed after 10 h of equilibrium time.
The adsorbent phase concentration in equilibrium with the liquid phase was obtained by the following equation (Xie et al., 2011):
where C0 and Ce are the initial and equilibrium concentrations (mg/L) of adsorbate in the liquid phase, respectively. qe is the amount adsorbed per mass unit of adsorbent at equilibrium (mg/g), and V and W are the initial volume of adsorbate solution (L) and the mass of adsorbent (g), respectively.
Isotherms and kinetics of adsorption: experimental procedure and calculation methods
The adsorption isotherms are important to describe the interaction between adsorbate and adsorbent. Several models have been published in the literature (Putra et al., 2009; Rahardjo et al., 2011; Sadeghalvad et al., 2016) to describe the experimental data of adsorption isotherms. In the systems presented in this work, Langmuir, Dual-mode model and Freundlich equations with distinct and specific assumptions were applied to understand the adsorption mechanisms involved in the equilibrium. The most common model is the Langmuir model (Dada et al., 2012), which is widely used to describe adsorption phenomena. The Langmuir isotherm model considers that a simple molecular layer is established on a homogeneous surface of adsorbent and that the molecules are adsorbed in a specific site. The repulsion between adsorbed molecules results in a monolayer. The Langmuir model adsorption is also reversible, including the desorption step. This model predicts the number of adsorbed molecules in the monolayer to cover the surface of the adsorbent. The nonlinear expression form of the Langmuir isotherm (Metwally and Ayoub, 2016) is given by the following expression:
where qe, qmax, Ce, and kL are the amount of adsorbate per mass unit of adsorbent at equilibrium (mg/g), qmax is the maximum monolayer adsorption capacity (mg/g), Ce is the equilibrium concentration of adsorbate in solution (mg/L), and kL is the sorption equilibrium constant (L/mg). The combination of the Langmuir model, which assumes a site-specific adsorption mechanism, with a partitioning mechanism occurring simultaneously results in the Dual-mode sorption model. The equilibrium isotherm form of the Dual-mode model (Huh et al., 2000) is given by the following equation:
where Ce is the equilibrium concentration of adsorbate and qe is the amount adsorbed per mass unit of adsorbent at equilibrium (mg/g). qmax and kL are the maximum monolayer adsorption capacity (mg/g) and the Langmuir isotherm constant (L/mg), respectively. The parameter kd is the partition coefficient of the adsorbate in the partition medium.
Moreover, to describe a nonideal adsorption on heterogeneous surfaces involving the formation of multilayers, the Freundlich isotherm was proposed and it can be represented by the following equation:
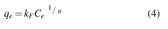
where kF represents the Freundlich constant and n is related with the adsorption intensity.
Regarding the adsorption kinetic behavior, it may be described by several methods; however, the most investigated and applied are the pseudo-first order, the pseudo-second order, and the intraparticle diffusion model, which are applied to dynamical experimental data. The pseudo-first order kinetic model (Çalişkan Salihi and Mahramanlioğlu, 2014), also known as the Lagergren model (Yuh-Shan, 2004), considers that the rate of occupation of the adsorption sites is proportional to the number of unoccupied sites. The kinetic rate constant can be determined using the Lagergren's pseudo-first order equation (Yuh-Shan, 2004) in the following form:
where qe and qt are the amounts of adsorbate at equilibrium and at any time t (mg/g), respectively, and k1 is the pseudo-first order rate constant (min−1).
The pseudo-second order (Ho and McKay, 1999) kinetic model is based on the step of limiting the rate of sorption on the solid phase, which involves chemisorption. The model is represented by a nonlinear form. The kinetic rate equation (Ho and McKay, 1999) can be expressed in the following form:
where, k2 is the equilibrium rate constant of pseudo-second order model (g/mg min).
To understand the mechanisms that control the adsorption kinetics, the intraparticle diffusion model (Mahmoud et al., 2016) was applied, using the relationship between specific sorption (qt) and the square root of time (t0.5) by the following equation:
where ki is the intraparticle diffusion constant (mg/g·min0.5) and C (mg/g) is the interception.
Results and Discussion
Characterization of the adsorbents
The XRD patterns of the bentonite samples are shown in Supplementary Fig. S1. The presence of montmorillonite, which is the major phase in the material, can be confirmed by peaks that become more intense after purification at precise values of 2θ (6.54°, 19.83°, 34.74°, and 61.83°). These peaks are the indicative reflections of 2:1 swelling clays. The (0 6 0) reflection at 2θ = 61.83°, characteristic of the dioctahedral structure (Yang et al., 2010), was observed in all samples. The other peaks represent the impurities corresponding to different compounds: quartz is observed at 2θ = 26.65° with d101 = 3.34 A˚, dolomite at 2θ = 21.94° with d101 = 4.05 Å and 2θ = 30.83° with d104 = 2.90 Å, and calcite at 2θ = 30.37° with d104 = 3.04 Å. It can be noticed that the intensity of these peaks decreases after purification. Also, according to the XRD results, the value of d001 for untreated bentonite (Supplementary Fig. S1a) is 13.5 Å, which is reported by other works as Ca-bentonite (Karakaya et al., 2011; Salem et al., 2015).
The d001 basal spacing value of Na-bent (Supplementary Fig. S1b) determined as 12.86 Å at 2θ = 6.85°, comparing to that untreated bentonite, proves the presence of the Na+ cation in the interlayer space of bentonite, after purification. After modification of Na-bent, the d001 basal spacing value of Trp-Na-bent (Supplementary Fig. S1c) was determined as 15.04 Å at 2θ = 5.87°. This increase is due to the impregnation of the L-Trp molecule into the Na-bent interlayer space, in agreement with the results reported by Kalburcu et al. (2014). In the case of Fe-Na-bent (Supplementary Fig. S1d), this sample presents an opaque black appearance; however, the XRD shows some unchanged peaks, (19.76°, 23.4°, 34.7°, and 61.8°) compared with Na-bent. Due to that, means the montmorillonite still remains and also, it can be noticed at the mangling of peak d(001), due to Fe2+ ions' adsorption that replaces Na+ exchangeable cation interlayer.
The FTIR spectra, observed in Supplementary Fig. S2a and b of the untreated bentonite and Na-bent, respectively, exhibit characteristic bands of montmorillonite with a high amount of AL3+ in the octahedral sheet. The IR spectrum shows several peaks of vibration, characteristic of montmorillonite located at 3,620, 3,460, 1,044, 519, and 468 cm−1. The broad band at 3,620 cm−1 is due to the hydroxyl stretching vibrations of AL-O-H, and around 3,460 and 3,455 cm−1 indicates the free O–H stretching vibration of water molecules adsorbed on the bentonite. The less intense band at 1,638 cm−1 is attributed to the angular deformation of the H–OH group (Xu et al., 2000). The strong band that slightly shifted between 1,044 to 1,049 cm−1 after purification represents the Si–O–Si stretching vibration groups of the tetrahedral sheet (Yang et al., 2010), which is retained in the matrix. The spectral band at 920 cm−1 reflects the stretching vibration of AL–O–(OH)–AL and at 874 cm−1, it is assigned to the bending vibration of ALMgOH (Yang et al., 2010) on the edges of the clay mineral layers (Hassanien et al., 2010). The bands at 468 and 519 cm−1 correspond to Si–O–Si and Si–O–Al bending vibrations (octahedral AL) (Zaitan et al., 2008), respectively. A sharp band at 797 cm−1 indicates a quartz mixture in the bentonite, which has been confirmed by XRD. The organic impurities were confirmed with the apparition of two bands easily identified in the spectrum at 2,985 and 2,879 cm−1, corresponding to the stretching vibrations of asymmetric and symmetric C-H bonds, respectively. It was noticed with the purification process, a slight shift in the bands of the referred samples. After the modification step, the FTIR spectrum of Trp-Na-bent and Fe-Na-bent (Supplementary Fig. S2c, d, respectively) showed additional effects in both stretching vibration OH groups and in the H2O molecules. Also, the band at 1,431 cm−1 observed with Trp-Na-bent is attributed to the C = N stretch.
Moreover, the overall DSC/TG profiles of the untreated, purified, and modified bentonite are shown in Supplementary Fig. S3. The DSC profile shows, for all the samples, two dominant endothermic peaks detected in the temperature ranges of 27–200°C and 600–700°C. The first peak is related to the physisorbed and interlayer water molecule loss of bentonite and the second peak is related to the dehydroxylation of OH groups of the octahedral sheet (Orolínová et al., 2012). The mass loss percentage for untreated bentonite (Supplementary Fig. S3a), Na-bent (Supplementary Fig. S3b), Trp-Na-bent (Supplementary Fig. S3c), and Fe-Na-bent (Supplementary Fig. S3d) is 4.89%, 4.25%, 5.95%, and 4.85%, respectively. The small endothermic peak observed only for the untreated bentonite at 727°C is probably due to carbonate decomposition (Maitra et al., 2005) with a mass loss of 2.52%, in the temperature range between 600°C and 727°C. Also, the exothermic peak observed for the sample Fe-Na-bent in comparison with the Na-bent sample at 450°C can be attributed to the phase change of the iron with an increase of 1.54% in mass. The TG curves show a plateau between 700°C and 1,000°C with 0.37% mass loss for all samples. The total mass lost for untreated bentonite, Na-bent, Trp-Na-bent, and Fe-Na-bent is 10.63%, 8.74%, 10.14%, and 6.65%, respectively. The difference in mass loss between untreated bentonite and Na-bent is due to the purification of the bentonite. In the case of Trp-Na-bent, the degradation of the L-Trp molecule leads to the highest mass loss, in contrast with the lowest mass loss observed for the Fe-Na-bent, due to the presence of iron and its phase change. Moreover, the specific surface areas determined by the nitrogen adsorption-desorption isotherms at 77 K of the untreated bentonite, Na-bent, Trp-Na-bent, and Fe-Na-bent samples are depicted in Supplementary Fig. S4.
From the results of BET specific surface area measurements (Brunauer et al., 1940), the specific surface area of untreated bentonite (38.35 m2/g) was smaller compared with Na-Bent (54.59 m2/g), indicating that the specific surface increased after purification, corresponding to an increase in the pore volume. According to Supplementary Fig. S4, the recorded isotherms have similar profiles for untreated bentonite (Supplementary Fig. S4a) and Na-bent (Supplementary Fig. S4b) samples. They have the typical shape of mesoporous materials that belong to the Type IV, with an obvious hysteresis loop of type H3 (Rouquerol et al., 1999), which confirms that the material possesses a continuous distribution of mesopores and macropores.
However, the pore size distribution determined by the Barrett-Joyner-Halenda method is around an average value, which is nearly the same order of magnitude for both samples. The porous volume and pore size diameter of untreated bentonite and Na-bent were 0.109 cm3/g, 0.191 cm3/g, 159.37 Å, and 182.83 Å, respectively. The increase in the porous volume and size is due to the elimination of impurities and the pores turning accessible to the nitrogen molecules. After modification of Na-bent, the specific surface area of Trp-Na-bent and Fe-Na-bent reached the values 16.70 and 32.18 m2/g, respectively.
The great decrease in the specific surface area for Trp-Na-bent (Supplementary Fig. S4c) compared with that of Na-bent is because the pores and interlayer spacing are covered by the L-Trp molecule, which results in the inaccessibility of the internal surface to the nitrogen gas. Similar results have been found in the literature (Kalburcu et al., 2014; Zaghouane-Boudiaf et al., 2014). In the Fe-Na-bent (Supplementary Fig. S4d) sample, there was a decrease in the specific area, probably attributed to the replacement of AL3+ ions by Fe2+ in the octahedral sheet. The volume and pore size distribution for the Trp-Na-bent and Fe-Na-bent were 0.120 cm3/g, 0.189 cm3/g, 260.47 Å, and 214.34 Å, respectively. The increase in pore diameter can be attributed to the mesoporous and macroporous structures generated in the interlayer space.
Moreover, the non-local density functional theory model was applied to describe the porous size distribution of the four samples, representing dV/dW the pore volume as a function of pore width, shown in Supplementary Fig. S5, added as supporting information. Regarding the point of zero charge (pHpzc) determination, the results are depicted in Fig. 1. The pHpzc obtained for the Na-bent and Trp-Na-bent are, respectively, 6.5 and 7.14, but for Fe-Na-bent and untreated bentonite, it is around 8.4. The noticeable differences can be probably due to the presence of more hydroxyl groups in the untreated and modified bentonite. These results are in agreement with the ones reported by other authors (Mnasri et al., 2014).
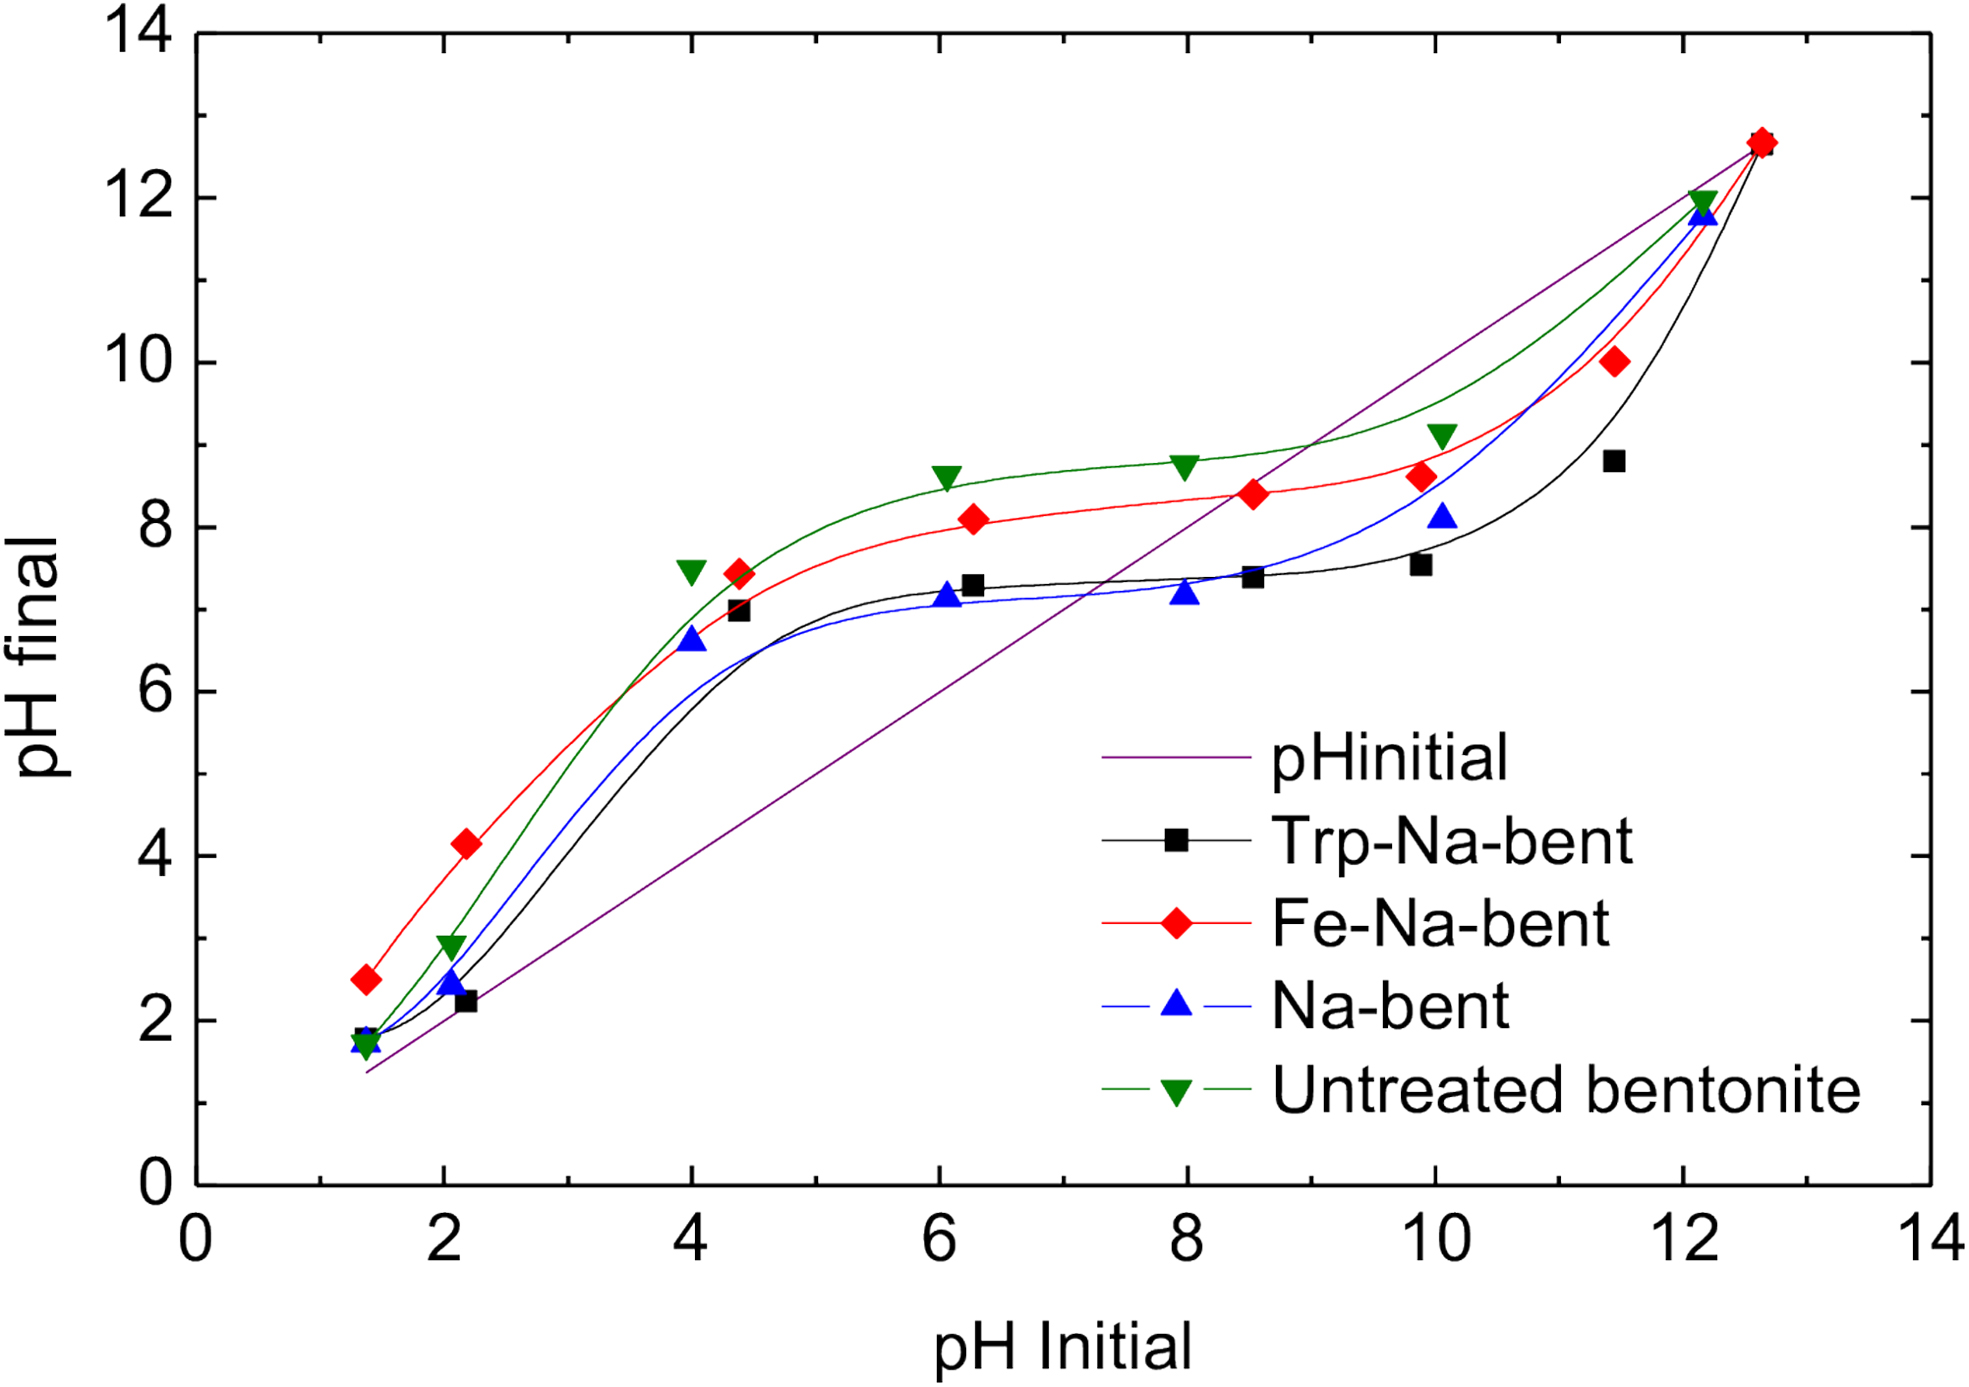
Point of zero charge (pHpzc) of adsorbents.
Optimization of the EE2 adsorption parameters
The effect of contact time was studied using 1 g/L of the untreated and modified bentonite with 10 mg/L for the initial concentration of EE2 at pH 7 and room temperature. The amount of EE2 adsorbed per mass unit of adsorbent at equilibrium qt (mg/g) and the EE2 normalized concentration (Ct/Ci) as a function of adsorption time are represented in Fig. 2a and b, respectively. The curves show that equilibrium was attained after 2 h and that there is a good affinity for the adsorption of EE2 on the Trp-Na-bent adsorbent.
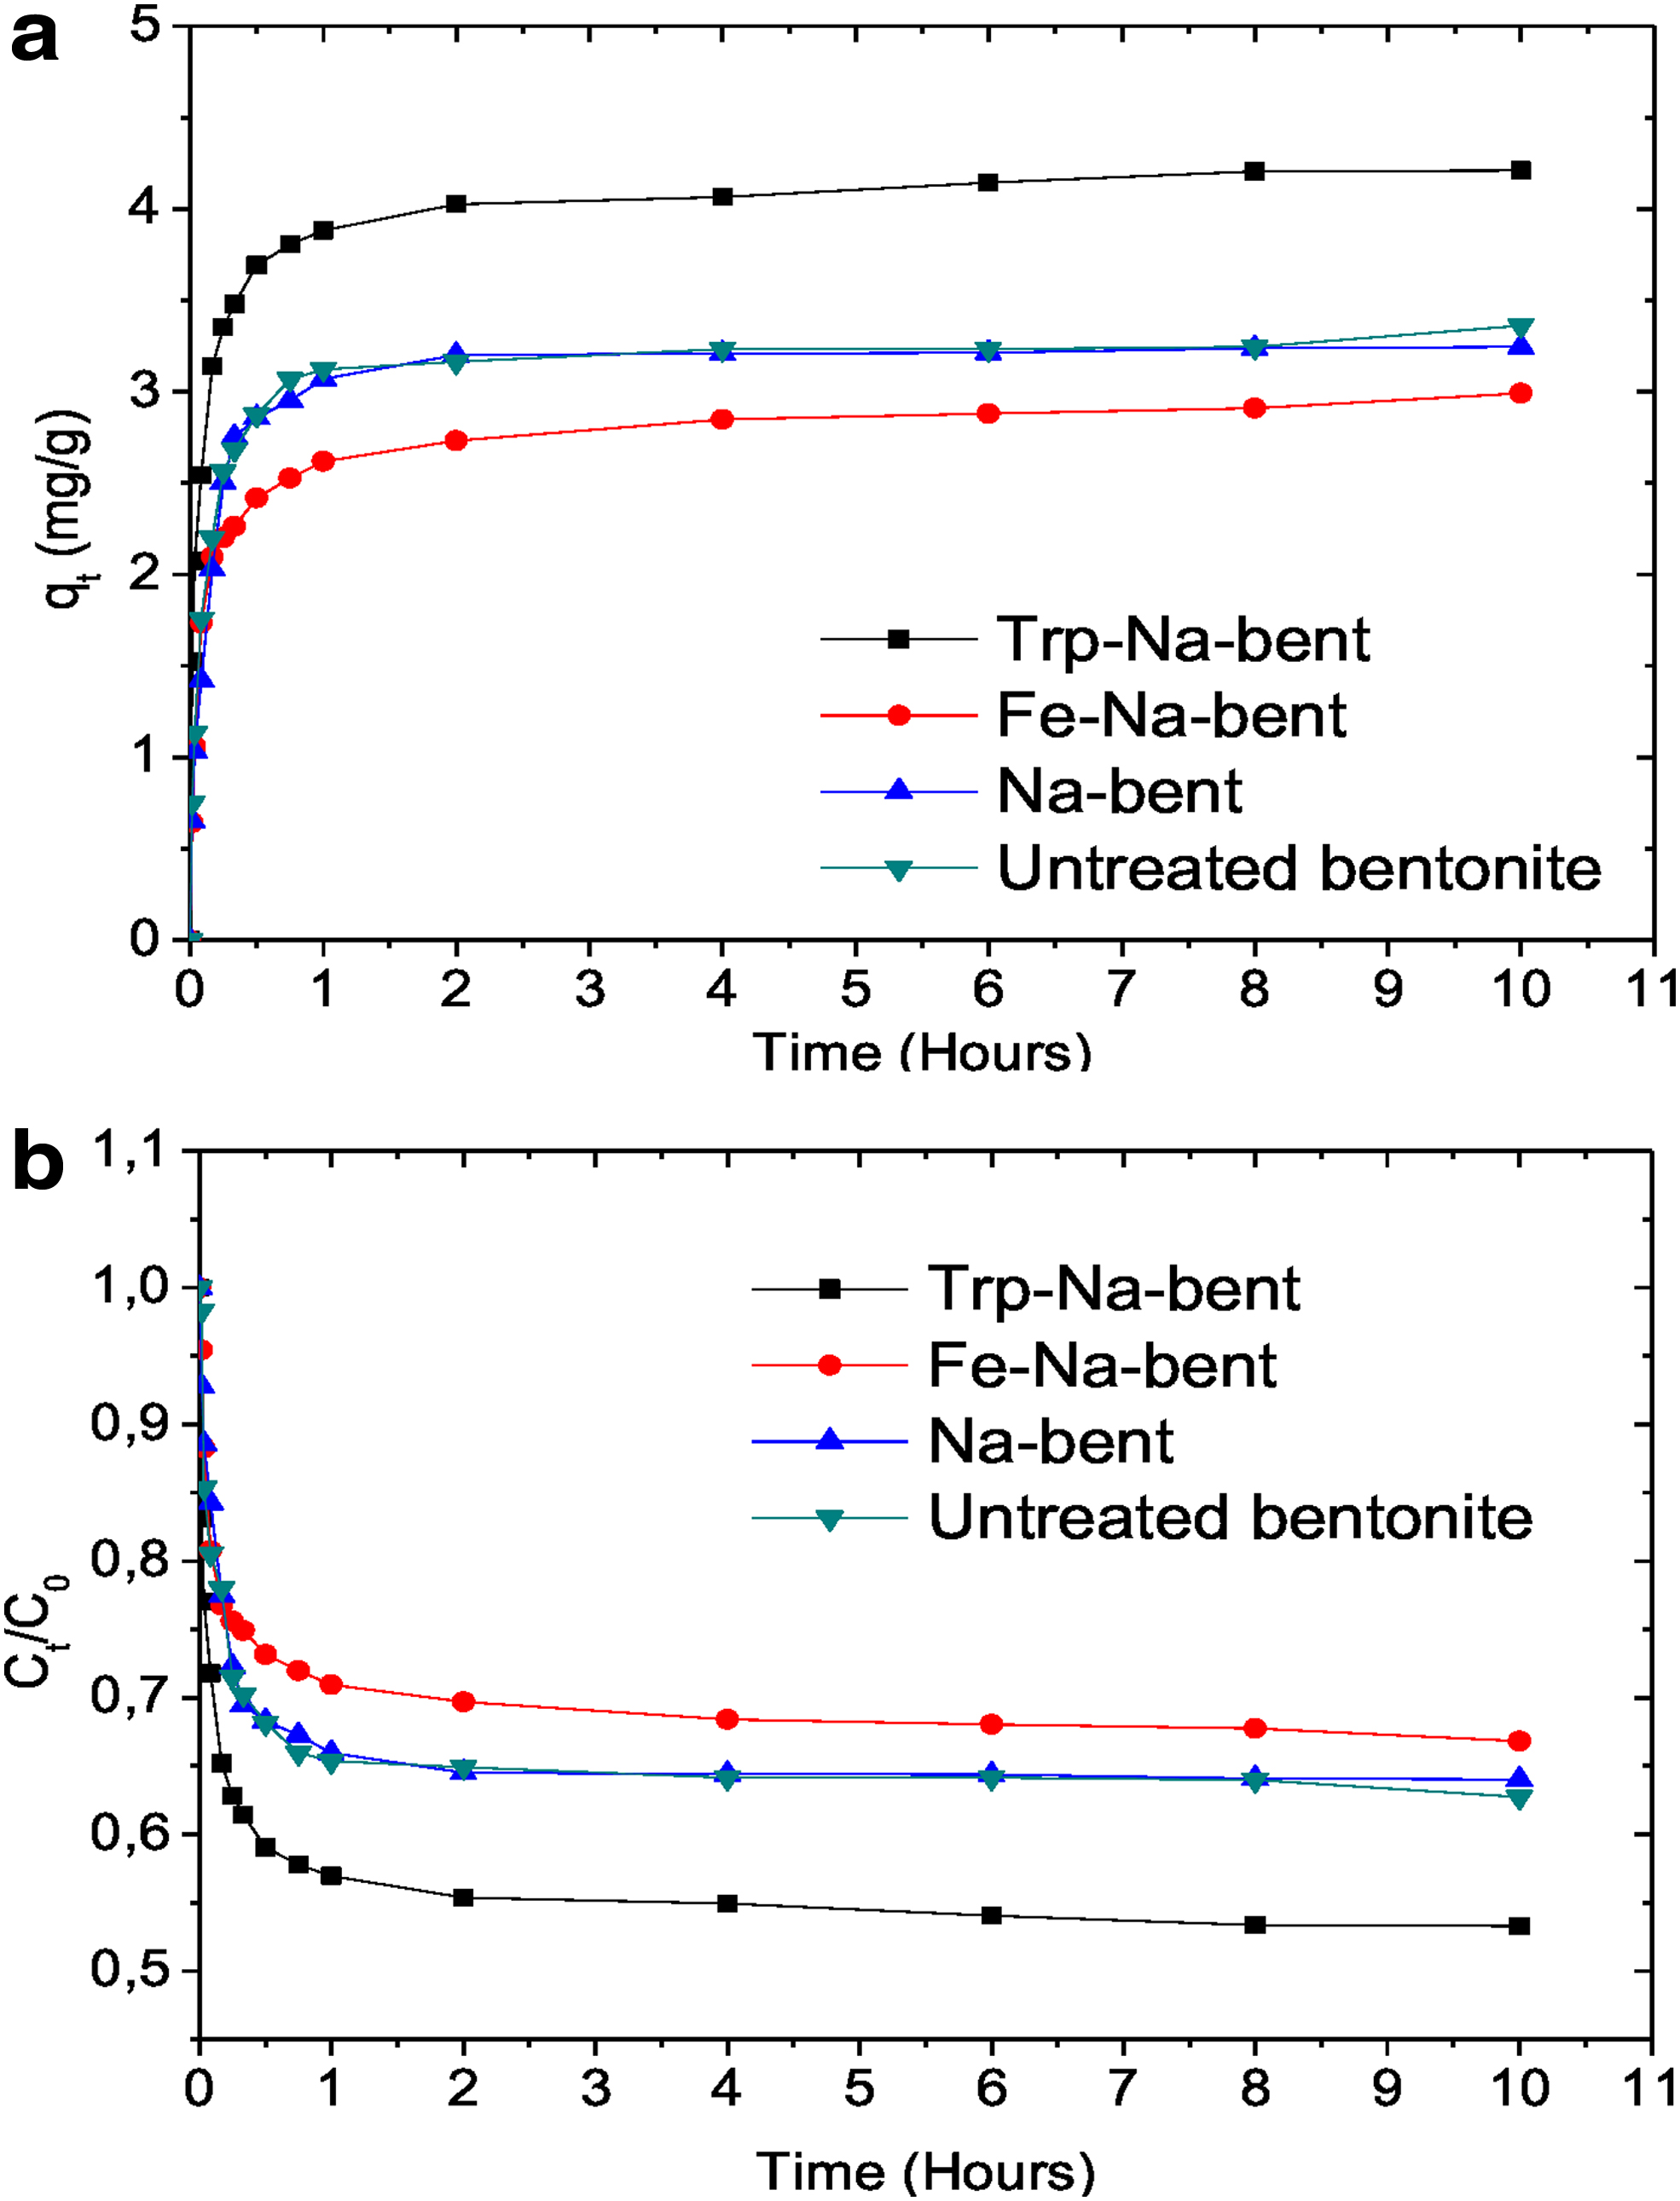
Kinetic curve for EE2 adsorption on untreated bentonite, Na-bent, Trp-Na-bent, and Fe-Na-bent, with Ci EE2 = 10 mg/L, 1 g/L of adsorbent, pH = 7, T = 25°C
The influence of the adsorbent concentration was studied using 0.2, 0.5, 0.8, 1, 1.5, and 2 g/L of untreated and modified bentonite, with the initial concentration of EE2 equal to 10 mg/L. The curves qe (mg/g) versus the mass of adsorbent in Fig. 3 show that Trp-Na-bent has the highest adsorption capacity for the EE2 per unit mass of adsorbent. This Trp-Na-bent behavior, in comparison to the other adsorbents, is probably due to its larger basal spacing value (Kalburcu et al., 2014) and also due to its amphoteric character that could change the adsorption capacity and selectivity depending on of the medium conditions. Moreover, it was found that the adsorption of EE2 per unit mass of adsorbent remains constant for amounts of adsorbent higher than 0.8 mg.

Effect of adsorbent concentration, Ci EE2 = 10 mg/L, pH = 7, T = 25°C.
Also, the effect of the initial concentration of EE2 was studied using 1 g/L of clay, and 5, 10, 15, 20, and 25 mg/L for the initial concentration of EE2. The results are summarized in Fig. 4, where qe versus Ce indicates that the amount of EE2 adsorbed increased for all samples. The adsorption equilibrium of EE2 with untreated bentonite and Na-bent is reached around 4 mg/L of Ce, whereas with Fe-Na-bent, the adsorption per unit mass is better with a high concentration of EE2. Trp-Na-bent adsorption increases with the increase in the concentration of EE2. Under the same conditions, the Trp-Na-bent presents the higher adsorption capacity. Similar studies have been carried out for the adsorption of EE2 on different types of adsorbents, such as inactivated sewage sludge (Feng et al., 2010b) and polyacrylonitrile beads (Mita et al., 2017).

Effect of initial concentration of EE2 with 1 g/L of adsorbent, pH = 7, T = 25°C.
Using inactivated sewage sludge (Feng et al., 2010b), the work was performed with an EE2 initial concentration of 5 mg/L and 1 g/L of the adsorbate. The amount of EE2 per mass unit of adsorbent at equilibrium obtained was q t = 2.56 mg/g and the EE2 concentration was kept almost unchanged after 5 h.
Adsorption isotherms and kinetics
The fitted curves of the Langmuir, Freundlich, and Dual-mode models are shown in Fig. 5 and the parameters of each model are listed in Table 1. The values of the correlation coefficient (R2), higher than 0.98, demonstrate that Langmuir and the Dual-mode model present the best fitting results. However, the maximum adsorption capacity (qmax) calculated from the Dual-mode model is in a higher agreement with the experimental values, probably because the two mechanisms are occurring at the same time. EE2 is being adsorbed in specific sites in the monolayer and, as well, its partitioning is taking place at the same time. Taking into account the work of Gao et al. (2018), they have studied the adsorption of estrogen in spherical mesoporous silica functionalized by n-propyl, and they have found that the isothermal adsorption data are better described by the Langmuir model, and the adsorption is performed by monolayer formation.

Equilibrium isotherms of EE2 adsorption onto
Constants of Isotherm Models for the 17α-Ethinylestradiol Adsorption onto Untreated and Modified Bentonite
Concentration of clay = 1 g/L.
In addition, in a process of adsorption, kinetic studies give information about the control of the process as a function of time and thus allow to calculate the maximum rate of adsorption. The intraparticle mass transfer diffusion is usually expressed in terms of the square root of time (Supplementary Fig. S6). Several phenomena are involved and translated in the shape of these curves; therefore, ki is determined from the plot qt = f(t0.5), only for the last linear period, being the results summarized in Table 2. The kinetics is usually controlled by distinct mechanisms, the diffusion one being the most limiting. The initial curved profile is attributed to the rapid external diffusion or boundary layer diffusion and surface adsorption, while the linear part is related to the intraparticle diffusion (Toor and Jin, 2012). Also, the kinetic models, pseudo-first order and pseudo-second order were applied, as observed in Supplementary Fig. S7, Supplementary Table S1, and Fig. 6, respectively. Figure 6, q t versus time, represents the fitting of the nonlinearization kinetic second order model for the samples Trp-Na-bent, Fe-Na-bent, Na-bent, and untreated bentonite. The results obtained are presented in Table 2. The best coefficient correlation R2 (0.98), indicating a good fit of qt with the contact time, and the agreement between the calculated and experimental values of qt are obtained with the pseudo-second order kinetic model. Furthermore, the rate constants (k2) of the pseudo-second order increase after modification of Na-bent. This increase indicates that the modification promotes the adsorption of EE2 onto Trp-Na-bent and Fe-Na-bent. The best value of the half adsorption time (t1/2) and initial adsorption rate (h) is given by Trp-Na-bent (t1/2 = 2.25 min−1 and h = 1.87 mg/[g·min]), followed by Fe-Na-bent (t1/2 = 3.57 min−1, h = 3.57 mg/[g·min]). From these results, it can be concluded that the pseudo-second order model is suitable to describe the adsorption kinetic process. The limiting step in the present process may be chemisorption between the adsorbent and the adsorbate, based on the pseudo-second order model assumptions (Mita et al., 2017; Gao et al., 2018).
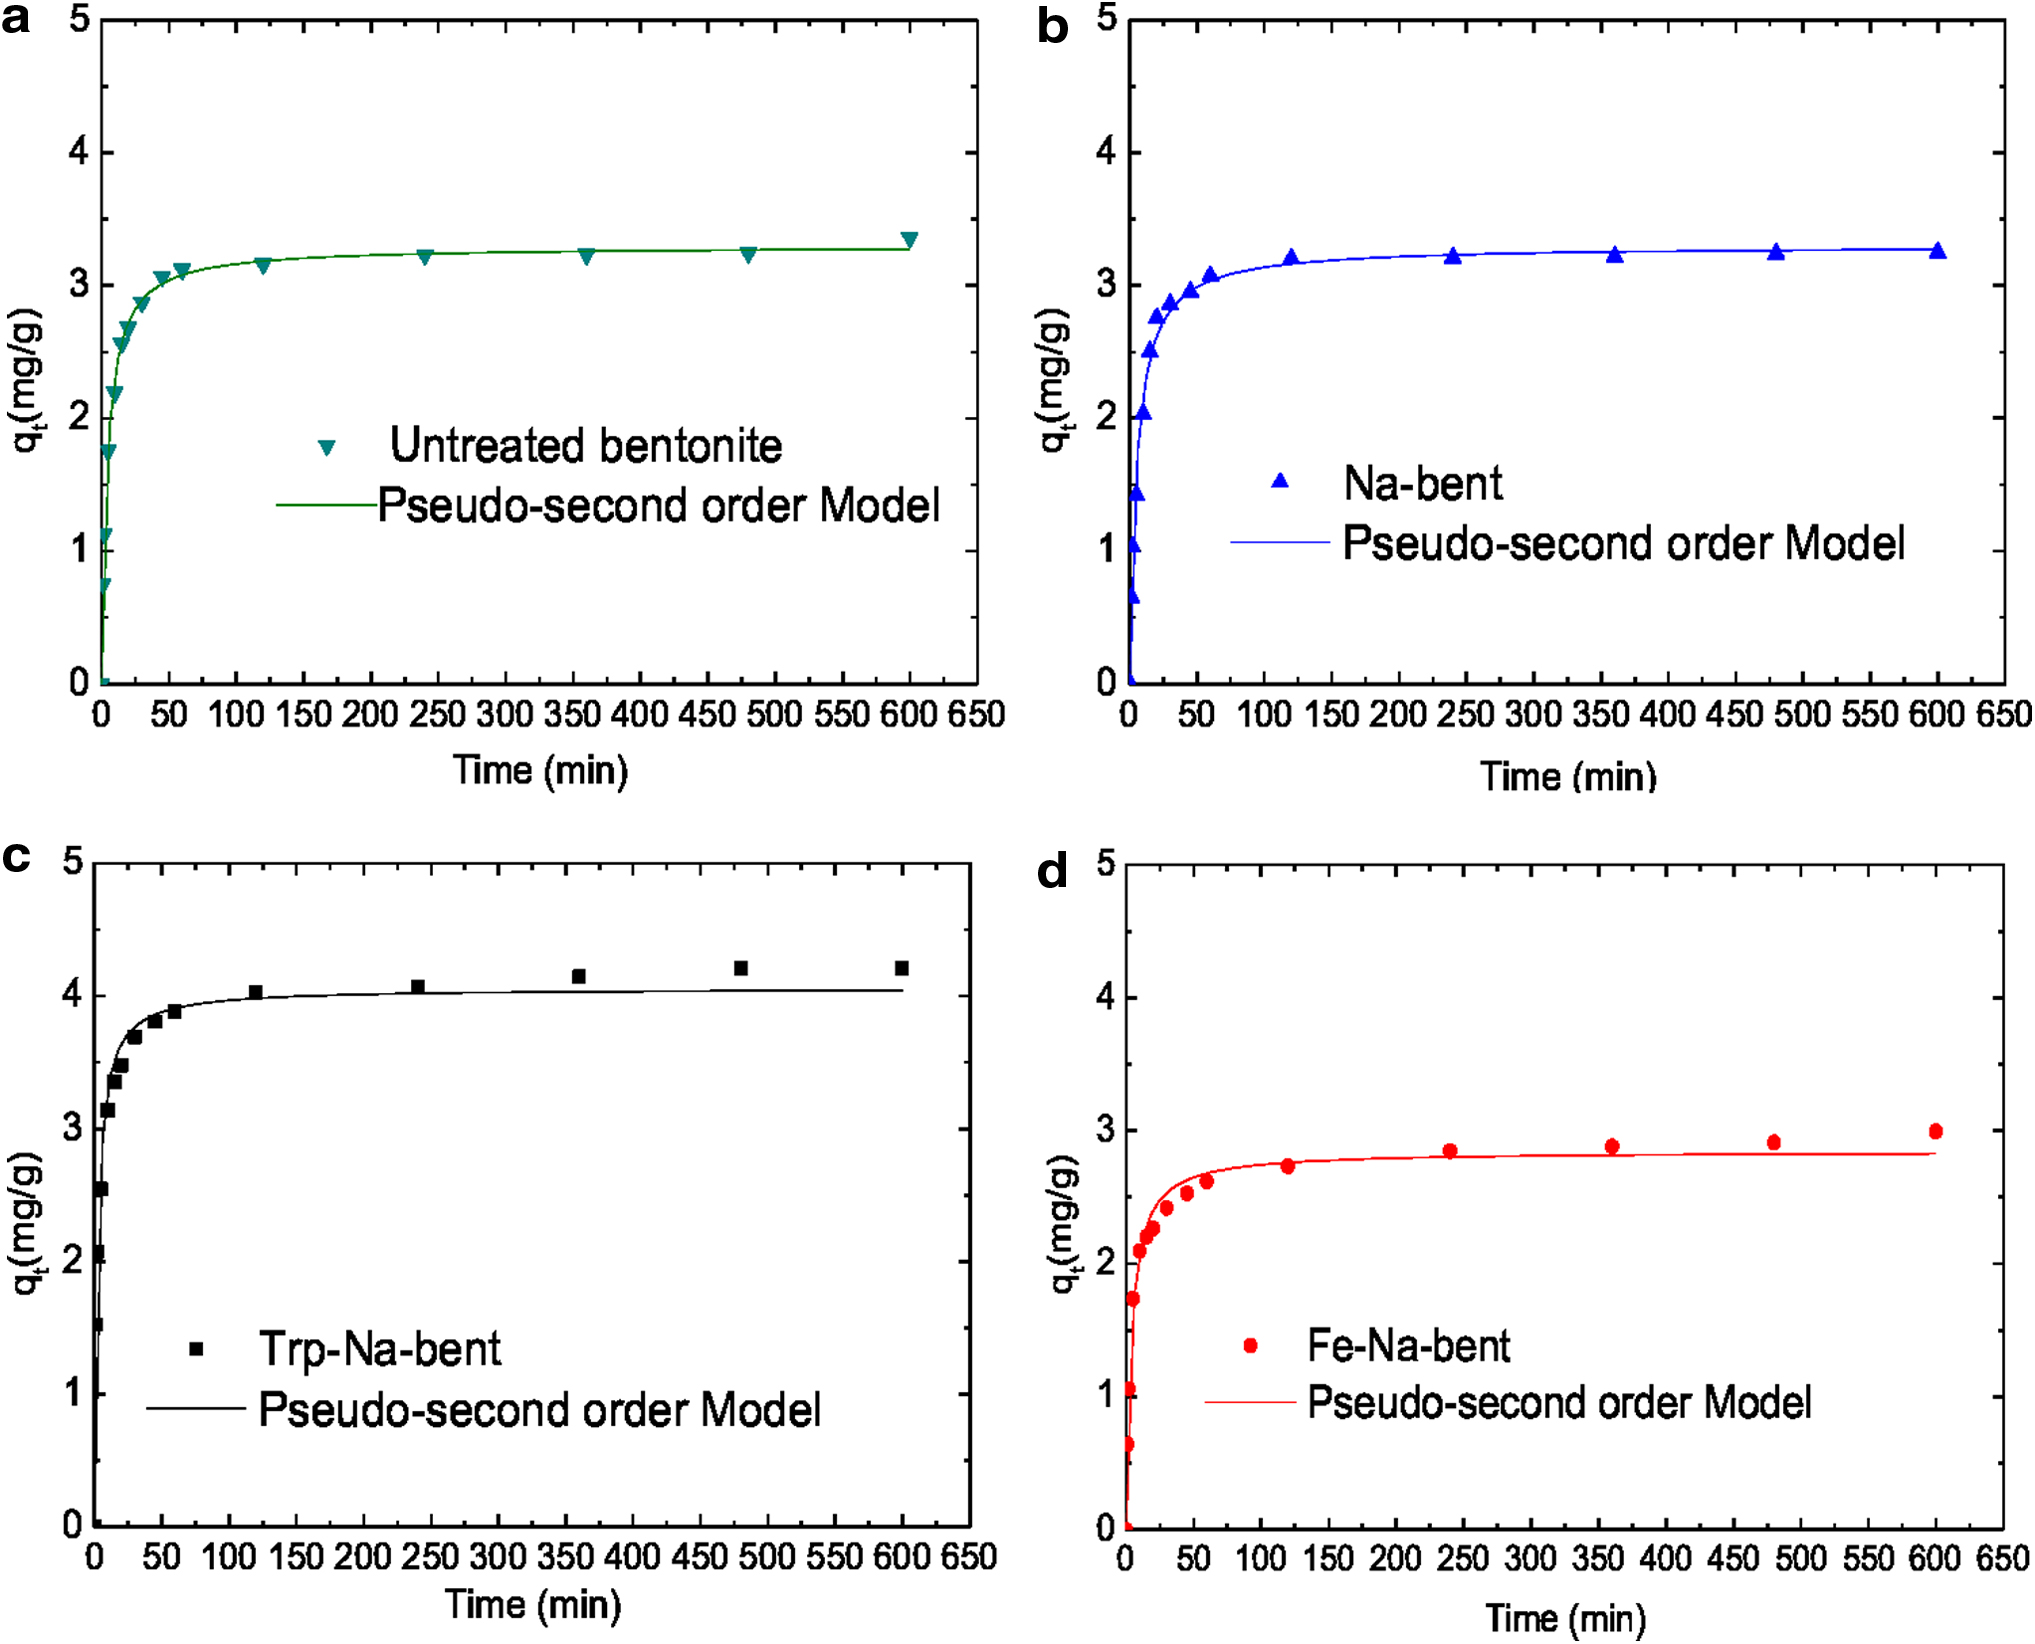
Non linearization of the Kinetic Model of Pseudo-second order for the samples:
Summary of 17α-Ethinylestradiol Adsorption Data Evaluated by Intraparticle Diffusion and Pseudo-Second Order Models
Conclusions
In this study, the purification of untreated bentonite was successfully carried out to obtain an Na-bent sample. This material was then modified to obtain an organic clay (Trp-Na-bent) and an inorganic clay (Fe-Na-bent). These two materials were thoroughly analyzed and compared using different techniques: XRD, FTIR, DSC/TG, and BET specific surface area. The results obtained show that the basal spacing value of Trp-Na-bent increases from 12.86 Å to 15.04 Å, due to the incorporation of L-Trp into the Na-bent interlayer space. The BET specific surface area results show a high value for the Trp-Na-bent than for the Fe-Na-bent complex. The four adsorbents, untreated bentonite, Na-bent, Fe-Na-bent, and Trp-Na-bent, were then tested for the adsorption of the selected target micropollutant, EE2. From the equilibrium and kinetic results obtained, it may be concluded that the Trp-Na-bent complex can be considered a promising low-cost modified adsorbent for the removal of EE2 and, potentially, of other relevant pharmaceutical organic micropollutants from wastewaters' environments. The Supplementary Data discusses adsorption of L-Tryptophan (L-Trp) by untreated bentonite and Na-bent.
Footnotes
Author Disclosure Statement
There are no competing financial interests.
Funding Information
This work was supported by the Associate Laboratory for Green Chemistry (LAQV), which is financed by national funds from Science and Technology Foundation (FCT)/Ministry of Science, Technology and Higher Education (MCTES) (UID/QUI/50006/2019). H.G. gratefully acknowledges the Erasmus+ International Credit Mobility Program for her internship grant at LAQV, Department of Chemistry, Faculty of Science and Technology, University NOVA of Lisbon, Portugal.
References
Supplementary Material
Please find the following supplemental material available below.
For Open Access articles published under a Creative Commons License, all supplemental material carries the same license as the article it is associated with.
For non-Open Access articles published, all supplemental material carries a non-exclusive license, and permission requests for re-use of supplemental material or any part of supplemental material shall be sent directly to the copyright owner as specified in the copyright notice associated with the article.