
Abstract
Graphite felt (GF) was modified by the hydrothermal treatment with aqueous ammonia to improve the efficiency of electro-Fenton (EF) process. The surface morphology, structure, and electrochemical properties of the GFs before and after modification were characterized by scanning electron microscopy, Brunauer-Emmett-Teller surface area, Raman spectrum, X-ray photoelectron spectroscopy, and cyclic voltammetry accordingly. The relationship between the GF structure and the EF performance was discussed. Nitrogen atoms were found doped into the carbon framework mainly in the form of pyrrolic N and leading to more defects on the edge plane, which in turn enhanced the oxygen reduction reaction activity of GF. The GF hydrothermally treated at 180°C for 8 h showed the highest H2O2 accumulation rate (14.25 mg/[L·cm2·h]), which is about 13.4 times higher than that of raw GF (1.06 mg/[L·cm2·h]). Simulated salty organic wastewater with typical organic pollutants, including phenol, p-nitrophenol, tetracycline hydrochloride, and Rhodamine B, have been tested in an EF system using the modified GF as cathode. Almost 100% degradation of these pollutants with an initial concentration of 100 mg/L has been achieved within 2 h.
Introduction
It is a great challenge to effectively and economically remove the high-concentration organic pollutants from highly salty wastewater due to its biological toxicity (Uygur, 2006). Currently, most of the highly salty organic wastewater has been diluted with huge amount of salt-free wastewater or even tap water before sending to the traditional biochemical wastewater treatment process (Ma, 2006). However, such dilution not only leads to huge increase in the wastewater flow rate but also increases the difficulty and cost to remove the inorganic salts. Thus, direct removal of organic species in the salty wastewater is most desirable.
Advanced oxidation processes (AOPs) such as supercritical water oxidation (Xu et al., 2013), catalytic wet air oxidation (Lei et al., 2000), Fenton process (Pignatello et al., 2006), electrochemical oxidation (Zhang et al., 2014), and electro-Fenton (EF) process (Scialdone et al., 2013) have been extensively studied in wastewater treatment, in most of the cases, as the last resort to remove the trace amount of refractory pollutants (Oller et al., 2011).
However, AOPs such as supercritical water oxidation and wet catalytic oxidation are carried out under high temperature and high-pressure conditions, which require high-grade construction materials to avoid severe corrosion and lead to huge capital investment. Fenton process can be carried out under ambient conditions, but it is not feasible for high chemical oxygen demand wastewater treatment due to the high cost on the large demand of H2O2. EF process is more economically promising in treatment of the salty organic wastewater since it can utilize either air or oxygen-rich air to generate H2O2 in situ, thus avoid the storage and transportation of H2O2 (Pliego et al., 2015).
Cathode is the most critical factor, which affects the H2O2 generation and EF efficiency. Oxygen diffused to the cathode is converted to H2O2 via two-electron oxygen reduction reaction (ORR), Eq. (1) (Martinez-Huitle and Rodrigo 2015).
Then H2O2 is catalytically decomposed to the very active radical oxidant, ·OH, according to Eq. (2) in the presence of Fe2+ (Walling, 1975). The Fenton catalyst, Fe2+, can be introduced either by the oxidation of iron anode or from the external ferrous salt.
As the second strongest oxidant, ·OH can efficiently oxidize various refractory organic pollutants indiscriminately (Kurniawan et al., 2006). The amount of Fe2+ required by EF process is much less than that in a traditional Fenton process since Fe2+ can be regenerated at the cathode via Eq. (3) (Oturan et al., 2000). Thus, it minimizes the generation of iron sludge.
The pollutant degradation efficiency can be improved by increasing the H2O2 generation rate and inhibiting the hydrogen evolution on cathode. Carbon materials, such as graphite (Qiu et al., 2018), carbon nanotubes (Zarei et al., 2009, 2010), mesoporous carbon (Hu et al., 2013), graphite felt (GF) (Zhou et al., 2014), and activated carbon fiber (Wang et al., 2010; Ren et al., 2015) have been widely studied in EF system due to their excellent conductivity, chemical stability, and high hydrogen evolution potential. Among these carbon-based electrodes, the gas diffusion electrodes (GDEs) exhibit the highest H2O2 generation rate due to minimizing the effect of oxygen transfer near the cathode. However, the GDEs are still too complicate, instable, and expensive, which limit its application on large scale (Agladze et al., 2007).
GF is a cheap commercial electrode material with excellent mechanical property and conductivity. However, the ORR activity of GF is poor. Thus, many efforts such as KOH activation (Wang et al., 2015), electrochemical oxidation (Wang et al., 2019), and thermal treatment (Le et al., 2016) have been attempted to improve its ORR performance.
Both the structure and composition are crucial for the ORR performance of carbon electrode (Alexeyeva et al., 2010; Fellinger et al., 2012; Hasché et al., 2016; Li et al., 2019). The electron transfer rate of carbon materials largely depends on the edge plane defects (Bowling et al., 1989). Doping of heteroatoms such as nitrogen can activate π electrons and induce charge redistribution on the carbon framework, which favors the adsorption of ·OOH intermediate and promotes H2O2 generation (Jiang et al., 2018). Generally, N was introduced by thermochemical treatment using NH3/O2 (Flox et al., 2013) or by chemical modification using hydrazine hydrate and ethanol (Liu et al., 2017), but these methods involve either dangerous reaction conditions or hazardous chemicals.
Hydrothermal modification of GF using aqueous ammonia solution has been found facilitating the electron transfer from the GF electrode to the electrolyte solution (Wu et al., 2011). N-doping via hydrothermal treatment in ammonia solution can also improve the ORR activity, particularly with a four-electron reaction pathway, in a fuel cell (Zhou et al., 2018). However, a two-electron oxygen reduction pathway is more desirable in an EF process. How to tune the electrochemical properties and the two-electron ORR pathway selectivity of N-doping graphite felt (GFN) is not clear yet.
This work aims to promote both the ORR activity and two-electron reduction selectivity of GF electrode by hydrothermal treatment with aqueous ammonia. Scanning electron microscopy (SEM), X-ray photoelectron spectroscopy (XPS), Raman spectrometer, and cyclic voltammetry (CV) were used to characterize the surface morphology, structure, and electrochemical properties of the GFs. The hydrothermal modification conditions were optimized to achieve high H2O2 generation rate. The performance of modified GF in electron-Fenton process was evaluated by the degradation of typical refractory organic pollutants, including phenol, p-nitrophenol (p-Np), tetracycline hydrochloride (TC-HCl), and Rhodamine B (RhB). The relationship between the GF structure and the EF performance was discussed.
Experimental Section
Modification of GF
All chemicals were analytical grade and used without further purification. First, commercial GF (Shenhe Carbon Fiber Materials Co. Ltd., Liaoning, China) was degreased by ultrasonic bath with acetone and ultrapure deionized water in sequence, then dried at room temperature. The pretreated GFs with a size of 20 × 20 × 5 mm (labeled as GF) were hydrothermally treated with 15 mL 25% aqueous ammonia solution in a Teflon-lined 50 mL autoclave at a given temperature and time with an average oven ramping rate of 5°C/min. The GF samples removed from the autoclave were totally washed with ultrapure water for several times until the pH of the rinsed water was neutral, and then dried in vacuum oven at 60°C for 6 h. The resultant GFN was labeled as GFN-T-t where T and t represents the treating temperature and time, respectively.
Material characterization
The surface morphology was characterized by SEM (Regulus, SU8230). The surface area was determined by N2 adsorption-desorption isotherms using Micromeritrics ASAP 2460. The elemental composition of the sample surface was determined by XPS (Thermo Escalab 250 Xi). The Raman spectra were recorded by a laser Raman spectrometer (Thermal Fisher DXR) to understand the carbon structure change.
Electrochemical measurements were carried out with a CHI660D electrochemical workstation (CH Instruments, Chenhua, Shanghai, China). CV measurements were performed on a three-electrode cell system, including a working electrode (GF and GFN), a counter electrode (platinum grid), and a reference electrode (saturated calomel electrode; SCE). CV experiments conducted in a solution of 10 mM K3[Fe(CN)6] and 1.0 M KCl were adopted to calculate the electroactive surface area according to the Randles-Sevcik formula, Eq. (4) (Trasatti and Petrii 1991; Mousset et al., 2016).
Where Ip is the peak current (A), A is the electroactive surface area of the electrode (cm2), D is the diffusion coefficient of the probe molecule (7.60 × 10⁻⁶ cm2/s), n is the number of electrons participating in the redox reaction (1), γ is the scan rate of the potential perturbation (V/s), and C is the concentration of the probe molecule in the bulk solution (mol/cm3).
The ORR potentials under specific conditions were identified by CV using 50 mM aqueous Na2SO4 solution (pH = 3), which was saturated by bubbling pure oxygen (96% purity) for 10 min right before the test. The potentials applied in this work were referred to the SCE except otherwise specified.
Electro-generation of H2O2
All electrochemical experiments were carried out in an 80 mL undivided cell. GFN was tested as cathode, while a platinum grid and a SCE were the anode and reference electrode, respectively. During the H2O2 accumulation experiments, 50 mM aqueous Na2SO4 solution (pH = 3) was used as the electrolyte, and oxygen was bubbled into the electrolyte at the vicinity of the cathode at a constant flow rate of 400 mL/min.
The H2O2 concentrations were monitored by UV-vis spectrophotometer (UV-1500PC; Macy China Instruments, Inc.) using the potassium-titanium oxalate method (Sellers, 1980). Each reaction result reported in this work is the average from triplicate runs with a relative standard deviation within 5%. The current efficiency (CE) of H2O2 electro-generation was calculated according to Eq. (5) (Zhou et al., 2014).
Where n is the number of electrons transferred in O2 reduction to H2O2 (n = 2), F is the Faraday constant (96486 C/mol), C is the concentration of H2O2 (mol/L), V is the volume of electrolyte (L), i is the current (A), and t is the time (s).
EF system test
The EF process was carried out in the same apparatus mentioned in electro-generation of H2O2 section. Phenol, p-Np, TC-HCl, and RhB with an initial concentration of 100 mg/L were tested as model contaminants, respectively. Fifty millimolar aqueous Na2SO4 solution was taken as the typical salt composition in a salty organic wastewater. A given amount of Fe2+ was introduced into above aqueous solution as catalyst. The pH of solution was initially adjusted by diluted H2SO4 to a given value, and it was not manipulated intentionally during the reaction.
The concentrations of phenol and p-Np were determined by a high-performance liquid chromatograph (HPLC; Lab Alliance Model 201) with a Kromasil C18 column (Φ 4.6 × 250 mm, 5 μm) using a UV detector at a wavelength of 270 nm. The mobile phase was composed of methanol and 0.2% aqueous acetic acid with a volume ratio of 50/50. The flow rate is 1.0 mL/min at 35°C. The concentration of TC-HCl was monitored by the same HPLC with a different mobile phase, which was composed of 50% (volume ratio) acetonitrile in methanol at a flow rate of 0.3 mL/min and 0.01 M aqueous oxalic acid solution at a flow rate of 0.7 mL/min. Ten microliter of the reaction mixture was sampled each time and analyzed immediately by HPLC. The concentration of RhB was analyzed by a UV-vis spectrophotometer at an absorption wavelength of 553 nm. Two milliliter reaction mixture was sampled each time and analyzed immediately by the UV-vis spectrophotometer. The detection and quantification limits are 0.2/0.8 mg/L (phenol), 0.15/0.6 mg/L (p-Np), 0.1/0.4 mg/L (TC-HCl), and 0.1/0.4 mg/L (RhB), respectively.
Results and Discussion
Effect of hydrothermal treatment with aqueous ammonia
Physical properties
The surface morphologies of GF and GFN were examined with SEM (Fig. 1). The surface of GFN was found slightly smoother after the hydrothermal treating with aqueous ammonia. No groove, pore, or nanoparticle structure was observed on the surface of the GFs, which means that no significant corrosion to the GF substrate was introduced by the treatment. The original GF is hydrophobic with a water contact angle of 136°. The hydrothermal treating only slightly increased the contact angle to about 140°. The Brunauer-Emmett-Teller analysis (Table 1) shows that there is no significant change in specific surface area and pore volume after hydrothermal treatment. The morphology of both GF and GFN samples is almost identical.

SEM images of GF
Brunauer-Emmett-Teller Surface Area, Pore Volume, and Electroactive Surface Area of GF and GFN-180-8
BET, Brunauer-Emmett-Teller; GF, graphite felt; GFN, N-doped graphite felt.
Electroactive surface area
The electroactive surface area of the GF samples was determined by CV experiments conducted in a solution of 10 mM K3[Fe(CN)6] and 1.0 M KCl at a scan rate of 10 mV/s. The scanning potential ranged from −0.3 to 0.8 V. The results are shown in Fig. 2. Figure 2 shows that the GFN-180-8 had a much higher peak current than GF. The electroactive surface area of GFN-180-8 is 0.0203 m2/g, which is about two times higher than that of GF (Table 1). This indicates that the doping of N should be responsible for the increase of the electroactive surface area since the morphology and specific surface area of the GFs were not altered by the hydrothermal treatment (Wang et al., 2014).

Cyclic voltammograms of GF and GFN-180-8 in solution of 10 mM K3[Fe(CN)6] and 1.0 M KCl at a scan rate of 10 mV/s.
Bonding structure of carbon and nitrogen on the modified GF
Raman spectrum analysis was adopted to characterize the carbon structure of the GF (Fig. 3). Two distinct peaks at around 1310 and 1600 cm−1, respectively, were observed. 1310 cm−1 is ascribed to the D bond, which is associated with the structure defects on the edge plane, and 1600 cm−1 is ascribed to the G bond, which is related to graphitic carbon (Liu et al., 2015). Figure 3 shows that the doping of nitrogen led to an increase in the intensity ratio of D bond to G bond (iD:iG). This ratio increased with both the increasing hydrothermal time and temperature. Such increase of D bond to G bond ratio suggests that more defects were introduced, which is likely due to the doping of nitrogen atoms into the carbon framework (Sun et al., 2013; Perazzolo et al., 2015). The edge plane defects of the carbon electrode would lead to faster electron transfer rate in turn higher electrode activity (Bowling et al., 1989).
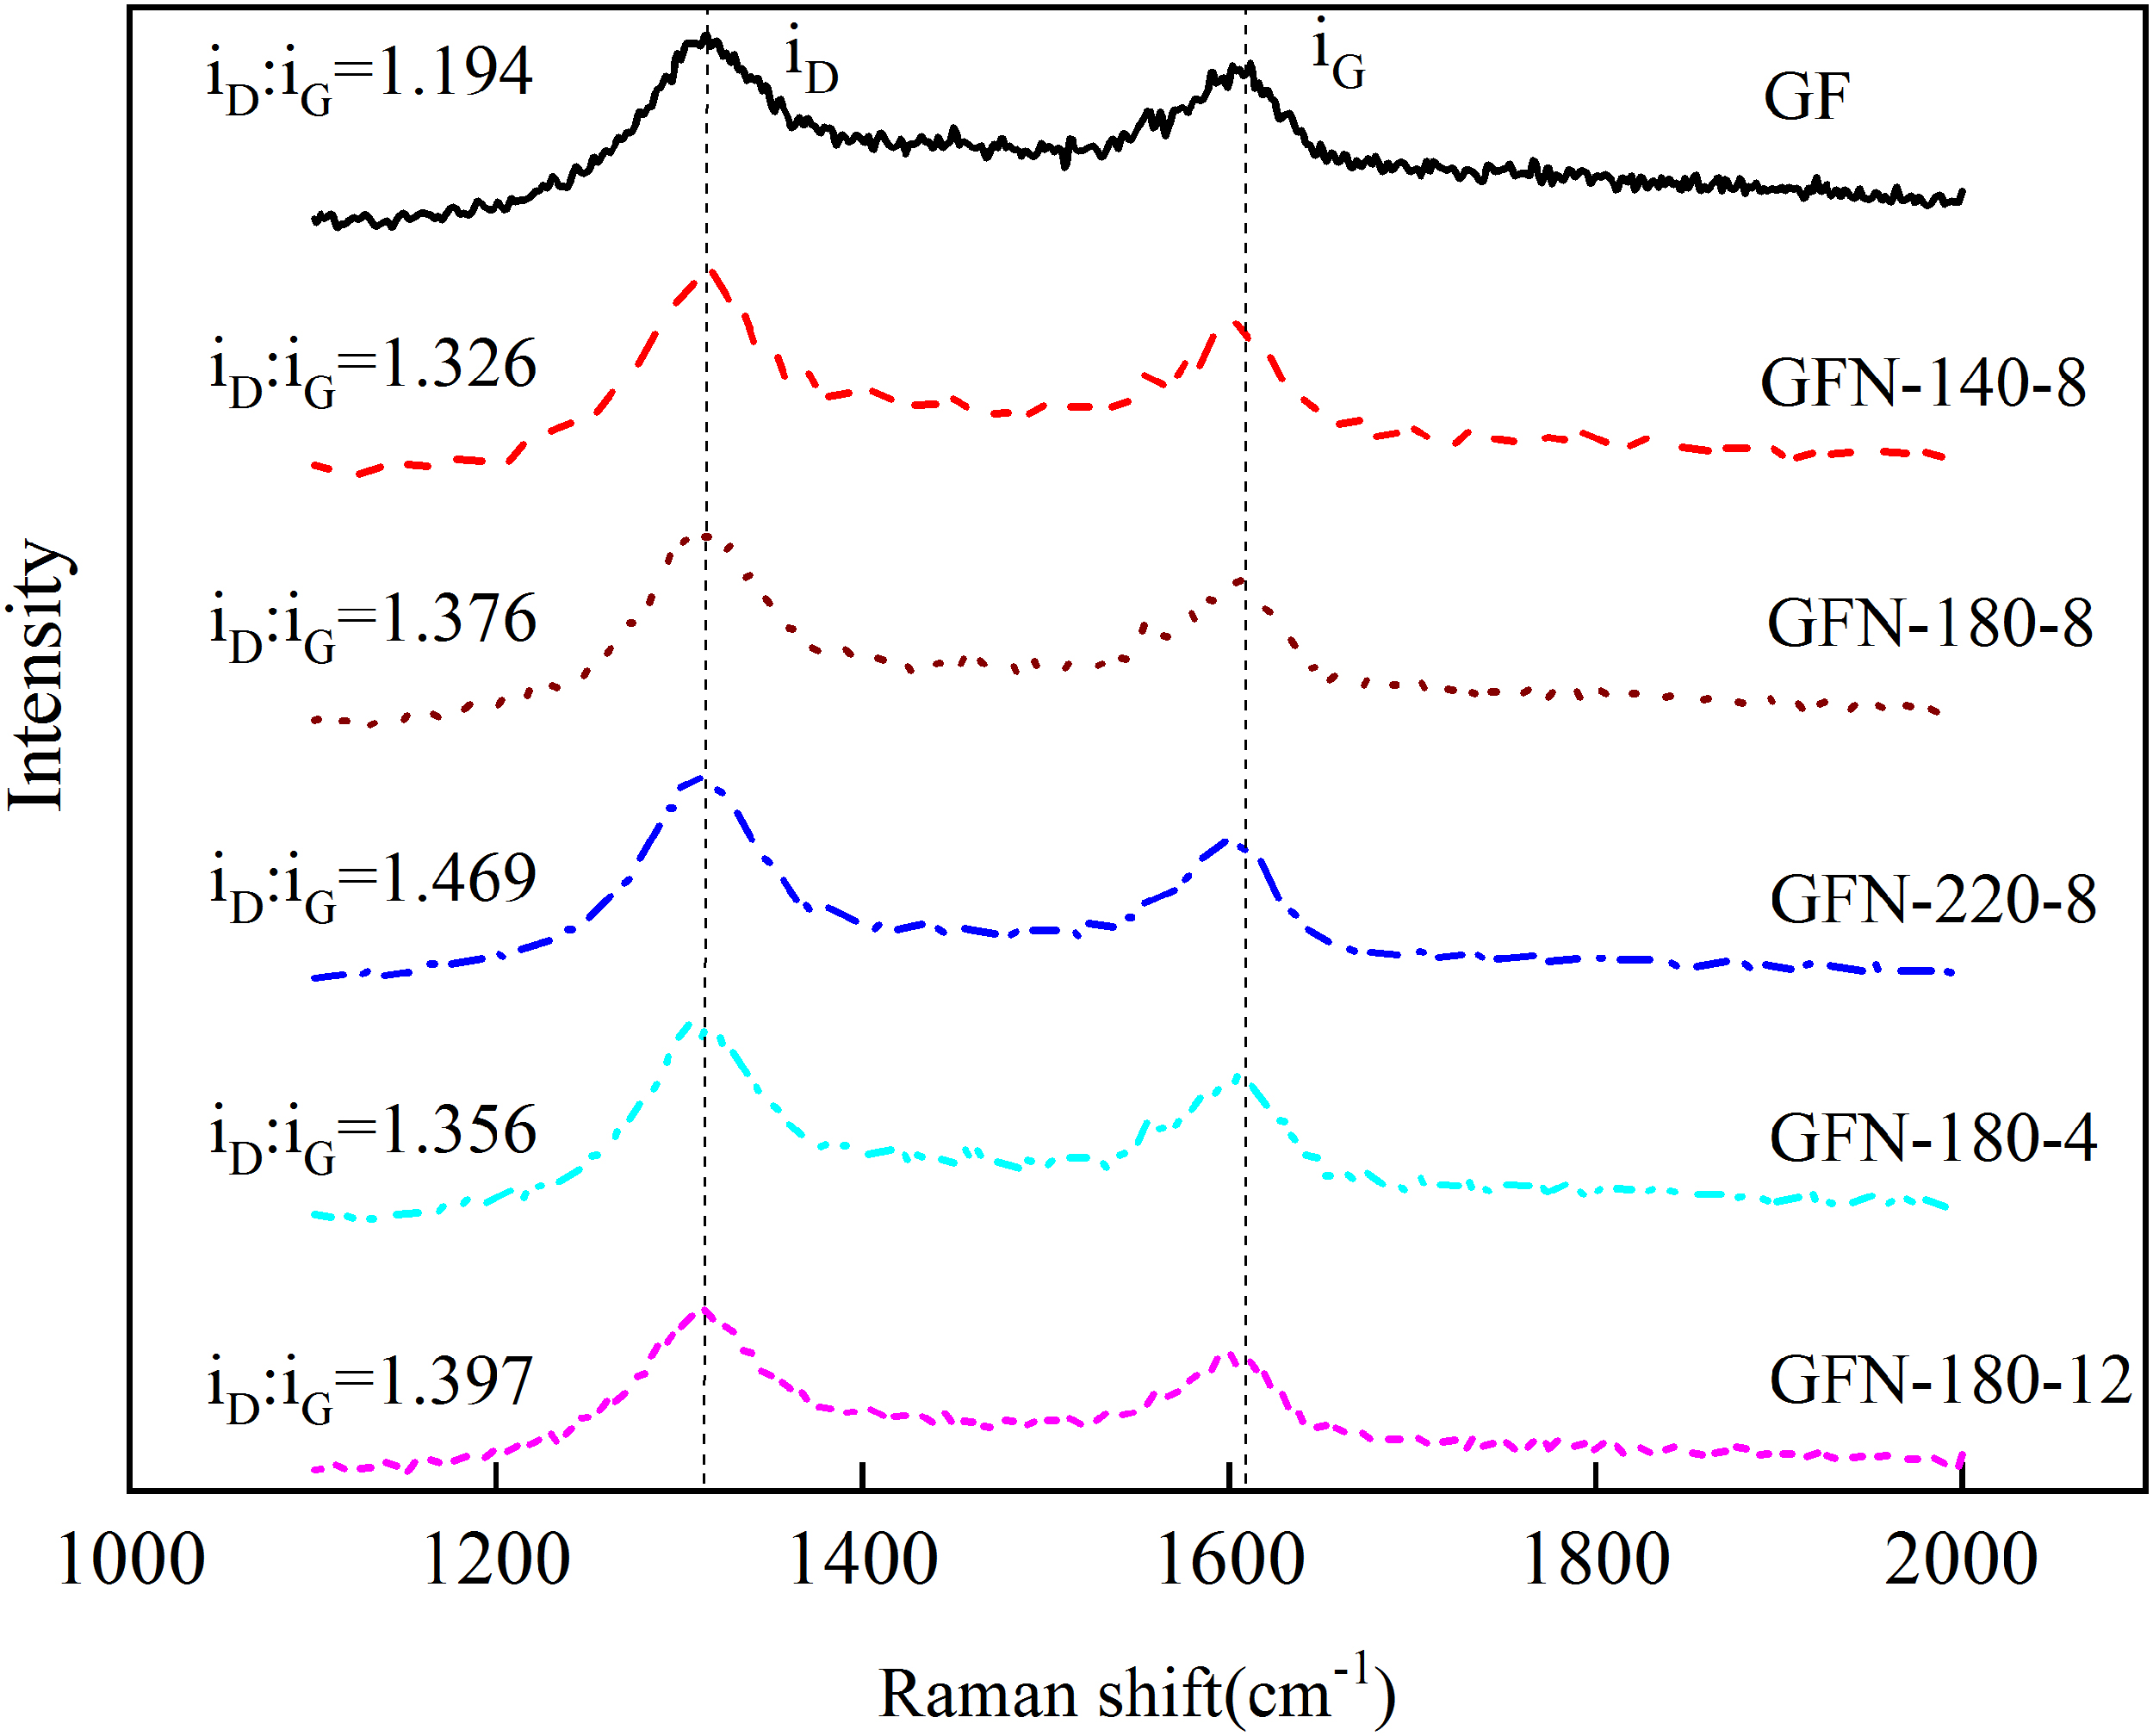
The Raman spectra of GF and GFN.
Nitrogen, oxygen, and carbon on the surface of both GF and GFN-180-8 samples were identified by XPS (Fig. 4). Three distinct carbon species were identified by the peaks at 284.8, 285.9, and 289.8 eV which are associated with the C-C or C = C, C-O, and O = C-O, respectively (Fig. 4a, b) (Zhou et al., 2014). The presence of C-N bond at 287.2 eV confirms the doping of N into the carbon framework (Fig. 4b). The spectra of O1s with the peaks at 531.0, 532.5 and 533.9 eV further confirm the presence of C-O, -OH, and O = C-O, respectively (Wang et al., 2015; Zhu et al., 2019).
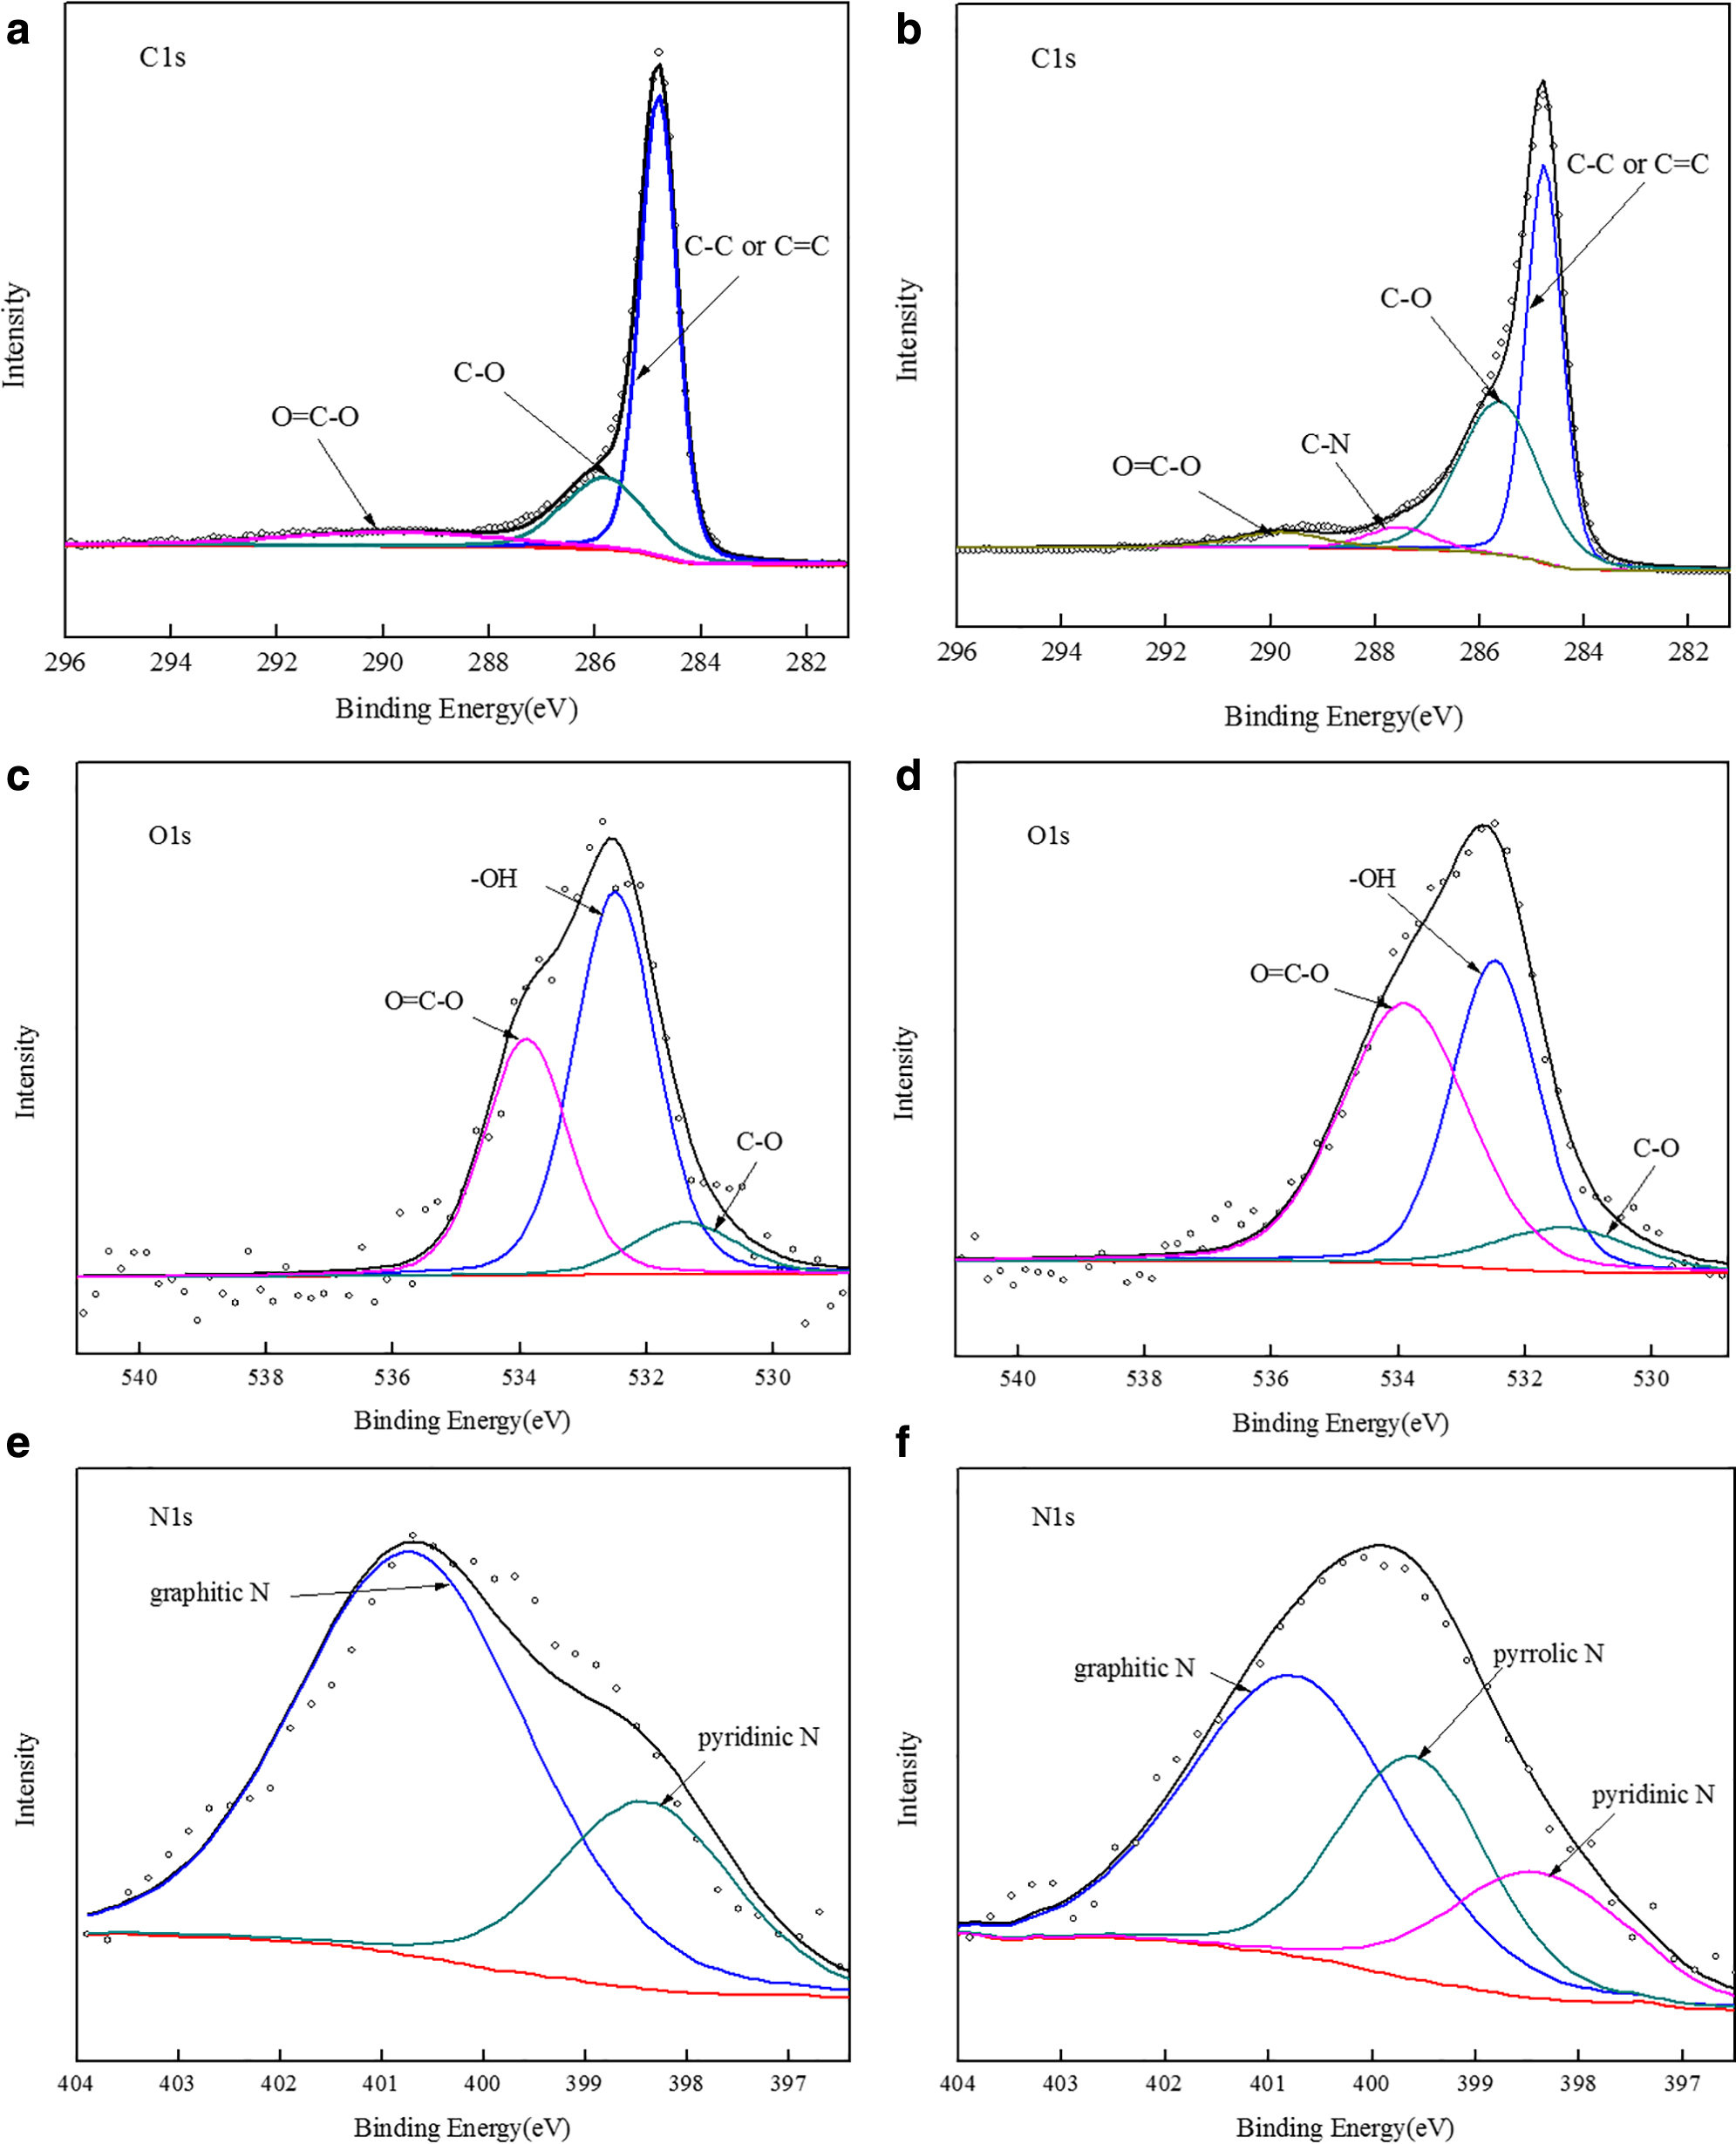
XPS C1s, O1s and N1s spectra of GF
The N1s spectrum of GF showed two separated peaks at 400.7 and 398.4 eV, which are associated with the graphitic N and pyridinic N (Fig. 4e, f), respectively (Liu et al., 2011; Favaro et al., 2013). A peak at 399.6 eV was observed after hydrothermal treating with aqueous ammonia, which corresponds to the pyrrolic nitrogen (Fig. 4f) (Sheng et al., 2011). The nitrogen content of the original GF is about 1.22%. About 74.1% of them are graphitic nitrogen and about 25.9% of them are pyridinic one (Table 2). However, the nitrogen content was increased to about 3.27% after hydrothermal treating with aqueous ammonia (Table 2). Pyrrolic nitrogen was observed in the hydrothermal treated sample (GFN-180-8), which accounts for about 28.9% of the nitrogen in the sample. The ratios of the graphitic nitrogen and pyridinic nitrogen were reduced to 51.5% and 19.6% accordingly.
The Element Composition and the Contents of Nitrogen Species on the Surface of GF and GFN-180-8
Oxygen reduction activity of the GF
CV test was adopted to evaluate the oxygen reduction activity of the GFs (Fig. 5). No obvious oxygen reduction peak was observed on original GF. However, two distinct reduction peaks at around −0.2 to −0.7 V were found for those hydrothermally treated GFs, which are corresponding to the two-electron and four-electron reduction of oxygen, respectively (Zhou et al., 2014). This indicates that the hydrothermal treatment with aqueous ammonia has greatly improved the oxygen reduction activity of GF.
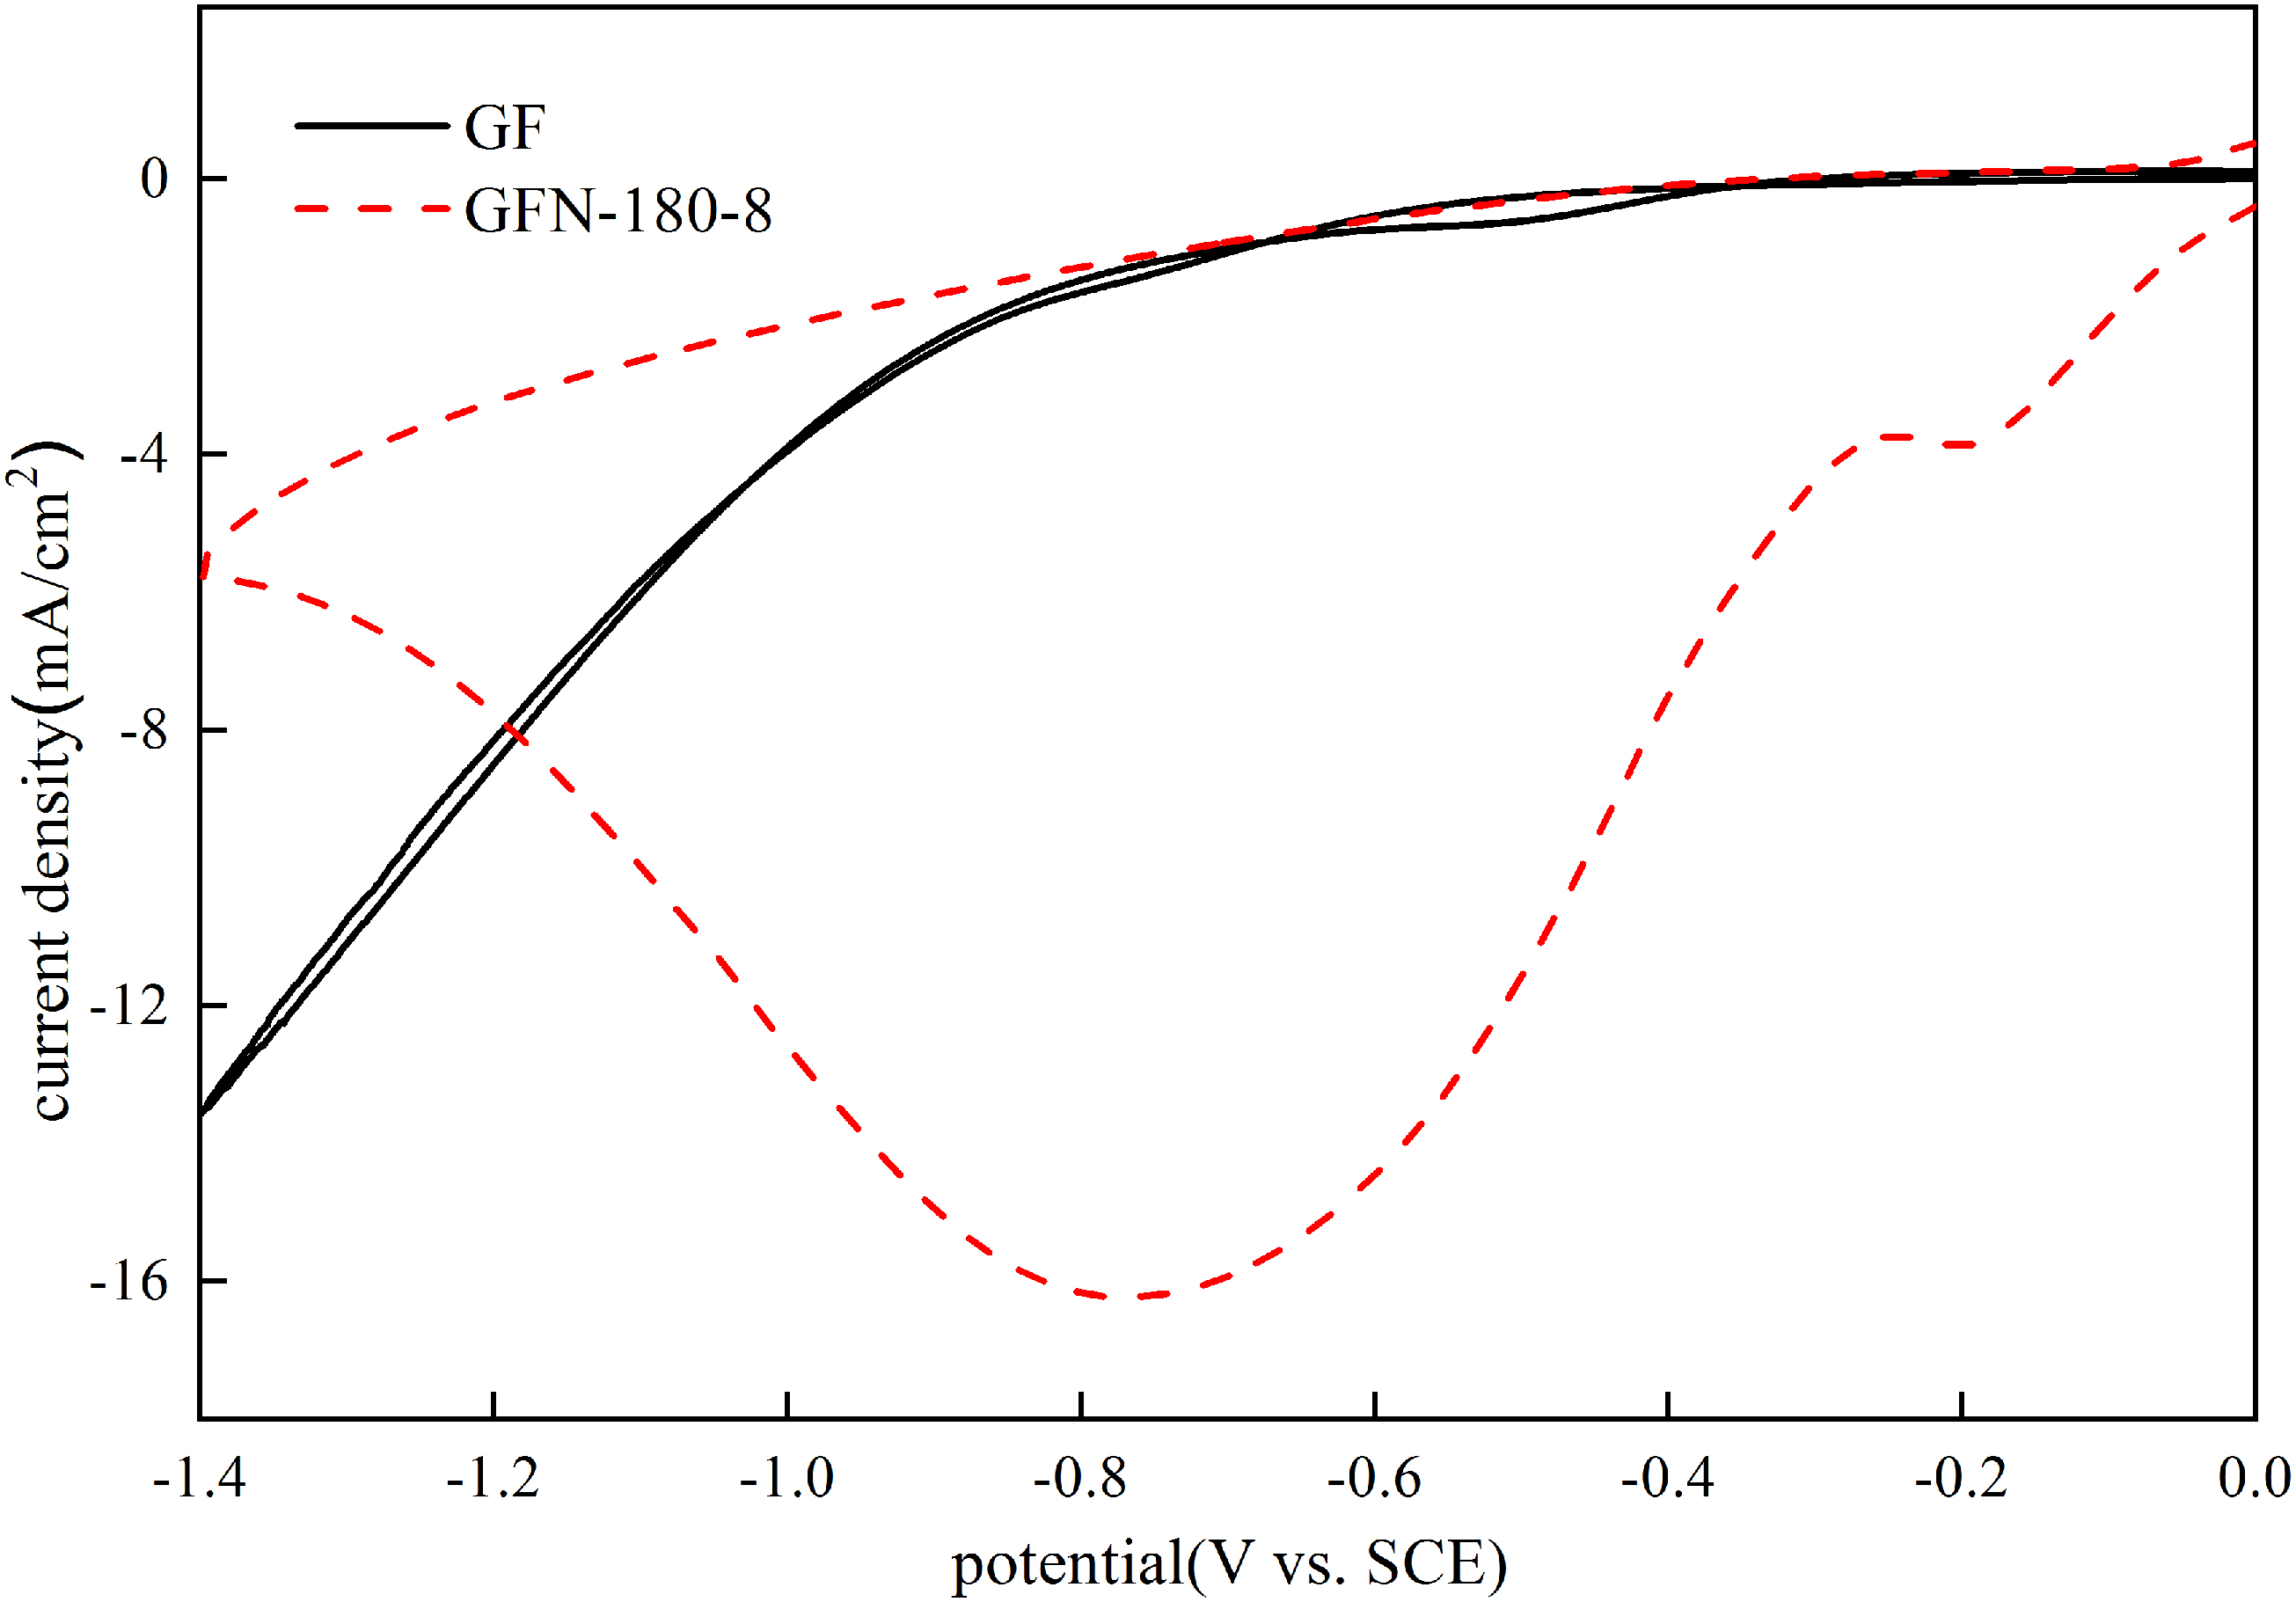
CV curves of GF and GFN-180-8. Conditions: scanning rate = 0.05 V/s, pH = 3, O2-saturated 50 mM aqueous Na2SO4 electrolyte. CV, cyclic voltammetry.
Effects of hydrothermal treating conditions on the activity of modified GF cathode
The CV profiles show that the lower oxygen reduction peak potential shifted from about −0.4 to −0.2 V as the hydrothermal treating temperature increased from 140 to 180°C (Fig. 6a). This suggests that the structure of the doped N may be affected by the treating temperature, which in turn affects the ORR selectivity. Further increasing the hydrothermal treating temperature did not lead to significant change of the reduction peak potential but the current density. The increase of the response current is consistent with the increasing iD to iG ratio in Raman spectroscopy. The higher iD to iG ratio indicates more defects on the corresponding GF, which can lead to higher ORR activity. Similar effect was found for the hydrothermal treating time on the ORR activity of the modified GFs (Fig. 6b). The two-electron ORR peak potential shifted from about −0.4 to −0.2 V and the response current increased accordingly as the hydrothermal treating time increasing.

CV curves of GF and GFNs prepared at various temperatures for 8 h
Production of peroxide species is desirable in the aqueous phase oxidation of organic pollutants. The preparation conditions of GFN were further optimized to maximize the H2O2 generation rate. The H2O2 accumulation experiments were carried out at a constant cathodic potential (−0.25 V) according to the CV analysis.
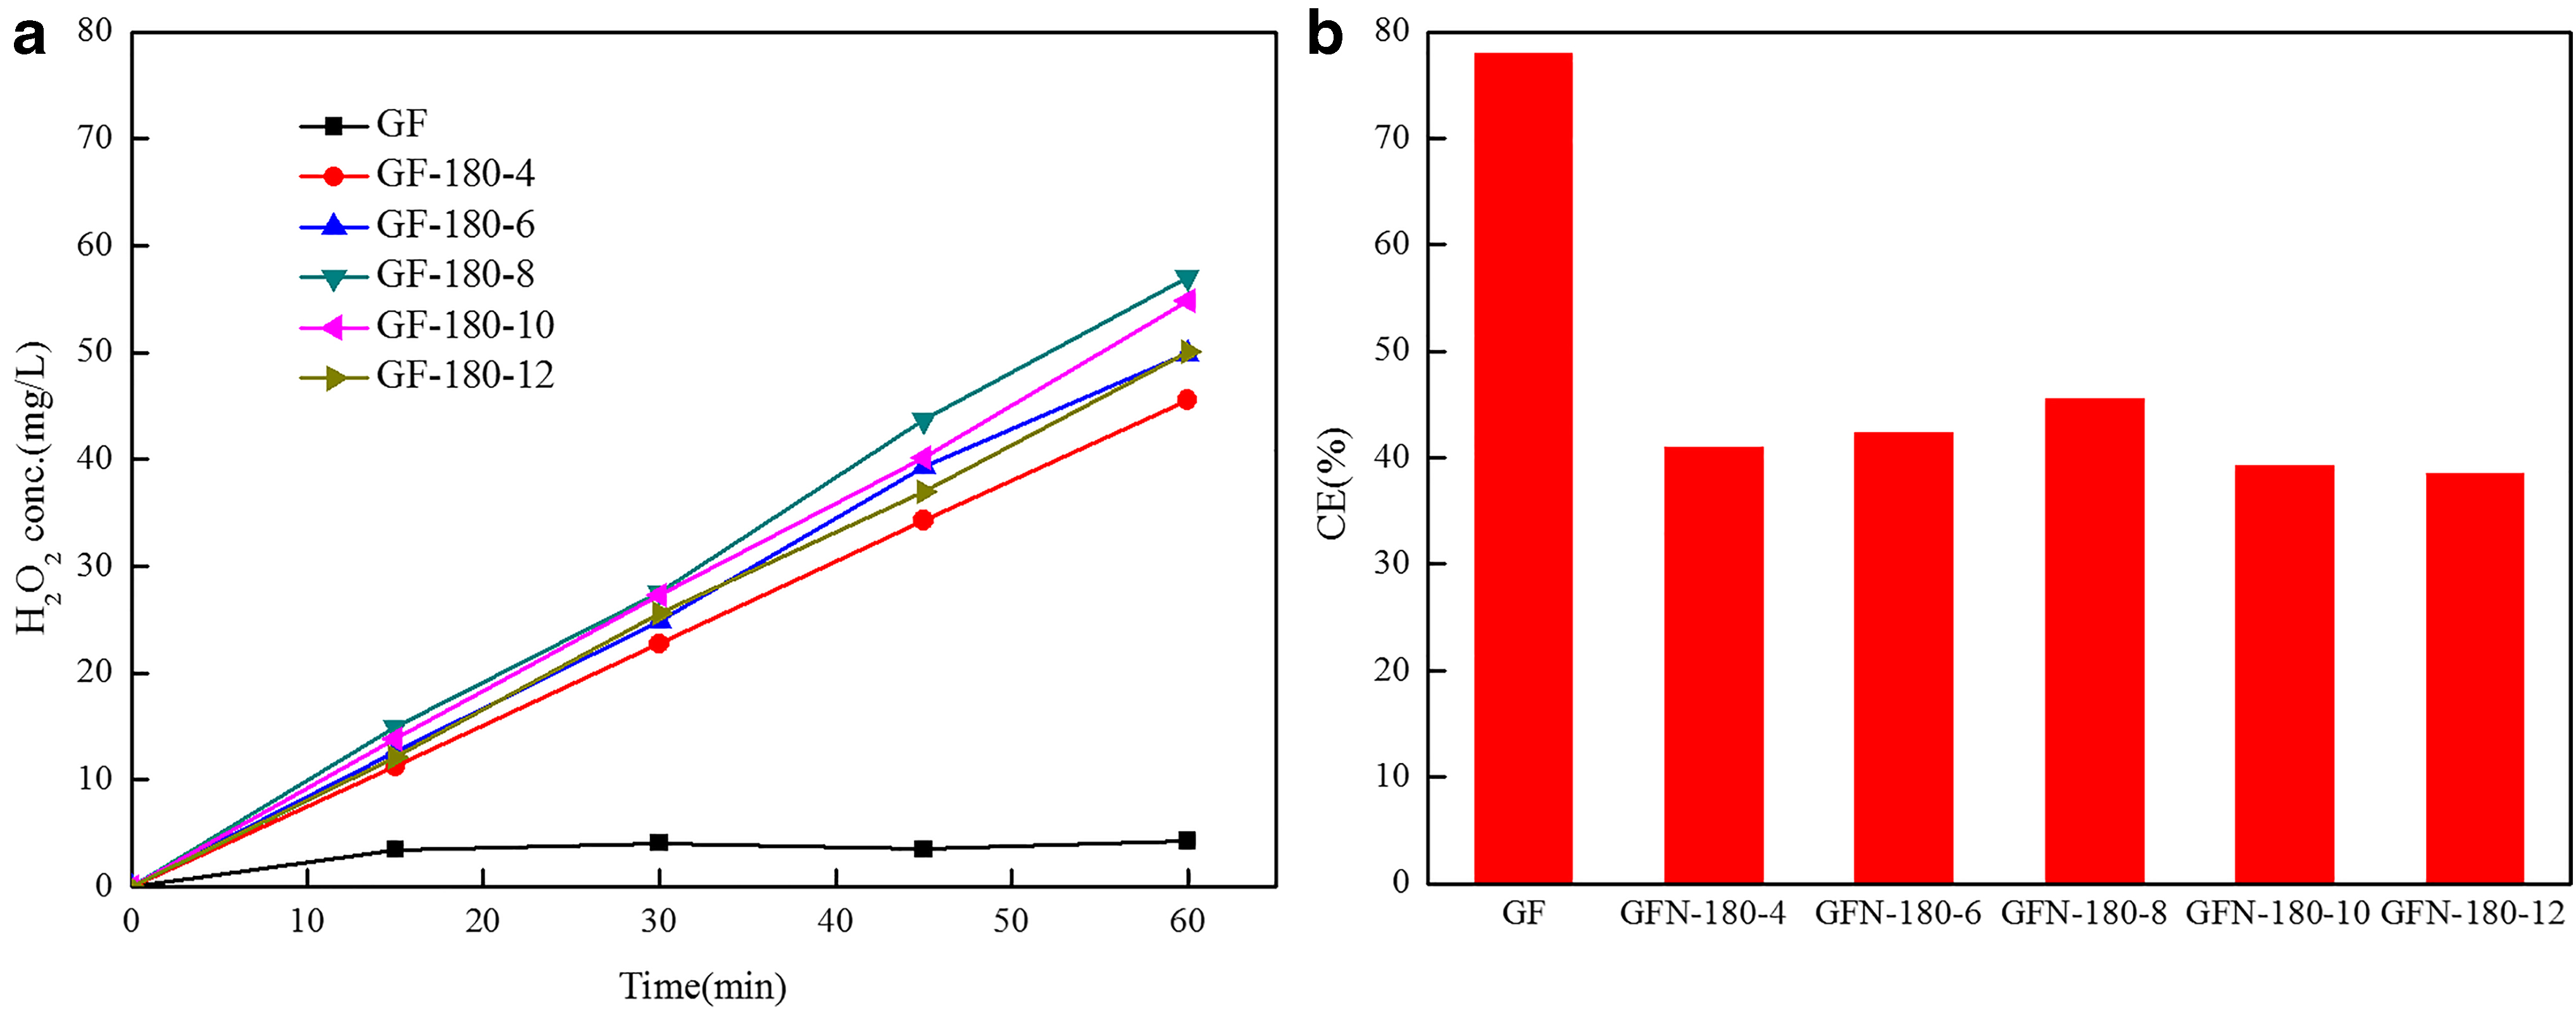
The H2O2 accumulating concentration was found linear to the reaction time (Figs. 7a and 8a), which suggests a zero-order reaction of the two-electron reduction reaction of oxygen on the GFN cathode. H2O2 accumulation rate increased from 6.55 to 14.25 mg/[L·cm2·h] as the hydrothermal treating temperature increased from 140 to 180°C, then it decreased to 8.70 mg/[L·cm2·h] as the treating temperature further increased to 220°C. Besides, H2O2 accumulation rate increased from 11.39 to 14.25 mg/[L·cm2·h] as the treating time increased from 4 to 8 h and then it decreased to 12.51 mg/[L·cm2·h] as the treating time further increased to 12 h.

The concentration of H2O2
The concentration of H2O2
180°C and 8 h was found to be the optimal hydrothermal treating conditions since it led to both the highest H2O2 accumulation rate and H2O2 concentration, 56.98 mg/L in 60 min. This indicates that hydrothermally modified GF has greater two-electron oxygen reduction activity which would lead to more oxidative peroxide species and facilitate the oxidation of organic pollutant in the aqueous phase.
The doping of nitrogen into carbon framework of GF can induce charge redistribution on the carbon framework by activating π electrons due to its higher electronegativity (Fellinger et al., 2012; Jiang et al., 2018). The presence of pyrrolic nitrogen can enhance the two-electron reduction pathway of oxygen by facilitating the adsorption of oxygen reduction intermediates (Fellinger et al., 2012; Jiang et al., 2018).
The CE toward H2O2 decreased slightly from 47.48% to 40.26% as the hydrothermal treating temperature increases from 140 to 220°C (Fig. 7b). Figure 8b shows that the CE toward H2O2 first increased with increasing treating time and reaches the highest value on sample GFN-180-8 (45.41%), then it decreased to 38.34% as the treating time extended further. The reason for such change could be complex. However, it is likely due to the decomposition of H2O2 on the anode (Eqs. 6 and 7), which is induced by the higher current density in the cell (Brillas and Casado, 2002). This also explains that why the low H2O2 generation rate of the original GF accompanied with high CE but low current density. On the contrary, both the two-electron and four-electron ORRs could be promoted but not in linear proportion as the treating temperature or time increased. Such competition may also contribute to the decrease in CE of H2O2 (Zhou et al., 2018).
Effect of cathodic potential on H2O2 accumulation with GFN-180-8
The effects of the applied electrode potential on the H2O2 generation rate and CE in EF process were investigated using GFN-180-8 as cathode (Fig. 9). Figure 9a shows that the H2O2 generation rate is linear to the cathodic potential within −0.25 to −0.75 V range although the CE decreased from 45.41% to 28.19% as the cathodic potential changed from −0.45 to −0.75 V. It is worth noting that the CE is nearly constant as the cathodic potential in the range of −0.25 to −0.45 V. This indicates that two-electron ORR is more favorable over four-electron ORR under less negative cathodic potential, while more negative cathodic potential would promote four-electron ORR pathway more efficiently. This leads to drastic decrease of the CE toward H2O2 (Xia et al., 2017). The CV profile of GFN-180-8 has showed that the four-electron reduction of oxygen is significantly enhanced at around −0.75 V (Zhou et al., 2014).

The concentration of H2O2
Phenol degradation in EF system
Effects of oxygen, potential, and GF on phenol degradation
An EF system was constructed using GFN-180-8 as the cathode material to test the degradation of organic contaminants at a constant cathode potential since GFN-180-8 exhibited the best performance in H2O2 generation. GFN-180-8 was used as cathode in subsequent experiments unless otherwise specified. Comparative experiments were conducted using the same setup. First, the oxidative degradation of phenol by oxygen without applying any potential was performed. Then, the electrochemical oxidation of phenol without supplying oxygen was performed. The results show that either oxygen oxidation or electrochemical oxidation itself can only lead to marginal degradation of phenol (Fig. 10). This suggests that the degradation of phenol by either the oxygen oxidation or anodic oxidation is negligible in the EF system. However, the phenol degradation was largely accelerated as both oxygen and cathodic potential were applied to the EF system (Fig. 10). About 84.6% and 25.4% conversion of phenol was achieved with 40 min using GFN-180-8 and GF as cathode, respectively. These results are consistent with the H2O2 generation rate mentioned above and prove that GFN is an efficient cathodic material for EF process.

Variation of phenol degradation percentage with time. For O2 oxidation: oxygen flow rate = 400 mL/min. For anode oxidation: applied cathode potential = −0.45 V. For EF process: oxygen flow rate = 400 mL/min, applied cathode potential = −0.45 V. EF, electro-Fenton.
Effect of the initial Fe2+ concentration
Ferrous cations act as the catalyst in Fenton process. Ferrous cation concentration is one of the most important operation parameters. Figure 11 shows that the presence of ferrous cations is critical for EF system. The phenol degradation rate first increases as the Fe2+ concentration increased from 0.2 to 1.5 mM. The phenol degradation rate constant k increased from 0.015 to 0.047 min−1 accordingly. The higher the ferrous cation concentration the higher the phenol degradation rate (Fig. 11). However, further increase of Fe2+ concentration does not lead to even higher phenol degradation rate. This suggests that Fe2+ facilitates the oxidative degradation of phenol by promoting the conversion of H2O2 to ·OH (Eq. 2). However, excessive Fe2+ would rapidly consume the ·OH radicals (Eq. 8) and compromise the degradation of phenol (Casado, 2019). 1.5 mM seems to be the optimal Fe2+ concentration in this EF system. Hence, the initial concentration of Fe2+ was fixed to 1.5 mM in the subsequent degradation experiments.

Effect of initial concentration of Fe2+ for phenol degradation kinetics. Conditions: initial Fig. 2. Cyclic voltammograms of GF and GFN-180-8 in solution of 10 mM K3[Fe(CN)6] and 1.0 M KCl at a scan rate of 10 mV/s concentration = 100 mg/L, pH = 3, 50 mM Na2SO4, applied cathode potential = −0.45 V, oxygen flow rate = 400 mL/min.
Effect of pH
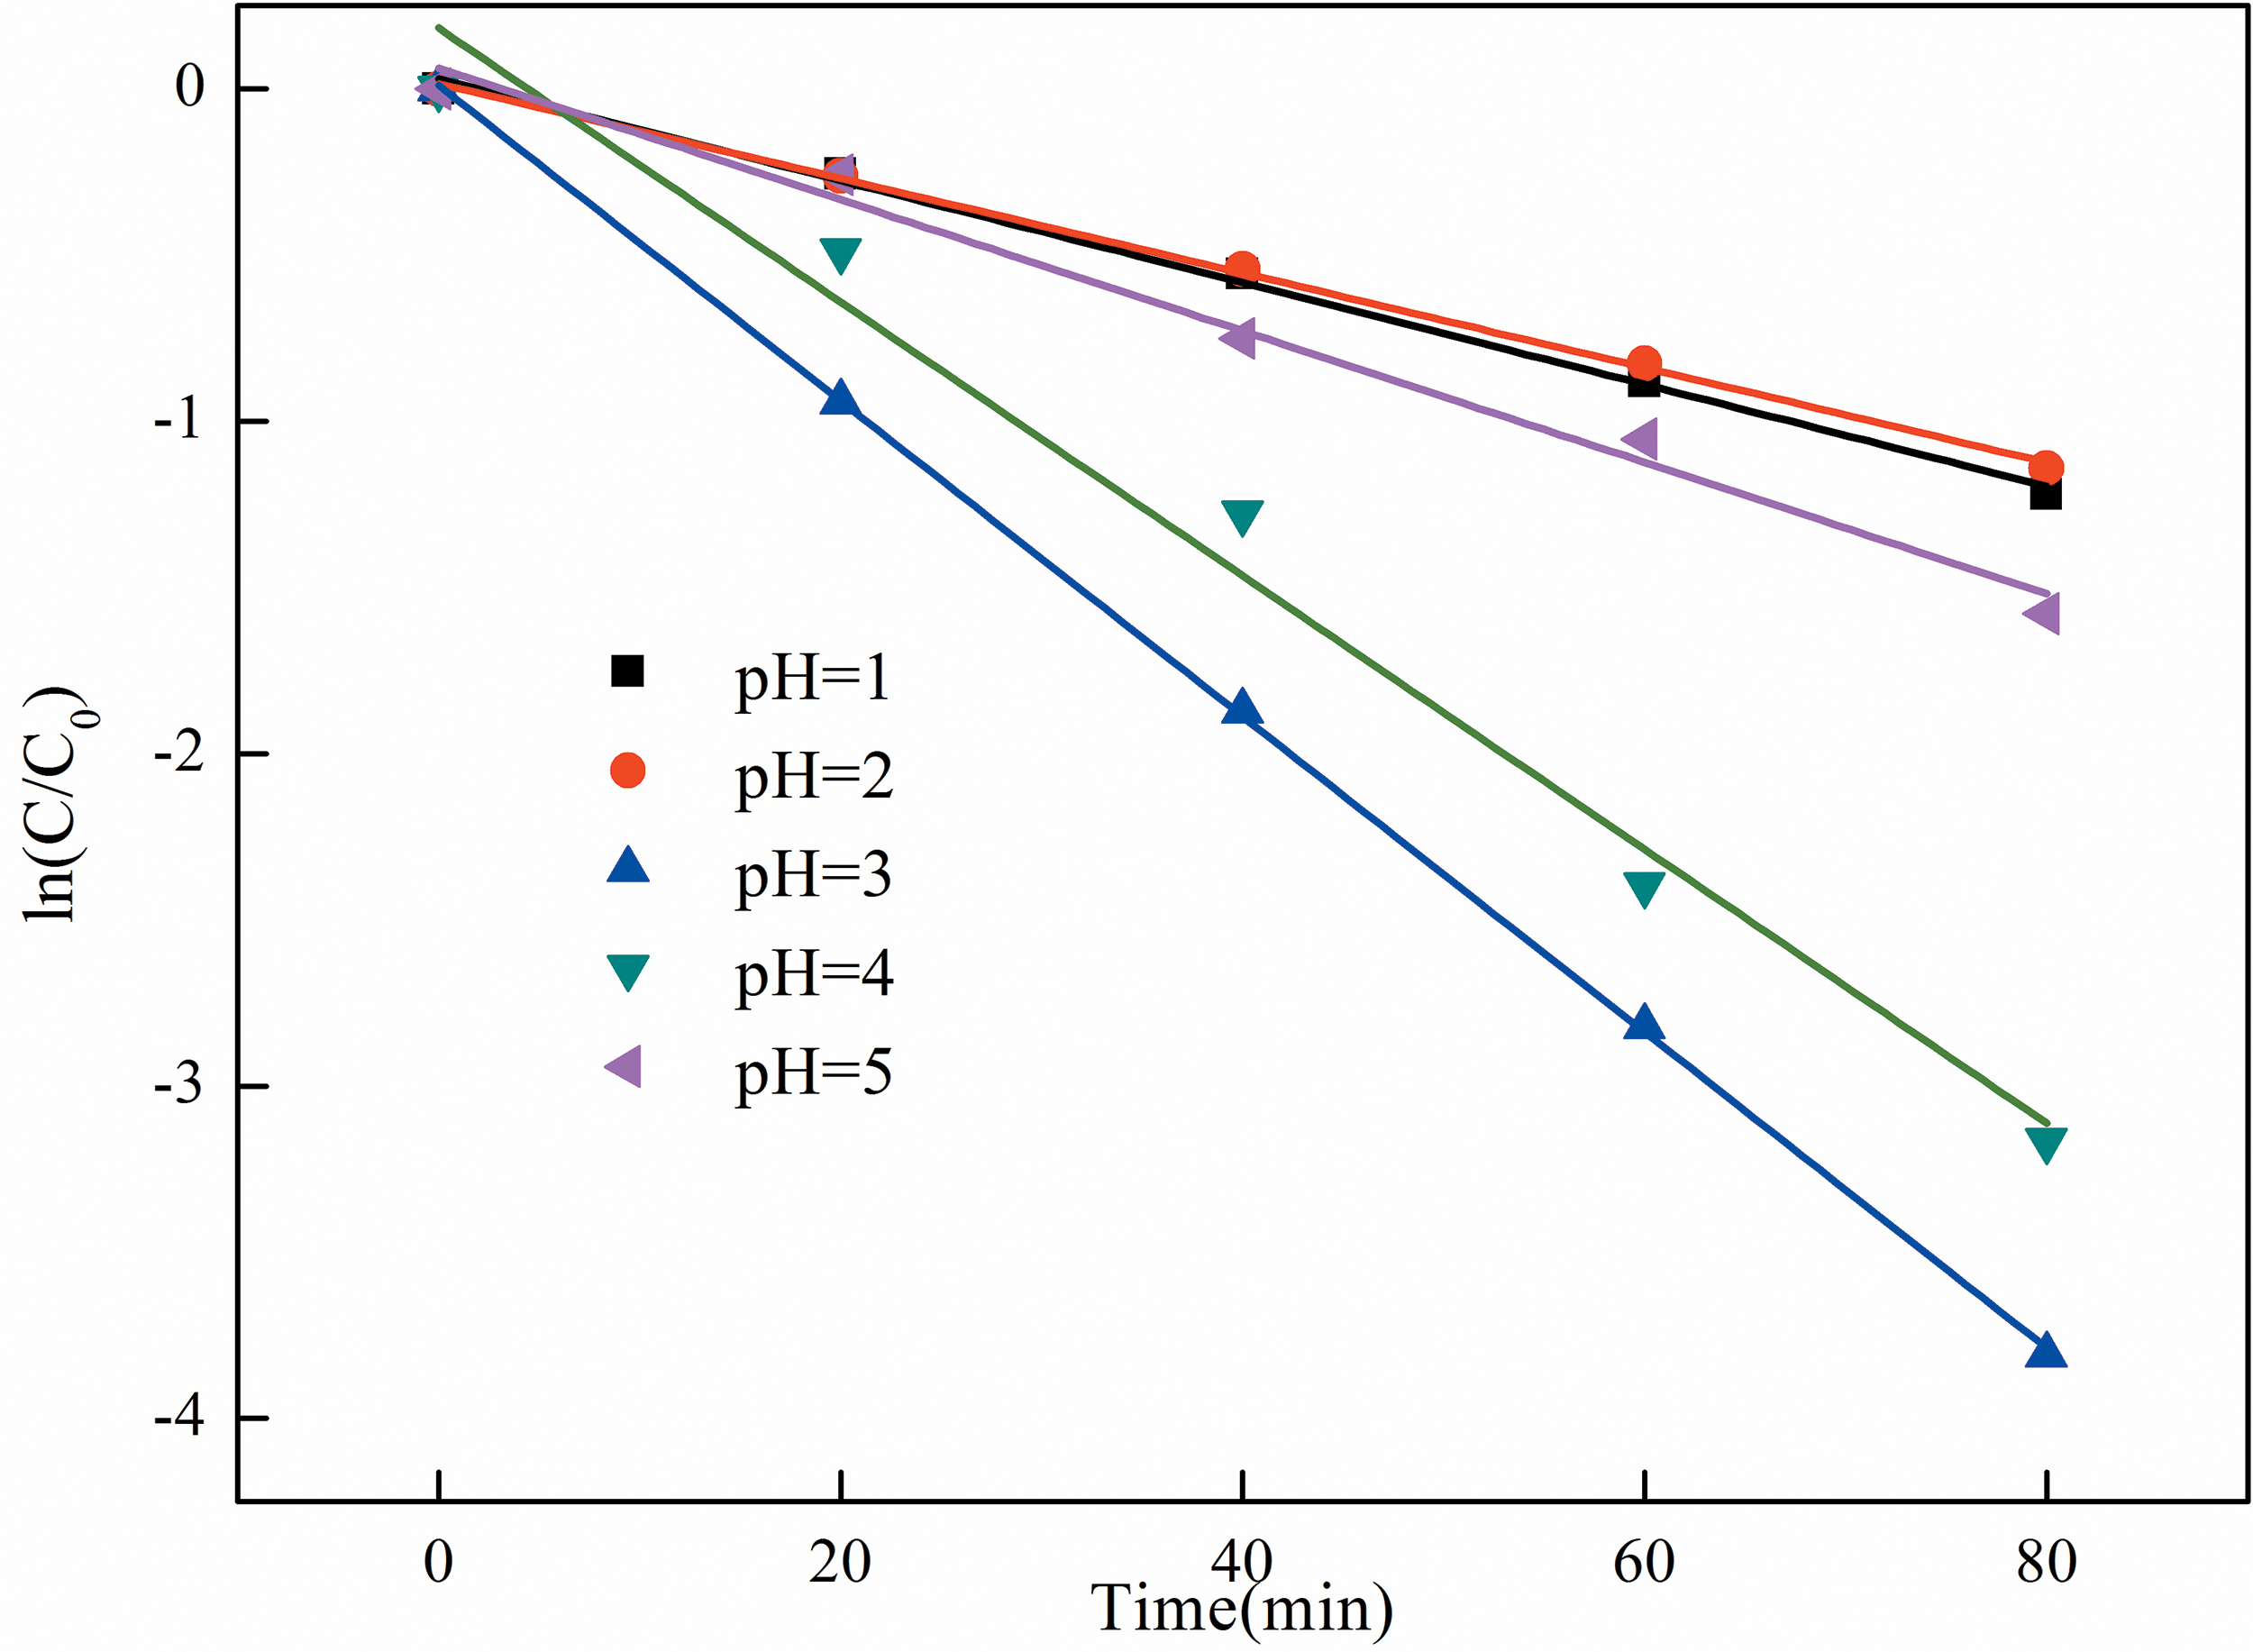
The pH value of a Fenton process is critical for the reactivity and stability of both H2O2 and ferric cations. Figure 12 shows the effect of pH on the phenol degradation rate. The degradation rate of phenol increased as the initial pH of the solution increased from 1 to 3, then decreased as the initial pH further increased to 5. The highest reaction rate (k = 0.047 min−1) was achieved at pH = 3, which is consistent with the literatures (Zhou et al., 2013; Lin et al., 2014). When pH is lower than 3, H+ is able to be combined with H2O2 to form a stable electrophilic ion, H3O2+, according to Eq. (9) (Lin et al., 2014), which in turn inhibits the formation of ·OH from the oxidation of Fe2+ by H2O2. However, Fe2+ and Fe3+ will precipitate in the form of corresponding hydroxides if the pH is about 5 or higher (Lin et al., 2014), but also promoted the decomposition of H2O2 (Jiang et al., 2018; Zhou et al., 2019).
Phenol degradation kinetics in different electrolyte solutions. Conditions: initial phenol concentration = 100 mg/L, [Fe2+] = 1.5 mM, pH = 3, 50 mM Na2SO4 or NaCl, applied cathode potential = −0.45 V, oxygen flow rate = 400 mL/min.
Effect of anion type
Chloride and sulfate salts are the most common inorganic salts presented in the salty wastewater (Lefebvre and Moletta, 2006). They are likely to be oxidized on the anode and lead to Cl2 (E0 = 1.358 V vs standard hydrogen electrode [SHE]) or S2O82− (E0 = 2.01 V vs SHE) (Brillas et al., 2009) if proper electric potential was applied, which in turn affects the EF process. Generally, SO42− has been widely adopted as the supporting electrolyte in many electrolysis processes since it is more inert than Cl-. Figure 13 shows the degradation of phenol in both Na2SO4- and NaCl-based electrolytes. Phenol degradation rate is somehow faster in NaCl-based electrolyte (k = 0.065 min−1) than in Na2SO4-based electrolyte (k = 0.047 min−1). This suggests that the oxidation of Cl− to Cl2 at the anode also contributed to the degradation of phenol in wastewater according to Eqs. (10–12) (Chatzisymeon et al., 2010; Santos et al., 2010).

Phenol degradation kinetics in different electrolyte solutions. Conditions: initial phenol concentration = 100 mg/L, [Fe2+] = 1.5 mM, pH = 3, 50 mM Na2SO4 or NaCl, applied cathode potential = −0.45 V, oxygen flow rate = 400 mL/min.
Degradation of different contaminants
Various typical organic pollutants from different industries, including TC-HCl, RhB, and p-Np, were also tested using the nitrogen modified GF, GFN-180-8, as cathode. Figure 14 shows that all the four typical organic pollutants can be efficiently degraded in the EF process. Almost complete degradation of these pollutants can be achieved within a relatively short period. Phenol is found to be the most refractory pollutant among them. The degradation kinetic constants of these pollutants using GFN-180-8 as cathode are about twice higher than that reported in literatures despite the lower cathode potential we applied (Table 3). This shows that GFN-180-8 is a superior cathode material for EF system.

Degradation kinetics of different contaminants. Conditions: initial phenol concentration = 100 mg/L, [Fe2+] = 1.5 mM, pH = 3, 50 mM Na2SO4, applied cathode potential = −0.45 V, oxygen flow rate = 400 mL/min.
Comparison of the Degradation Efficiency of Several Contaminants
CF, carbon felt; KOH, potassium hydroxide; p-Np, p-nitrophenol; RhB, Rhodamine B; TC-HCl, tetracycline hydrochloride.
Conclusion
It was found that hydrothermal treating with aqueous ammonia can successfully dope nitrogen atoms into the carbon framework of GF in the forms of pyridinic N, graphitic N, and pyrrolic N. The pyrrolic N and defects on the edge plane of GF introduced by N-doping facilitate the electron transfer from the cathode to the electrolyte and result in higher ORR activity. The highest H2O2 accumulation rate of 14.25 mg/[L·cm2·h] was achieved at a less negative cathode potential of −0.25 V over the optimal GFN. This H2O2 accumulation rate is about 12.4 times higher than that of the original raw GF (1.06 mg/[L·cm2·h]). Typical organic pollutants, including phenol, p-Np, TC-HCl, and rhodamine, can be almost completely degraded within 2 h in the EF system using the GFN as cathode. In short, the relatively low cost of the commercially available GF along with the efficient N-doping method under mild condition would help accelerating the development and application of electron-Fenton system in the salty wastewater treatment field.
Footnotes
Author Disclosure Statement
No competing financial interests exist.
Funding Information
The authors acknowledge for the financial support provided by the National Key R&D Program of China (grant no. 2018YFB0605700), the National Natural Science Foundation of China (grant no. 21878190), and the National Natural Science Foundation of China (grant no. 21406146).