
Abstract
A novel biological phosphorus removal in anoxic–aerobic sequencing batch reactor (SBR) using starch as carbon source had been found, but the role played by nitrate in this process was not clear yet. To reveal the effect of nitrate, two laboratory-scale SBRs operated in alternating anoxic–aerobic (R1) and alternating anaerobic–aerobic (R2) modes, respectively, were applied in this study. Results showed that phosphorus removal efficiency reached 78% and 77%, respectively, in R1 and R2. During anoxic stage in the R1, the accumulation of lactic acid was 16.66 mg/L, which was higher compared with 2.22 mg/L in the R2. While volatile fatty acid (VFA) was detected in the R2 with 20.44 mg/L, it indicated that there was more than one way for fermentation of starch in the two systems. Moreover, the production and consumption concentration of glycogen (74.29 mg/g volatile suspend solid (VSS) and 72.54 mg/g VSS) of the R1 was lower compared with 92.64 mg/g VSS and 105.75 mg/g VSS in the R2, respectively. It suggested that the internal carbon source of phosphorus absorption mainly derived from the decomposition of glycogen in the R2, and phosphorus uptake efficiency was related to the consumption of glycogen. The different bacterial community structure of the two systems was detected by high-throughput determination. Lactic acid-producing bacteria, such as Saccharibacteria genera incertae sedis and Enterobacter were predominated of the R1, whereas Thiothrix, Thermomonas, and Chryseolinea were dominant in the R2. It demonstrated that nitrate was more conducive to the enrichment of lactic acid-producing bacteria, thus promoting phosphorus uptake. This study improved our understanding of phosphorus removal by fermenting bacteria.
Introduction
Phosphate discharged into slow-moving water is one of the main causes of eutrophication. As one of the most economical and sustainable technologies for phosphorus removal from wastewater, enhanced biological phosphorus removal (EBPR) has been widely applied in full-scale wastewater treatment plants (Oğuz et al., 2003). Except some traditional phosphorus removal processes such as A2O (Kerrn-Jespersen et al., 1994; Yang et al., 2002), a certain number of improved phosphorus removal processes have been discovered (Hu et al., 2003; Yang et al., 2019). In denitrifying phosphorus removal processes, such as UCT or A2N, DPAOs utilize the required energy from oxidizing the polyhydroxyalkanoates (PHA) using oxygen or nitrate as the electron acceptor to take in excessive amounts of phosphate (Liu et al., 2008; Lee et al., 2009).
Wang (Wang et al., 2008) found the fact that phosphorus removal could be achieved in a single aerobic sequencing batch reactor (SBR) system. As in previous studies, Ghigliazza et al. had proved that anaerobiosis had no effect on EBPR system with pure cultured Acinetobacter lwoffi (Ghigliazza et al., 1998, 1999). In anaerobic–aerobic phosphorus removal system, nitrate of anaerobic stage had effects on denitrification efficiency and phosphorus-releasing capacity of polyphosphate-accumulating organisms (PAOs) (Du et al., 2018). When substrate (HAc) and nitrate were present simultaneously in anaerobic phase, a reduction of the phosphorus release by nitrate in biological phosphorus removal systems is partly due to the presence of denitrifying phosphorus removal bacteria (DPB) which utilizes HAc for denitrification, not for phosphorus release (Kuba et al., 1994).
Moreover, the concentration of NO3−-N would determine whether anoxic phosphorus uptake can be completed, because the denitrification rate of DPB using PHB is lower compared with ordinary heterotrophic denitrifying bacteria using chemical oxygen demand (COD). Therefore, only when the concentration of NO3−-N was more than the requirements of denitrifying bacteria, can DPB use NO3−-N as an electron acceptor to absorb phosphorus and be stimulated to grow and enrich, otherwise, it would be inhibited (Kerrn-Jespersen and Henze, 1993; Merzouki et al., 2001; Wang et al., 2004). In addition, Li has proved that the rate of denitrification phosphorus uptake could be higher by continuous addition of nitrate than by one-time addition. In the anoxic phase, the amount of denitrification nitrogen and phosphorus absorption had a good linear relationship (Li et al., 2003).
However, recent study has confirmed that phosphorus removal could be realized in the anoxic–aerobic SBR system with starch as sole carbon source (Zhang et al., 2010; Luo et al., 2017). It was proved that anaerobic phosphorus release was not necessary for phosphorus removal. In this process, instead of PHA, the accumulation of glycogen was high, which was different from traditional biological phosphorus removal. The fact has been demonstrated that fermentation process was a decisive role for P removal in the SBR during the anoxic stage (Luo et al., 2018). Starch was converted into glycogen and lactic acid in the system. Fermentation bacteria converted glycogen into pyruvate through the Embden–Meyerhof Pathway (EMP) under anoxic conditions, and then lactic acid was generated under the action of lactate dehydrogenase. The removal of phosphorus was mainly due to the ATP produced by fermentation bacteria through EMP to provide energy for phosphorus accumulation.
However, this process occurred only in the presence of nitrate during the anoxic condition. In addition, nitrate was a key factor to achieve anoxic phosphorus absorption. It has been found that different phosphorus removal processes appeared in the presence and absence of nitrate in anoxic phase, but the role of nitrate in these biological phosphorus removals were not clear yet. It is necessary to figure out the role of nitrate on phosphorus removal in anoxic–aerobic SBR system with starch as the sole carbon source.
Materials and Methods
SBR operation
SBR, with 8 L working volume was used in this study (Fig. 1). The SBR system was fed with starch as sole carbon source, and run with 8-h per cycle, including: anoxic phase (90 min), aerobic phase (220 min), and settling/decant phase (50 min). Synthetic wastewater (its composition is detailed below) was fed to reactors in the first 5 min of the anoxic period, the volume exchange ratio was 50%. The hydraulic retention time was 12 h. The reactor was stirred by overhead agitators at 300 r/min during the anoxic (anaerobic) phase. Aerobic condition was obtained by bubbling air, with dissolved oxygen (DO) between 2 to 3 mg/L. Throughout the operational period, pH value varied from 7.0 to 7.5, and the temperature was controlled at 25 ± 1°C with a water bath.

Schematic diagram of SBR. 1, Air pump; 2, Flowmeter; 3, Level controller; 4, Stirrer; 5, ORP/pH measuring instrument; 6, DO measuring instrument; 7, Microporous aerator; 8, SBR; 9, Outlet pump; 10, Inlet pump; 11, Inlet tank; 12, Outlet tank; 13, PLC. DO, dissolved oxygen; ORP, oxidation reduction potential; PLC, programmable controller; SBR, sequencing batch reactor.
The inoculated sludge was derived from the aeration tank of fourth municipal wastewater treatment plant in Xi'an, China. The initial concentration of mixed liquor suspended solid (MLSS) was controlled in the range of 3000–3500 mg/L, and the sludge age was about 20 days.
The experiment was conducted in two reactors, the first reactor (named R1) was fed with nitrate in oxygen-free stage, that is, anoxic stage, and the second reactor (named R2) was not nitrate fed in the anaerobic stage. The two reactors were operated in parallel.
Synthetic media
Concentrated synthetic wastewater used in this research consisted of organic and mineral solutions. The organic solution contained 400 mg of soluble corn starch per liter, which is the sole carbon source. The nutrient solution contained 0.07029 g KH2PO4, 0.14428 g KNO3, 0.07642 g NH4Cl, 0.0696 g MgCl2, 0.02114 g CaCl2, 0.5 mL of trace element mixture in 1 L of distilled water. The trace element mixture consisted of 0.90044 g FeCl3, 0.15 g H3BO3, 0.18 g KI, 0.03 g CuSO4·5H2O, 0.06 g MnCl2·4H2O, 0.12 g ZnSO4·7H2O, 0.15 g CoCl2·7H2O, 0.06 g Na2MoO4·2H2O, and 10 g EDTA in 1 L of distilled water. Loading amounts of COD, total nitrogen (TN), and orthophosphate-P (PO43−-P) to the SBR were 400, 30, and 8 mg/L, respectively.
Analytical methods
Standard methods were used for the analysis of COD, TN, nitrite-N (NO2−-N), nitrate-N (NO3−-N), ammonia-N (NH4+-N), orthophosphate-P (PO43−-P), total phosphorus (TP), MLSS, and mixed liquor volatile suspended solid (MLVSS) (APHA, 1998). The sludge P content was calculated by (TP–Pe)/VSS, where Pe was the phosphate concentration in effluent, and all samples were analyzed three times. VFA and PHA were determined by the gas chromatography (Agilent 6890N) method (Oehmen et al., 2005). Lactic acid was measured by colorimetric method based on p-hydroxyphenol method (Liang et al., 2008). Glycogen analysis was performed by the anthrone colorimetric method (Liu et al., 2007): 30 mL sludge samples were ultrasonicated with an ultrasonic probe (450 W, 3 s once, 3 s interval, 99 times in total). Ultrasonicated sludge was centrifuged (5000 r/min for 5 min, 4°C) and then washed three times with ultrapure water to remove the supernatant. Then a volume of 3 mL ultrapure water and 1 mL of 1:1 HCl was added into Hash tubes, and heated at 105°C for 6 h. Then 1 mL of the supernatant was determined for glucose by Ultraviolet spectrophotometer.
Intracellular polymers' dyeing
Appropriate amount of 4′6-diamidino-2-phenylindole (DAPI) stain (1 g/L) was applied to the prepared sludge smear, and dyed for 10 min in a dark place; After washing with sterile water and dried naturally, observed under fluorescence microscope. For DAPI, cells appear blue due to DAPI–DNA interactions, whereas polyphosphate inside the cells appears yellow in this image (Kawaharasaki et al., 1999).
DNA extraction and polymerase chain reaction amplification
Activated sludge samples were collected from the end of aerobic tank at different SBRs and stored at low temperature. The samples were sent to Shanghai Bioengineering Company for Illumina MiSeq high-throughput determination. Genomic DNA of the two samples (1 and 2) were extracted in triplicate using the E.Z.N.ATM Mag-Bind Soil DNA Kit according to the instructions of OMEGA Kit. The V3–V4 hypervariable regions of 16S rRNA gene were amplified with 341F (5′-CCTACGGGNGGCWCAG) and 805R (5′-GACTACHVGGGTATCTAATCC). After the first round of amplification, Illumina bridge polymerase chain reaction (PCR)-compatible primers were introduced for the second round. Finally, agarose electrophoresis was used to detect the PCR products.
High-throughput sequencing and statistical analysis
Illumina MiSeq Sequencing Platform was used to sequence the collected samples, and operational taxonomic units (OTUs) were annotated and clustered with 97% similarity using UPARSE pipeline (http://drive5.com/uparse/). Further analysis based on this result was conducted, such as diversity index, sparsity curve, species abundance, and community structure analysis.
Results and Analysis
Operation of the two SBRs
The anoxic–aerobic R1 was operated for about 180 days, and the anaerobic–aerobic R2 was operated for almost 100 days. After about 50 days startup, steady-state condition of R1 was achieved, and the phosphate removal efficiency reached 78%. In R2, after about 40 days startup, the system stabilized. Figure 2showed phosphate and nitrogen profiles during the steady-state conditions in two SBRs. In R1, the maximum efficiencies of phosphate and TN removal reached almost 78% and 88%, respectively. The effluent P concentration ranged within 1.7–2.1 mg/L, meanwhile, the effluent concentration of TN was measured between 3.5 and 4.3 mg/L. In R2, 1.8–2.3 mg/L of P and 0.7–1.3 mg/L of TN remained in effluent. Phosphate and TN removal efficiencies reached 77% and 92%, respectively. When the SBRs stabilized, MLSS, MLVSS, and the P uptake per g of total suspended solids (P/TSS) were observed (Table 1). As can be seen from Table 1, MLVSS/MLSS of R1 and R2 maintained 0.82 ± 0.2 and 0.83 ± 0.2, and the P/VSS ratios were maintained stably at 40 ± 2 and 48 ± 2 mg of P per gram of TSS. It can be referred that phosphorus was accumulated excessively by microorganisms.
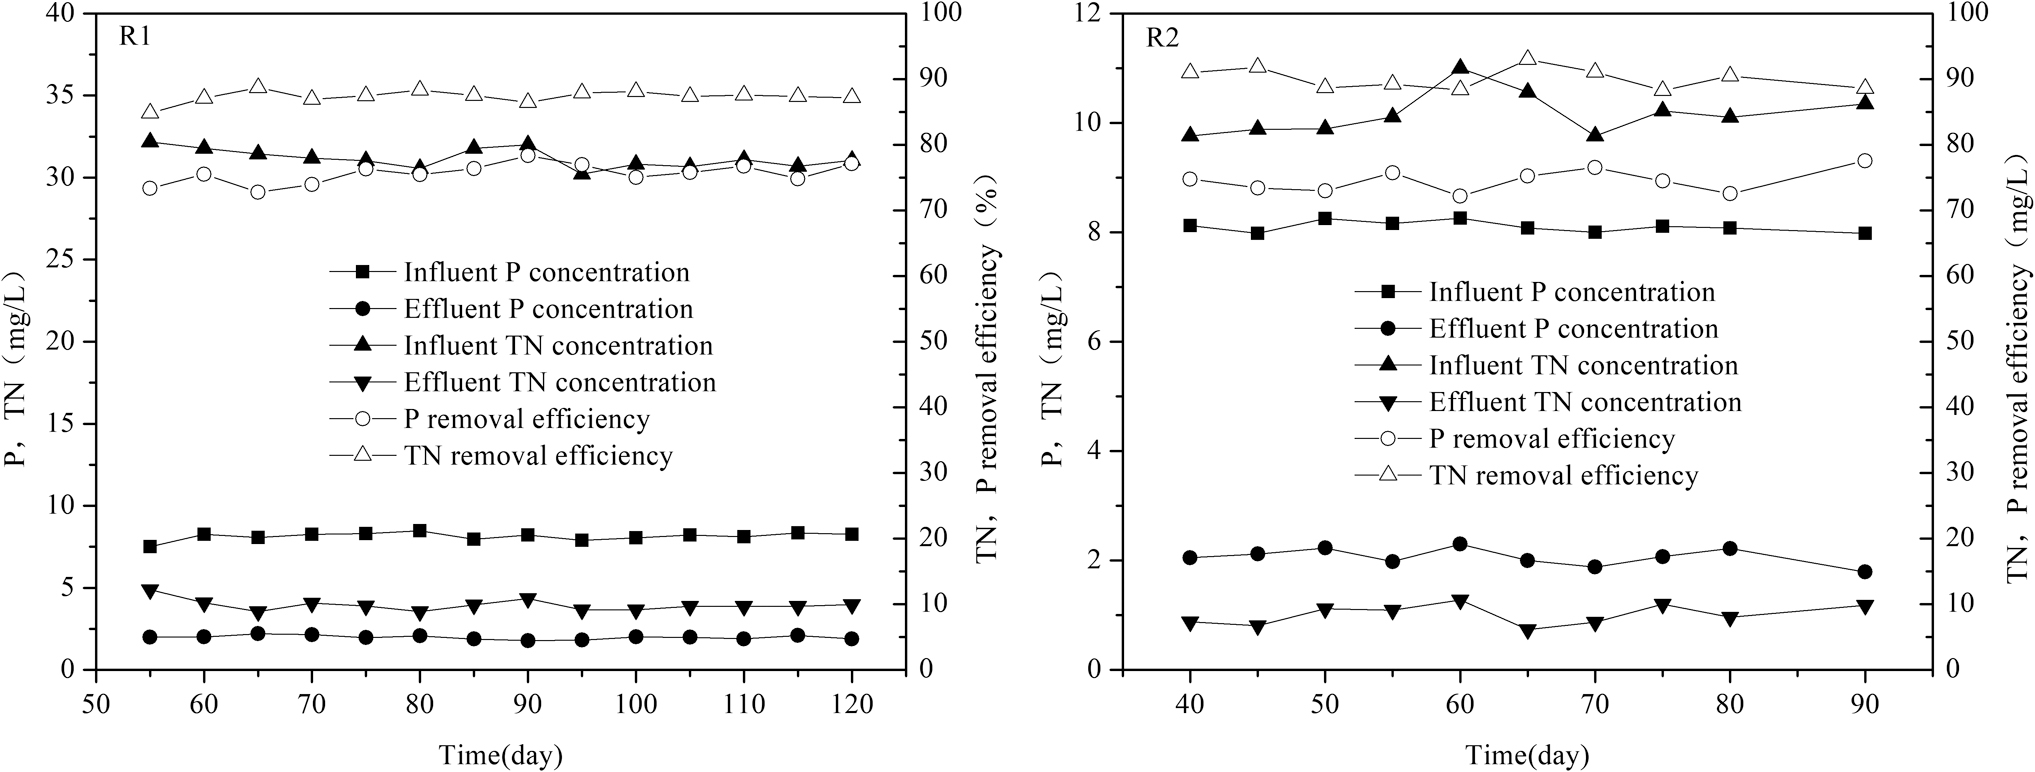
Phosphate and nitrate profiles during the steady-state conditions in two SBRs.
The Sludge Performances of R1 and R2 After Reaching the Steady-State Operation
MLSS, mixed liquor suspended solid; MLVSS, mixed liquor volatile suspended solid; P/TSS, the P uptake per g of total suspended solids.
Phosphorus removal process of the two SBRs
To have a deep knowledge of the process of phosphorus removal, typical circles of SBRs were examined. Figure 3 described the details of PO43−-P, NO3−-N, COD, lactic acid, glycogen, and VFA in the complete SBR processes during one cycle.

In both reactors, COD content declined rapidly in the first 30 min (200 ± 10 mg/L to 100 ± 10 mg/L) and then decreased continuously. Until the end of anoxic (anaerobic) period, COD concentration remained barely 50 ± 10 mg/L. When nitrate was added at the beginning of anoxic phase, nitrate was removed by 95.5% under the anoxic section, meanwhile, almost 48% amount of P was assimilated. That was, only 23% amount of P was absorbed during the aerobic stage (Fig. 3a). As shown in Fig. 3b, the concentration of P increased from 6.09 to 11.88 mg/L in the anaerobic phase, in this condition, phosphorus removal mainly occurred during aerobic section, which was similar to the traditional biological phosphorus removal mechanism (Mino et al., 1994). In anaerobic–aerobic condition, PAOs realized the process of anaerobic phosphorus releasing and aerobic phosphorus uptake. In R1, the synthesized glycogen amount was 74.29 mg/g VSS in the anoxic stage, and the consumed glycogen amount was 72.54 mg/g VSS in the aerobic zone. In R2, the synthetic glycogen amount was 92.64 mg/g VSS in the anaerobic stage, and the consumption glycogen amount was 105.75 mg/g VSS in the aerobic zone.
Comparing R1 with R2, the synthesized and consumed glycogen amount of R1 were both less than those in R2. It explained that in aerobic zone of R2 system, the internal carbon source of phosphorus absorption mainly derived from the decomposition of glycogen, and phosphorus uptake efficiency was related to the consumption of glycogen. Instead of PHA, glycogen was used as internal carbon source for complete metabolism (Ciggin et al., 2013). The maximum lactic acid concentration reached 16.66 mg/L at the first 40 min in R1, but only 2.22 mg/L in R2. Meanwhile, VFA was detected in R2 with 20.44 mg/L. This indicated that there was more than one way for fermentation of starch in these systems. The pathway of fermentation producing lactic acid was associated with the removal of phosphorus. Moreover, different fermentation productions were produced in the two SBRs, suggesting that nitrate affected the way of fermentation or fermentative bacterium.
DAPI staining results of polyphosphate particles
It is known that polyphosphate, PHA, and glycogen are the main polymers of PAO, meanwhile, they are the major source of microbial energy. Polyphosphate is formed by the orthophosphoric acid monomer combining of ester bonds. Micromolecule polyphosphate can combine with metal cations or small molecular proteins, while macromolecule polyphosphate can bind to other polymers, such as proteins and nucleotide. Therefore, polyphosphates are often used as phosphorus storage (constituents of nucleotide) and energy storage (forming ATP) (Satoh et al., 1992). In anaerobic phase, the energy for the storage of glycogen and PHA by PAOs was from the hydrolysis of polyphosphate particles. In aerobic phase, PAOs utilized the energy of PHA oxidation to take in phosphorus. Poly-P was detected and P/TSS increased over time. It has been demonstrated that phosphorus was transported into cells to synthesize poly-P using ATP (Kortstee et al., 2000).
Figure 4 was a fine description of staining results of poly-P particles of anoxic–anaerobic and aerobic phase. Compared with Fig. 4a, the distribution and quantity of poly-P particles are obviously larger in Fig. 4b. Together with Fig. 5, the phosphorus content of sludge at the end of anaerobic phase was much lower than that at the end of aerobic stage in R2, which was inferred that the poly-P particles hydrolyze in the anaerobic stage, and the synthesis of phosphorus-accumulating particles mainly occurs in the aerobic stage. Therefore, in typical phosphorus removal system, P/TSS was minimum at the anaerobic end.
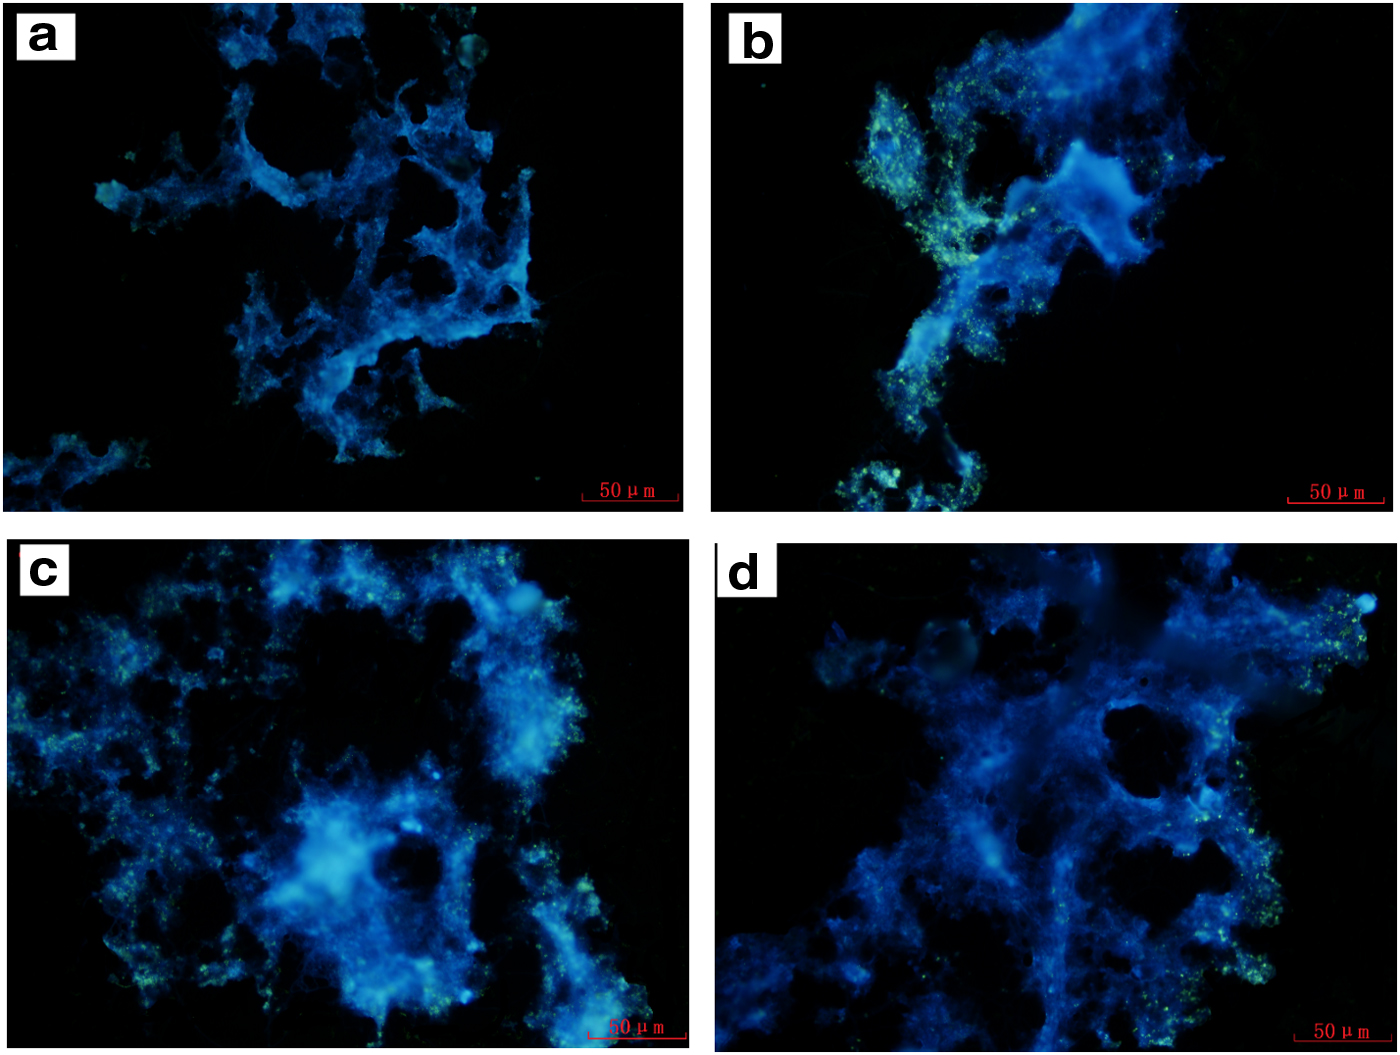
Epifluorescence micrographs of the sludge by DAPI staining for poly-P of the end of anaerobic
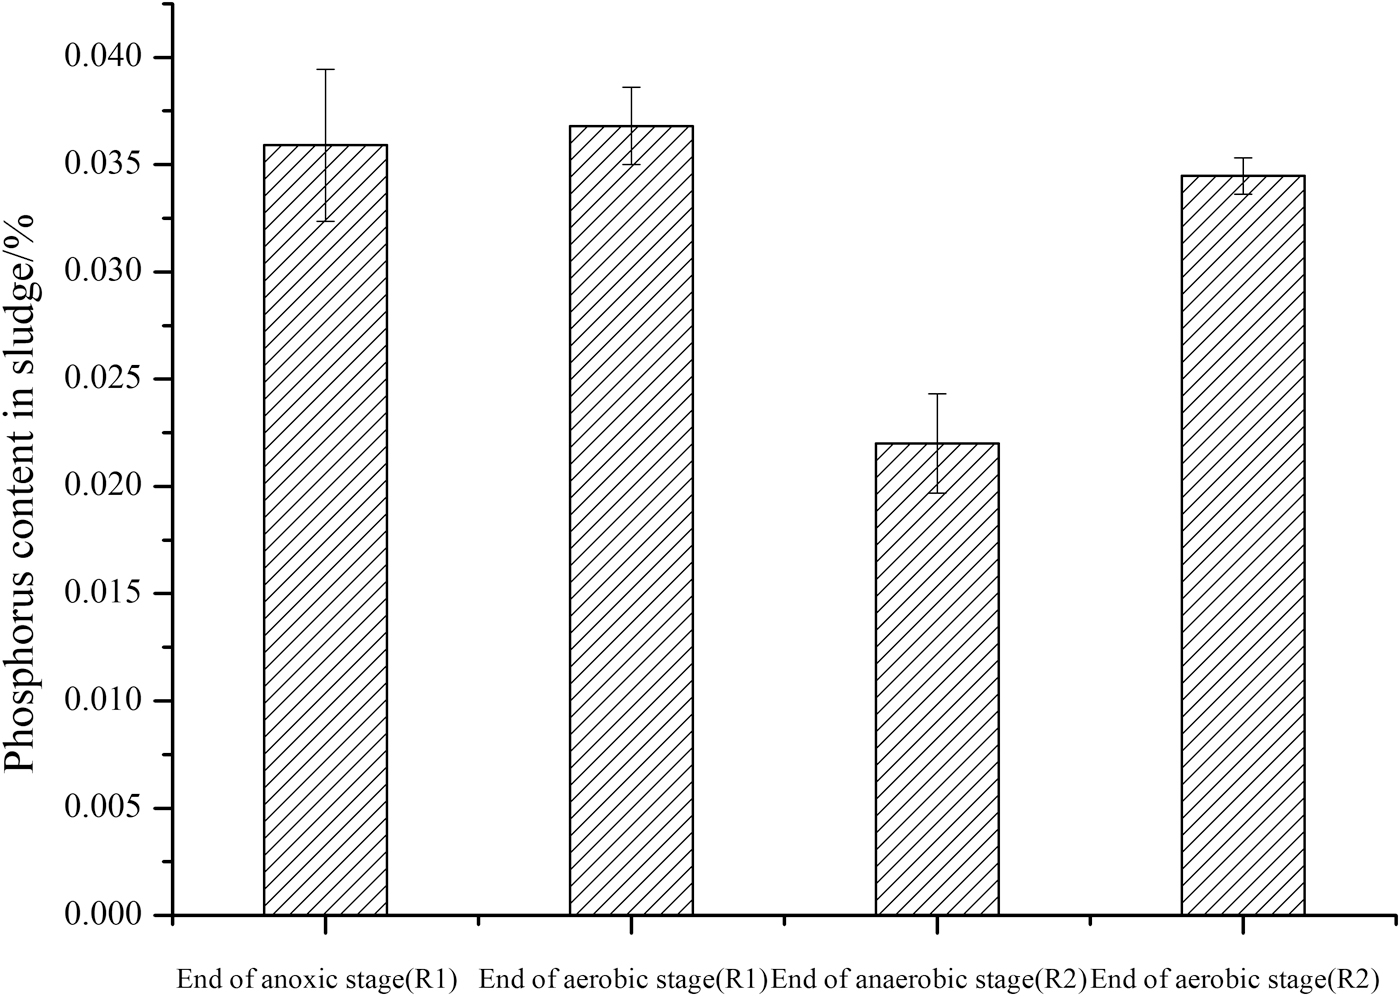
Phosphorus content in sludge at the end of anoxic, (anaerobic) and aerobic.
There was no significant difference in the distribution and quantity of poly-P particles between the end of anoxic stage and aerobic stage in R1 (Fig. 4c, d), and the phosphorus content of sludge increased slightly from anoxic stage to aerobic stage. In the anoxic–aerobic system, activated sludge microorganisms showed a process of phosphorus uptake without obvious phosphorus release. It indicated that the energy required for microbial metabolism in R1 was not from the hydrolysis of polyphosphate, which was contrary to the traditional biological phosphorus removal systems.
Generally, it is believed that the energy required by microorganisms in anaerobic (anoxic) phase is mainly related to the hydrolysis of polyphosphate granules or the absorption of organic compounds (Wang and Hill, 2002). So when phosphorus release did not occur, it could be considered that the degradation of organic compounds provided the energy needed by microorganisms, that was, starch fermentation in this system. The decomposition of poly-P would cause the accumulation of phosphate in cells, since excessive phosphate cannot be fully used for the biosynthesis of the organism, so part of phosphate would be separated out to extracellular by the corresponding carrier protein through active diffusion, increasing the concentration of phosphate in the solution. Therefore, in the aspect of phosphorus release, it can be seen that nitrate had an obvious inhibitory effect on the decomposition of poly-P, resulting in no phosphorus being released in the anaerobic phase (Veen et al., 1994).
Microbial community compositions
The relative frequency of dominant microorganisms at phylum levels in two samples was shown in Fig. 6a. The phylum Proteobacteria was the most abundant in both SBRs, accounting for 43.96% and 41.22%, and almost half of the Proteobacteria were Gammaproteobacteria (19.39% and 19.85%). This was followed by Bacteroidetes (relative abundance of 15.93% and 35.24%), which are common bacteria in EBPR (Fu et al., 2008). While in R1, the quantity of phylum Candidatus Saccharibacteria (relative abundance of 20.48%) was exceeded far by R2 (relative abundance of 2.01%).

Distributions at phylum
Eo and Park (Eo and Park, 2016) reported that the relative abundance of phylum Candidate Saccharibacteria could increase by increasing N content in soil through fertilization. It suggested that the more preference of Candidate Saccharibacteria existed in more N-rich environments. In R1, more sequences were distributed in the phyla Actinobacteria and Planctomycetes, and less Acidobacteria, Verrucomicrobia, and Chloroflexi compared with R2.
As shown in Fig. 6b, at the genus level, the community structures were different among the two samples, although the other environmental and operational conditions were controlled by the same. Saccharibacteria genera incertae sedis and Enterobacter were the common dominant genus in R1, accounting for 20.48% and 10.11%, which belong to Candidatus Saccharibacteria and Gammaproteobacteria, respectively.
Previous reports have shown that Candidatus Saccharibacteria can be enriched in SBR with soluble starch as carbon source, but not in SBR with sodium acetate as carbon source (Zhao et al., 2018). This result was similar to that of the R1 system. As a fermentation bacterium, Enterobacter was able to ferment glucose into lactic acid (Converti and Perego, 2002). However, in R2, Candidatus Saccharibacteria abundance was only 2.01%. Thiothrix (8.17%), Thermomonas (4.18%), and Chryseolinea (2.67%) were the most dominant genus, and the relative abundance of Thermomonas was 4.82%, which was related to heterotrophic denitrification, ranked the fourth in the sample of R1 (Mergaert et al., 2003). Thiothrix belonged to filamentous bacteria, and it mostly existed in anaerobic–aerobic SBR systems. It was inferred that nitrate also inhibited the dominant growth of filamentous bacteria. Because most filamentous bacteria had strict aerobic respiration characteristics, and they could only use oxygen as an electron acceptor, but couldn't use nitrate as an electron acceptor (Wanner et al., 1987; Horan et al., 1988). Although a few filamentous bacteria can use nitrate, but its substrate utilization efficiency and denitrification rate were much lower than zooglea (Gulez and De Los Reyes, 2009). Tetrasphaera was existed in both SBRs with the relative abundance of 1.56% and 0.69%, which was considered to be putative PAOs in EBPR from wastewater (Kristiansen et al., 2013).
The carbon source in this system was soluble starch, so it must be converted into small molecular organic compounds by fermentation bacteria first, so that it can be used by other microorganisms. Recently, the whole Saccharibacteria genome obtained through macrogenomics had shown that some certain bacteria had the characteristics of specific fermentation metabolism, which could ferment glucose and others into lactic acid (Albertsen et al., 2013; Kantor et al., 2013). In addition, acid-producing bacteria such as Enterobacter and Lacibater could also ferment glucose into lactic acid and other products, at the same time produce ATP for the growth and metabolism of microorganisms. Therefore, lactic acid-producing fermenting bacteria were dominant strains in the R1 system and played an important role in phosphorus removal in anoxic phase.
Analysis of microbial community diversity
Diversity analysis of a single sample (α diversity) can reflect the abundance and diversity of the microbial community. Based on the difference of similarity level, all sequences of each sample were divided into OTU, and biological information was statistically analyzed at 97% similarity level. Shannon and Simpson diversity indexes were usually applied to reflect the diversity.
Compare the two systems as shown in Table 2, the microbial diversity of R2 system was higher than that of R1 system. Zhao (Zhao and Zhang, 2014) found that the operational states and environmental conditions of the reactor had the effect on microbial diversity. Nitrate was added to R1 system, which increased the restriction condition in R1 on microorganisms, resulting in the lower diversity of R1 system. Since other conditions were the same in both systems, it was demonstrated that nitrate was the key factor of the influence of microbial population diversity.
The Diversity of the Samples
OTU, operational taxonomic unit.
Discussion
As described previously, it was found that EBPR was completed by two kinds of microorganisms, lactic acid producing fermentation organisms and phosphorus accumulating organisms (PAOs) when starch was supplied as a sole carbon source. In R1, the nitrate provided a favorable environment for the growth of fermentation phosphorus accumulating bacteria. Although most lactic acid fermenting bacteria belong to Firmicutes, Firmicutes in two SBRs was rarely abundant. And other fermentation bacteria were found to produce lactic acid.
Firstly, the starch was rapidly converted into glucose. Secondly, fermentation bacteria transformed glucose into lactic acid. The requirement of the ATP for P uptake was supplied by lactate formation through glycolysis of glucose rather than the hydrolysis of polyphosphate in the anoxic stage. At the same time, PAOs absorbed glucose and lactic acid to accumulate glycogen in the cell. When the external carbon source was exhausted, glycogen was used as an internal carbon source to be transformed into lactic acid, and the ATP generated simultaneously in this process was used to take in phosphorus by fermentation bacteria. Lactic acid producing fermentation organisms were facultative bacteria and produced lactic acid to obtain energy for P uptake and the glycogen storage, which was different from R2.
Moreover, during the anoxic phase, PAOs transformed lactic acid into glycogen with the decomposition of polyphosphate, while the amount of P released by this process was far less than the amount of P absorbed by lactic acid producing fermentation bacteria. In the subsequent aerobic section, PAOs utilized the energy of glycolysis to further absorb phosphorus. On the contrary, without nitrate in anaerobic phase, the R2 system exhibited the same process as traditional biological phosphorus removal. It revealed that nitrate was the key of phosphorus uptake by lactic acid producing fermentation organisms. It could be found by high-throughput sequencing and fermentation products, that nitrate affected the microbial community structure, consequently affected the fermentation way of starch. As shown in Figure 6b, there was a significant difference between these two systems.
Conclusion
In the two system, efficient nitrogen and phosphorus removal were both achieved. Phosphorus removal process in anoxic–aerobic system was completely different from that of the anaerobic–aerobic system and denitrification phosphorus removal system. In the R1, the phosphorus removal was accomplished mainly by anoxic phosphorus uptake of lactic acid fermentation bacteria, while in the R2, the phosphorus removal was accomplished by anaerobic phosphorus release and aerobic phosphorus uptake of traditional PAOs. Nitrate inhibited the release of phosphorus in anoxic phase, the result is that PAOs could not be enriched. However, the condition with nitrate was more conducive to the enrichment of phosphate-removing fermentation bacteria, which could take in phosphorus during the anoxic stage.
Saccharibacteria genera incertae sedis and Enterobacter were the main dominant genus for phosphorus removal in anoxic–aerobic system, while Thiothrix, Thermomonas, and Chryseolinea were dominant genera in anaerobic–aerobic system. Moreover, the microbial diversity of the system with nitrate was lower compared with the system without nitrate.
In both systems, glycogen was utilized as internal carbon source for complete metabolism instead of PHA. Starch was converted to lactic acid by the fermentation bacteria during the anoxic phase, and ATP produced by this process was provided for poly-P synthesis.
Footnotes
Author Disclosure Statement
No competing financial interests exist.
Funding Information
This research was supported by the project of the National Natural Science Foundation of China (51078304).