
Abstract
Household plumbing biofilms can harbor and transmit bacterial pathogens. Pulmonary infections by nontuberculous mycobacteria (NTM) can occur from this transmission route. NTM infections are increasing around the world and in New Jersey (NJ), where this field study was performed. Plumbing biofilm samples were collected from sinks and showerheads in homes using private wells (n = 19) and in homes of NTM patients (n = 5). DNA extracts were analyzed by quantitative polymerase chain reaction (qPCR) to quantify mycobacterial marker genes and by amplicon sequencing to describe the microbiomes where NTM were observed. Water samples were analyzed for basic water quality parameters and fecal indicator organisms. Participants completed surveys about their wells and home water systems to enable testing of potential relationships between these environmental factors and the microbial communities. NTM were observed in more than half of private well biofilm samples using qPCR and in all of the selected samples analyzed by amplicon sequencing (n = 29/70), even when below detection by qPCR. Samples from patient homes, most of whom used public water supply, had similar abundances of NTM as samples from private wells. Physiography and within-home location (e.g., kitchen sink) explained some variation in concentrations of mycobacteria genes. One microbial family with no known human pathogens, Rikenellaceae, was identified as a potential antagonist to mycobacteria using linear discriminant analysis effect size (LEfSe). This study illuminates the widespread nature of NTM in private well water systems without disinfection selection pressures, and works toward understanding ecological interactions that may aid or slow the growth of NTM toward ecological engineering of healthy plumbing microbiomes.
Background and Introduction
Nontuberculous mycobacteria (NTM) are Gram-positive, acid-fast bacteria (Reynolds et al., 2009) ubiquitous in water and soil environments (Falkinham, 2002). Several NTM species are opportunistic pathogens, disproportionately affecting the immunocompromised, resulting in NTM pulmonary disease in those with cystic fibrosis and chronic obstructive pulmonary disease (COPD), as well as elderly populations (Strollo et al., 2015). In recent years, NTM pulmonary disease has also increasingly affected immunocompetent patients, or individuals without classic risk factors (Stout et al., 2016). Cases of NTM pulmonary disease have been on the rise around the world and in the United States, where estimates suggest that infection rates nearly doubled from 8.2 per 100,000 persons to 16 per 100,000 persons from 1994 to 2014 (Donohue, 2018; Ratnatunga et al., 2020). NTM pulmonary disease costs in the United States increased from $815 million in 2010 (Strollo et al., 2015) to $1.53 billion in 2014 (Collier et al., 2021), with projections to continue increasing. In Hawaii, California, Louisiana, Florida, Oklahoma, and Wisconsin, as well as in Pennsylvania and New York, states directly to the west and north of the location of this study in New Jersey (NJ), Medicare records indicate spatial clusters of NTM pulmonary disease (Adjemian et al., 2012), a trend that has also been observed elsewhere (Lipner et al., 2017).
Species responsible for NTM disease vary across the country and globe. In the United States, members of the slow-growing Mycobacterium avium complex, Mycobacterium xenopi, Mycobacterium kansasii, and rapid-growing Mycobacterium fortuitum and Mycobacterium abscessus are the primary disease-causing species (Hoefsloot et al., 2013; Honda et al., 2018). Treatment for NTM pulmonary disease is complicated (Daley et al., 2020), costly (Strollo et al., 2015; Collier et al., 2021), and can involve extended hospital stays in addition to several months of antibiotic therapies (Dowdell et al., 2019; Daley et al., 2020). As NTM infections become more frequent, and as the population ages, it is of growing importance that environmental exposures to NTM be understood and mitigated.
NTM, as a result of their lipid outer membranes, are hydrophobic (Brennan and Nikaido, 1995), impermeable (Nikaido et al. 1993; Daffé and Draper, 1997), and slow growing (Daffé and Draper, 1997). They are also capable of hiding within host organisms (Delafont et al., 2014; Dowdell et al., 2019), making them well suited for growth in biofilms (Falkinham, 2009; Parikh et al., 2019). Studies have shown that NTM are part of the biofilm microbial community in drinking water at treatment plants (Pinto et al., 2012), at points along distribution systems (September et al., 2004; Haig et al., 2020), and at home taps and showerheads (Feazel et al., 2009; Thomson et al., 2013). Periods of water stagnation allow for NTM proliferation on premise plumbing, which are then released from biofilms on the showerhead or inner faucet into inhalable bioaerosols. Studies have shown that isolates from NTM patients can be clones of isolates from the patient's home tap, suggesting that infection can come from use of home water and inhalation of bioaerosols (Falkinham et al., 2008; Falkinham, 2013; Thomson et al., 2013).
A majority of the studies of NTM in the United States to date focus on water and biofilms from public water supply distribution systems fed from either surface water (Waak et al., 2019b), groundwater (Klanicova et al., 2013), or both (Falkinham et al., 2001), or on premise plumbing in homes that public systems serve (Feazel et al., 2009; Perez-Martinez et al., 2013; Donohue et al., 2015; Haig et al., 2020). However, 15% of the U.S. population, amounting to 43 million people (Johnson et al., 2019), obtain drinking water through domestic private wells. Domestic private well water systems have seldom been included in the NTM drinking water and household plumbing studies, likely due to reports of the absence of NTM in southeastern groundwaters (Martin et al., 1987). When homes using private wells have been included in the studies, geographical differences in the presence of mycobacteria have been revealed, raising questions about the prevalence of these microbes in private well water systems elsewhere (Feazel et al., 2009; Gebert et al., 2018; Xue et al., 2020).
The private well microbiome has received considerably less study than the microbiome of public water supplies. Some researchers have investigated groundwater microbiomes (Smith et al., 2012; Franca et al., 2015; Unno et al., 2015) and known contaminated or salt marsh private wells (Pogoda, 2017; Xue et al., 2020). To the author's knowledge, no studies of private well microbiomes have been performed in NJ where nearly one million people use private wells. Of further interest when studying the microbial ecology of private wells, which in contrast to public supplies are often not disinfected, is the potential for insight into microbial community members that are or are not associated with microbial agents such as pathogenic NTM. This information could inform ecological engineering solutions to treat undesirable microbial agents in drinking water (Wang et al., 2013).
To address these gaps in knowledge about private well drinking water systems, we undertook a field study with the following objectives: to quantify NTM in private well household plumbing biofilms as compared with biofilms in NTM patient homes across NJ and to characterize the microbiome in these systems. To achieve these aims, sampling was performed at the homes of participants recruited from the general public and lung clinics in NJ. Biofilm samples were collected from faucets and showerheads and analyzed for NTM and the total microbiome. Water samples and survey data were collected to understand environmental factors potentially influencing the observations. We tested the hypothesis that biofilms from NTM patient homes with public water supply would have higher relative abundances of NTM than biofilms from homes of the general public with private well water. Additionally, we evaluated the hypothesis that one or multiple environmental factors influence NTM prevalence and abundance in biofilms. Finally, we evaluated the hypothesis that biomarker organisms exist that distinguish between the microbiomes of biofilm samples with and without NTM marker genes, thus serving as potential antagonists or mutualists.
Materials and Methods
Participant recruitment
Participants were recruited from April 2019 to March 2020. Two populations of individuals were recruited: members of the NJ general public who have private drinking water wells and patients with NTM pulmonary disease as diagnosed by pulmonary doctors according to the criteria set forth by the American Thoracic Society/Infectious Disease Society of America (Griffith et al., 2007), and receiving care at the pulmonary medicine clinics in NJ. Members of the general public were recruited using a variety of outreach efforts, including distribution and/or posting of recruitment flyers at local watershed meetings, county extension and local government offices, Rutgers campuses, as well as on social media. Patients from participating pulmonary clinics were informed of the study by their doctors and if interested, were followed up with by our team. In total, 19 members of the general public and 5 NTM patients participated in this study. Note, participant recruitment and sampling efforts were stopped at the onset of the coronavirus disease 2019 (COVID-19) pandemic. Participants completed a survey providing information about their water source, private wells (if applicable), home plumbing and pipe system, and personal habits.
Sampling occurred across the physiographic regions of NJ (Fig. 1). This captured areas of the state that were previously found to have varying degrees of fecal contamination in private well water based on 2002–2014 data represented by the New Jersey Department of Environmental Protection (NJDEP) Geographic Information System (GIS) Private Well Testing Act summary results (Atherholt et al., 2013; NJDEP GIS, 2020).

An IRB protocol was created by the research team and approved by the Rutgers Institutional Review Board (IRB ID Pro2018002559). The protocol included a written protocol, phone script, and an informed consent agreement.
Biofilm collection
Samples collected from each home included two to three biofilm swabs and one water sample (0.5 L). Participants were asked to provide the researchers with access to their most frequently used sinks and showers for sample collection. In total, 70 bulk biofilm samples were collected from participant homes: 56 from members of the general public (19 homes) and 14 from NTM patients (5 homes). Biofilm samples were collected for biomolecular analyses of mycobacteria and the total microbial community. Up to three biofilm samples were collected in each home with sterile cotton swabs from the inner faucets of one kitchen, first-floor bathroom, or alternative sink, one second-floor bathroom sink, and one showerhead. Alternative sinks were either basement or secondary, often less used sinks.
To collect biofilm samples from the sinks, water from the cold tap was run for 10 s and aerators were removed using sterile technique (Angelina and Neches River Authority, 2019). The first six inches of the inside surface of the faucet were swabbed by turning the swab around the faucet for two rotations, and up and down the sides several times to collect as much biofilm as possible. If a sink's aerator could not be removed and there were no alternative sinks, as was the case in 13 of the 24 homes, the outside of the aerator was swabbed, and the situation was noted. To collect bulk biofilm samples from showerheads, the showerheads were removed, and cool water run before swabbing the inside of the pipe, as described above, then the inside of the showerhead itself was swabbed. [Biofilm thickness was not measured but others reported thicknesses in showerhead hoses to range from nondetectable to 0.40 mm (Proctor et al. 2018).] The cotton tips from the swabs were broken off from the wooden stick using ethanol flame-sterilized tweezers. The cotton tips were each stored in a separate sterile 15-mL tubes in coolers on ice until returned to the laboratory for storage at −20°C until DNA extraction. The biofilm field blanks consisted of sterile cotton swabs that were transferred to sterile 15-mL tubes at two participant's homes (one patient and one general public member) and were otherwise processed the same as the home biofilm samples.
Water sample collection and quality analyses
Water quality was analyzed in the field and in the laboratory. After collecting the biofilm samples, the faucet and adjacent area were cleaned using 10% bleach, and the water was run at a cool temperature for at least 2 min using only the cold tap (Angelina and Neches River Authority, 2019). The kitchen sink was used unless the aerator on the faucet was not removable, in which case the water was collected from a first-floor bathroom sink. Water temperature was measured using a standard mercury-free glass thermometer placed under a steady stream of cool water. To measure residual chlorine, a low-range (0.2–2.0 mg/L) Hach pocket colorimeter was used with DPD total chlorine reagent packets (Loveland, CO) according to the manufacturer's instructions.
One water sample (0.5 L) per home was collected in a triple-washed and autoclaved polypropylene Nalgene bottle for water quality and fecal indicator organism analyses. Any residual chlorine in the water sample was quenched with 1% sodium thiosulfate (Allard et al., 2019). Samples were stored in a cooler on ice, as above. The water field blanks consisted of 0.5 L autoclaved deionized water in bottles that were opened at participants' homes during sample collection and otherwise processed the same as the home water samples. Samples were held no more than 3 h in the cooler. Upon returning to the laboratory (∼1 h), conductivity and pH were measured using a calibrated Orion Star A329 multimeter (Thermo Scientific, Waltham, MA). US Environmental Protection Agency (USEPA) Method 1604 (USEPA, 2002) was used to evaluate the presence and concentration of total coliforms (TC) and Escherichia coli in the water samples through plate counts. Two volumes of water (100 and 200 mL) per home were analyzed in efforts to obtain countable plates.
Biomolecular analyses for mycobacteria and microbial community
DNA was extracted from biofilm swabs using a slightly modified phenol–chloroform method PC2 published in 2018 by Haig et al. (2018) (S1). This method was selected because it was demonstrated to extract DNA more efficiently from a wide range of cells, extracting three times more total DNA and eight times more mycobacterial DNA, on average, than commercial DNA extraction kits. Briefly, cells were lysed with an increased sodium chloride buffer concentration to reduce polysaccharide extraction (Fang et al., 1992). Then, proteins and lipids were density separated from DNA, and DNA extracts were precipitated (Haig et al., 2018). Precipitates were washed with two ethanol wash cycles (Fang et al., 1992).
Quantitative polymerase chain reaction (qPCR) was performed for the 16S rRNA gene and three mycobacterial targets. DNA extracts were diluted in molecular biology-grade water (1:10 to 1:100, v/v) to reduce the concentration of PCR inhibitors. The V3 region of the 16S rRNA gene amplified with universal primers was used as a surrogate for the total bacterial population (Muyzer et al., 1993). Mycobacterial targets included were a 16S rRNA genetic marker for M. avium (Wang et al., 2012), a Mycobacterium spp. 16S rRNA genetic marker (hereafter myco16S) (Radomski et al., 2010), and a mycobacteria functional genetic marker, atpE, which encodes for the ATP synthase protein subunit C (Radomski et al., 2013). Mycobacteria carry one to two 16S rRNA gene copies (Bercovier et al., 1986), targeted by the myco16S gene, and one copy of the atpE gene (Radomski et al., 2013). For this reason, both genes were measured in all samples, and the results were compared. Excluding M. avium, a major species responsible for NTM infections, the mycobacteria genetic markers included in this study are specific to all Mycobacterium spp., not just NTM. However, with the exception of one study of a wildlife watering hole, Mycobacterium tuberculosis has not been found in water environments outside of a host (Kazda et al., 2010; Barasona et al., 2017). Therefore, general mycobacteria genetic markers likely effectively represent markers for NTM in this environment.
qPCR assays for the V3 variable regions of the 16S rRNA gene and the M. avium 16S rRNA gene fragment included 5 μL of SsoFast™ EvaGreenR Supermix (Bio-Rad, Hercules, CA), 0.40 μM forward and reverse primers, 2.4 μL molecular biology-grade water, and 1 μL of diluted DNA extract. Assays for myco16S and atpE reactions included 5 μL of SsoAdvanced™ Universal Probes Supermix (Bio-Rad), 0.65 μM forward and reverse primers, 0.2 μM probe, 1 μL molecular biology-grade water, and 1 μL of diluted DNA extract. All qPCRs had a total volume of 10 μL per well and were run in triplicate on a Real-Time Thermocycler (Bio-Rad CFX96 Touch, Hercules, CA) on 96-well plates. All plates were calibrated with a seven-point calibration curve with concentrations ranging from 102 to 108 gene copies per well. Standards were generated for each primer set with PCR products obtained from either culture streaks of M. avium strain ATCC 35717 or from environmental samples and confirmed with Sanger Sequencing (GeneWiz, Piscataway, NJ, available in GenBank under Accession Number MW600431). Briefly, PCR products were cloned with a TOPO TA Cloning Kit (Invitrogen, Carlsbad, CA) according to the manufacturer's instructions and quantified according to Pei et al. (2006). A no-template control was included in triplicate on each plate. The average R2, run efficiencies, and percent recoveries are provided along with thermocycler conditions and amplicon lengths in Supplementary Table S1. Amplification specificity was monitored by melt curve analysis for EvaGreen reactions and amplicon lengths were confirmed by gel electrophoresis for select products from all reactions. Gene copies are reported as log10(x + 1) gene copies per swab. The limit of detection (LOD) was determined as the upper limit of the 95% confidence interval established following the procedure from Armbruster and Pry (2008).
For quality assurance and control of the biomolecular methods, blanks and matrix spikes were employed. First, to evaluate contamination throughout the extraction process, a total of four DNA extraction process blanks were performed. These blanks consisted of sterile cotton swabs dipped in molecular biology-grade water. Extracts from these swabs were then tested for contamination by qPCR for the presence of target genes and quantities of 16S rRNA gene copies. Matrix spikes were performed with isolates of M. avium as the matrix spike. Briefly, M. avium colonies were scraped and boiled in 10 μL water to elute the DNA. Eluted DNA was then diluted in water 1:50, and 10 μL of the diluted DNA were spiked into two test swabs, one with molecular biology-grade water, and one with biofilm from a laboratory faucet. A replicate swab from the laboratory faucet served as a biofilm control that was not spiked with M. avium. qPCR on the resulting extracts targeting M. avium showed that similar amounts of M. avium were extracted from both the spiked sterile water sample and the spiked sink biofilm sample (4.80 log copies and 4.44 log copies, respectively, relative percent difference on log scale of 7.8%), whereas the negative control sample had no detectable M. avium.
To investigate prokaryotic diversity of the biofilm samples, Illumina MiSeq amplicon sequencing (300 bp, paired end) was performed on a subset of samples targeting the V3–V4 region of the 16S rRNA gene at a commercial laboratory (MR DNA, Shallowater, TX). A total of 61 samples comprising 11 duplicate sets and 13 triplicate sets (i.e., samples from different locations in the same home) were sent for sequencing analysis. The subsample set was chosen to provide a range of pipe materials, physiography, and mycobacteria detections (Supplementary Table S2). Sequences were processed in Qiime2-2019.10 on the Rutgers Office of Advanced Research Computing (OARC) Amarel computer cluster following a protocol established from the Qiime2 “Atacama soil microbiome” tutorial (Bolyen et al., 2019) and a pipeline published in 2019 (Payne et al., 2019). Briefly, sequences were demultiplexed, trimmed, and processed through the DADA2 package which filtered, denoised, and removed chimeras (Callahan et al. 2016). Taxonomy was assigned using Silva 132 reference taxonomy alignment with the 99% taxonomy set and classified with the Naive Bayes Classifier clustered at 97% similarity. A rarefaction subsampling depth of 22,000 sequences per sample was selected, which included 29 samples (see Supplementary Table S3 for details). Notably, all of the showerhead samples sequenced returned less than 100 raw sequences each and thus were not included in downstream analyses. These showerhead samples comprised 72% of the 32 samples excluded from the rarefied analyses. With these samples excluded, the sequences analyzed comprised 9 sets of duplicates (18 samples, 2 per home) and 11 samples from individual homes. As seen in the alpha rarefaction curve (Supplementary Fig. S1), the rarefaction subsampling depth of n = 22,000 was sufficiently deep to capture the diversity.
Statistical analyses
All statistical analyses were performed in R version 4.0.0 (www.rproject.org). Data normality was assessed using the Shapiro–Wilk test. Differences in water quality across physiographic regions and water supplies were evaluated using pairwise nonparametric permutational multivariate analysis of variance (pairwise PERMANOVA) tests with a Bonferroni P-adjustment for multiple comparisons through PairwiseAdonis version 0.3 (Martinez Arbizu, 2020). Differences in marker gene quantities between private well and public supply samples were evaluated with a nonparametric Kruskal–Wallis test followed by a Wilcoxon rank sum test. Due to a high percentage of samples (e.g., 75% for atpE) having quantities of marker genes below the LOD or limit of quantitation (LOQ), application of methods for left-censored data were necessary. For the quantitative analysis, values below the LOD were substituted with LOD/
To evaluate the importance of the variables studied on the total 16S rRNA gene copies and relative concentrations of myco16S genetic markers, Random Forest (RF) models were developed using the randomForest R Package version 4.6.14. (Liaw and Wiener, 2002). This ensemble machine learning algorithm is driven by decision trees, is nonparametric, and has many strengths, including the ability to analyze both categorical and continuous variables, manage missing data, and analyze small datasets with many predictors (Breiman, 2001; Breiman, 2002; Ali et al., 2012; Biau and Scornet, 2016; Luan et al., 2020). RF uses bootstrapping to grow unpruned decision trees to train the model, and “out of bag” data (∼1/3 of all data) are used to calculate error, eliminating the need for a separate training and test set (Breiman, 2001; Liaw and Weiner, 2002). Following the guidance of Mendez and Lohr (2011), the regression models were calculated and adjusted by removing variables that produced a negative percent increase in mean square error (%IncMSE) until all %IncMSE values were positive (Mendez and Lohr, 2011). Because RF models may underestimate variable importance with co-correlated variables (Biau and Scornet, 2016; Gregorutti et al., 2017), one variable from each pair of predictors that had a Spearman's rho coefficient >0.50 was used per model. To better understand the variation in factors included in the optimized RF models, pairwise PERMANOVA analyses were subsequently performed on these variables using PairwiseAdonis version 0.3 (Martinez Arbizu, 2020).
Alpha and beta diversity of amplicon sequences were analyzed at the family level subsampled at n = 22,000 sequences per sample. Alpha diversity indices calculated included species richness, Shannon's H’, and Shannon's evenness. Indices were compared between private well and public supply samples using a Wilcoxon rank sum test. The relative importance of potential explanatory factors (i.e., survey data and water quality) to the observed variation of alpha indices was evaluated using RF models using the same methodology explained above. For beta diversity, a Bray–Curtis Dissimilarity Matrix was calculated using the “vegan” R package version 2-5.6 (Oksanen et al. 2019) with log10(x + 1) transformed sequence data. Differences in the community structure as a function of potential explanatory variables were evaluated using the same pairwise PERMANOVA tests described for water quality comparisons above using PairwiseAdonis version 0.3 (Martinez Arbizu, 2020). Nonmetric multidimensional scaling (nMDS) plots were generated using the same Bray–Curtis Dissimilarity Matrix in the “ggplot2” package in R to view potential clusters (Wickham, 2016).
Linear discriminant analysis (LDA) effect size (LEfSe) tests were conducted using the method published by Segata et al. (2011) with default parameters to identify potential prokaryotic biomarkers that distinguish between the microbiomes of samples from different categories. While LEfSe is traditionally used to identify biomarkers of descriptive or treatment-type groupings, in this study, the technique was used to identify potential biomarkers that could inform antagonist or mutualist relationships with NTM by grouping samples by those with and without detection of myco16S (Puzon et al., 2017). Additionally, the method was used in its more typical manner to assess for potential biomarkers between samples from homes with private well water compared with samples from homes with public water supply. These categories were chosen because previous studies have found differences in microbial communities to be most related to water treatment or water source (Wang et al., 2013; Ji et al., 2015). Amplicon sequences are available in the NCBI SRA database (https://www.ncbi.nlm.nih.gov) under Accession Numbers SRR13214198.
Results and Discussion
Water quality
Water quality and survey data were collected to evaluate potential relationships with the microbial communities studied. Private well water pH and conductivity were found to vary across NJ's physiographic regions (Table 1). In the Coastal Plain, pH was significantly higher (p = 0.01, pairwise PERMANOVA) compared with the Piedmont and Highland regions. pH in the public water supply was higher than in the Piedmont region (p = 0.04, pairwise PERMANOVA) and similar to pH in well water from other regions. Note, given that only one home in the Valley and Ridge region was sampled, robust comparisons for that region are not possible. The pHs observed fell within or near to the recommended pH range (6.5–8.5) for public water supplies (NJ Administrative Code § 7:10-7.2.). Conductivity in the Coastal Plain was significantly lower than in the Piedmont and Highland regions (p = 0.01, pairwise PERMANOVA). The NTM patient home public supply water had similar conductivity to the Piedmont and Highland regions (p > 0.77, pairwise PERMANOVA) and higher conductivity than the Coastal Plain (p = 0.01, pairwise PERMANOVA). These differences for the well water are not surprising given that groundwater chemistry is a function of the minerals, soil types, and bedrocks it flows through in the different physiographic regions (Serfes, 2004). As expected, higher residual chlorine was observed in the public supply than in private well water from all regions (all p = 0.01, pairwise PERMANOVA), which were similar to one another (p > 0.55, pairwise PERMANOVA). Residual chlorine measurements in public supply samples were, on average, 35 times higher than those of private well water samples, but all measurements were below the Maximum Residual Disinfectant Level Goal of 4 mg/L as Cl2 (USEPA, 2020).
Water Quality Results for Private Well Water Samples by Physiography and Public Water Supply Samples
n = the number of water samples taken per region/water supply. One water sample was taken per home. Average values for water quality parameters are reported ± standard deviation.
Cultivable fecal indicators were rarely observed in the well water samples. TC (1–10 CFU/100 mL) were observed in three well water samples (n = 3/20, 15%) and E. coli colonies (EC, between 2 and 7 CFU/100 mL) were observed in two of these samples (n = 2/20, 10%). Participants were informed of these results and directed to NJDEP guidelines suggesting retesting of well water with fecal indicators and mitigation based upon those results. Fecal indicators were not observed in any samples from the public supply (n = 4). Data collected for the NJ Private Well Testing Act indicated between 0% and 20% of private wells tested in 2-mile by 2-mile testing grids were positive for fecal coliforms between 2002 and 2014 (NJDEP GIS, 2020). In those data, fecal contamination was least frequent in the Coastal Plain region (Atherholt et al., 2013; NJDEP GIS, 2020), consistent with our results where fecal indicators were not observed in wells from this region. Similarly, results of a Virginia-based study indicated that prevalence of TC and EC was lowest in private well water samples from the Coastal Plain and higher in the Blue Ridge–Piedmont and Valley and Ridge regions (Pieper et al., 2016).
Survey results
Participants answered questions about their home plumbing systems, including treatment systems and pipe materials (Supplementary Table S2). Most homes with private wells (n = 17/20, 85%) used a treatment system, with many homes combining multiple treatment systems (information on treatment system age and maintenance was not gathered). Several homes used a water softener (n = 4), an in-line filter (n = 3), or both (n = 7). Three homes with private wells had UV disinfection systems and one used chlorine to disinfect. Of the four patient homes connected to public water supplies, two received chlorinated surface water, one chloraminated surface water, and one chloraminated groundwater, each from a different treatment plant. All participants but 1 reported their home pipe materials: 13 had copper pipes (54%), 7 had mixed copper and PVC (29%), 2 had only PVC (9%), and 1 had mixed PVC and PEX (4%).
Information specific to private wells was also collected, including well age and construction method. The private wells sampled had a wide range of ages, with the average being 43 ± 20 years. Most participants did not know the method of their well's construction nor its depth (n = 14, 13, respectively). For those who did know, their wells were drilled (n = 5) or bored (n = 1), and the average well depth was 188 ± 100 ft. A majority of the homes with private wells also had septic tanks (n = 16/20).
The ability of the homeowners to answer questions related to knowledge of basic well maintenance and conditions varied. With regard to water quality testing, 12 participants had testing in the last 5 years, 5 had testing before that, and 2 participants never had it tested. Regarding maintenance, 13 participants had some form of maintenance performed in the last 10 years, 1 had maintenance performed before that, and 6 participants did not know when the last maintenance had occurred. For factors known to be potentially related to contamination, most participants reported that their wellheads were visible aboveground (n = 16/20), and four reported that the soil around that visible wellhead was raised. One participant reported knowledge about a crack in the casing of their well, while the remaining participants either reported no cracks or that they did not know. As a previous study of private well water noted, a lack of knowledge by private well homeowners about their well characteristics is not uncommon (Pieper et al., 2016).
qPCR for mycobacteria and total bacterial community
qPCR was performed on all biofilm samples to measure NTM marker genes per swab and their relative abundances (i.e., gene copies/16S rRNA gene copies). Of the 70 biofilm samples analyzed, 42 were positive for a myco16S (60%), of which 21 were above the LOQ (29%). Nineteen of the 70 samples were positive for the atpE gene (27%), of which 16 were above the LOQ (23%). Concentrations of the myco16S gene moderately correlated with those of the atpE gene (Spearman's rho = 0.42, p = 2.6 × 10⁻⁴), and the 16S rRNA gene (Spearman's rho = 0.59, p = 7.2 × 10⁻⁸). For the private well biofilm samples (n = 59), myco16S was detected in 58% and atpE in 30% (Table 2). For the public supply biofilm samples (n = 11), 64% were positive for myco16S and 9% for the atpE gene. Half of NTM pulmonary patient biofilm swabs (n = 14, majority public supply), were positive for myco16S, and one was positive for atpE (Table 3). These results are similar to a recent study investigating Louisiana private well water using qPCR, which found mycobacteria in 68% of samples (Xue et al. 2020).
Nontuberculous Mycobacteria Marker Gene Presence/Absence, Kaplan–Meier Quantitation Estimates, and Log-Relative Abundances for Samples with Quantities Above the Limit of Quantitation for Private Well Samples Across Physiographic Regions in New Jersey
K-M average estimates are reported as average [lower limit, upper limit] of the 95% CI. Average relative abundance values are reported ± standard deviation.
Positive defined as concentration >LOD.
K-M estimated quantities are included for groups with ≥2 quantifiable samples, or the minimum required to produce an estimated average with a CI.
Only quantifiable samples are reported; if listed without “ ± ,” one sample was quantifiable.
Patient private well samples (n = 3) are included under the Piedmont region.
CI, confidence interval; K-M, Kaplan–Meier; LOD, limit of detection.
Nontuberculous Mycobacteria Marker Gene Presence/Absence, Kaplan–Meier Quantitation Estimates, and Log-Relative Abundances for Samples with Quantities Above the Limit of Quantitation by Water Supply for Nontuberculous Mycobacteria Pulmonary Patients in New Jersey
K-M average estimates are reported as average [lower limit, upper limit] of the 95% CI. Average relative abundance values are reported ± standard deviation.
Positive defined as concentration > LOD.
K-M estimated quantities are included for groups with ≥2 quantifiable samples, or the minimum required to produce an estimated average with a CI.
Only quantifiable samples are reported; if listed without “ ± ,” one sample was quantifiable.
Private well patient samples are also included in Table 3 in the Piedmont region.
LOQ, limit of quantitation.
M. avium was not detected in any samples from our study. Matrix spikes performed with M. avium resulted in 98.3% ± 3.1% recovery, suggesting that inhibition was likely not the cause of this nondetection. One study of NTM in unchlorinated drinking water in the Netherlands and another study in the United States of drinking water and biofilms, disinfected and not, similarly did not observe M. avium when using qPCR targeting M. avium (van der Wielen and van der Kooij, 2013; Waak et al., 2019b). Likewise, another study investigating mycobacteria in showerhead microbiomes in the United States did not detect M. avium by qPCR in four homes with private wells nor mycobacteria (Feazel et al., 2009), the latter in contrast to our findings. While an exact connection between NTM patient home samples and NTM disease was beyond the scope of this study, the lack of M. avium in this study's samples indicates that M. avium in home biofilms may not be the source of their infections. This could imply that other mycobacteria species, such as M. abscessus or M. kansasii (Thomson et al., 2020), are responsible for infection and subsequent disease, or that disease was obtained from a different transmission route, such as by inhalation of contaminated household dust (De Groote and Huitt, 2006).
For samples with atpE or myco16S above the LOQ, the average log-relative abundance (relative to 16S rRNA gene copies) was calculated. By this method, only myco16S log-relative abundances could be compared across physiography (Coastal Plain and Piedmont, Table 2) and water supply. The average log-relative abundance was highest in the Coastal Plain and lowest in the public supply biofilm samples, corresponding to the majority of patient home samples (n = 11/14), although differences were not statistically significant (p = 0.11, Kruskal–Wallis). The Piedmont region had the most biofilm samples with marker gene abundances above the LOQ (Supplementary Fig. S2). For both NTM marker genes, the abundance ranged from below detection to approximately seven log gene copies per swab. A recent study of NTM in municipal, surface water-sourced drinking water and associated biofilms found similar quantities of the atpE gene in biofilm samples, ranging from below quantitation to 106 copies per cm2 (Waak et al., 2019b), which translates to approximately half the area of one swab in this study. Although the marker gene concentrations are similar between this study and that by Waak et al. (2019b), differences could be explained by differences in biofilm sampling techniques for which no common best practice exists (Wang et al., 2017). Unlike the findings of previous studies (Feazel et al., 2009; Gebert et al., 2018), our study does not show a higher abundance of mycobacteria in public supply biofilms than in those from private wells (p > 0.16, Kruskal–Wallis), potentially as a result of the relatively few public supply samples included in this study.
Of the 24 homes sampled, half had at least one sample that was positive for atpE and all had at least one sample that was positive for myco16S. For patient homes specifically, only one home was positive for atpE, and four out of five were positive for myco16S. These results indicate that mycobacteria are present in most homes, and that the myco16S gene was more sensitive than the atpE gene for mycobacteria detection. This could be because there are more (one or two) 16S rRNA gene copies per mycobacterial cell than there are atpE gene copies (one) (Bercovier et al., 1986). This could also be in part because the atpE gene had a higher LOD.
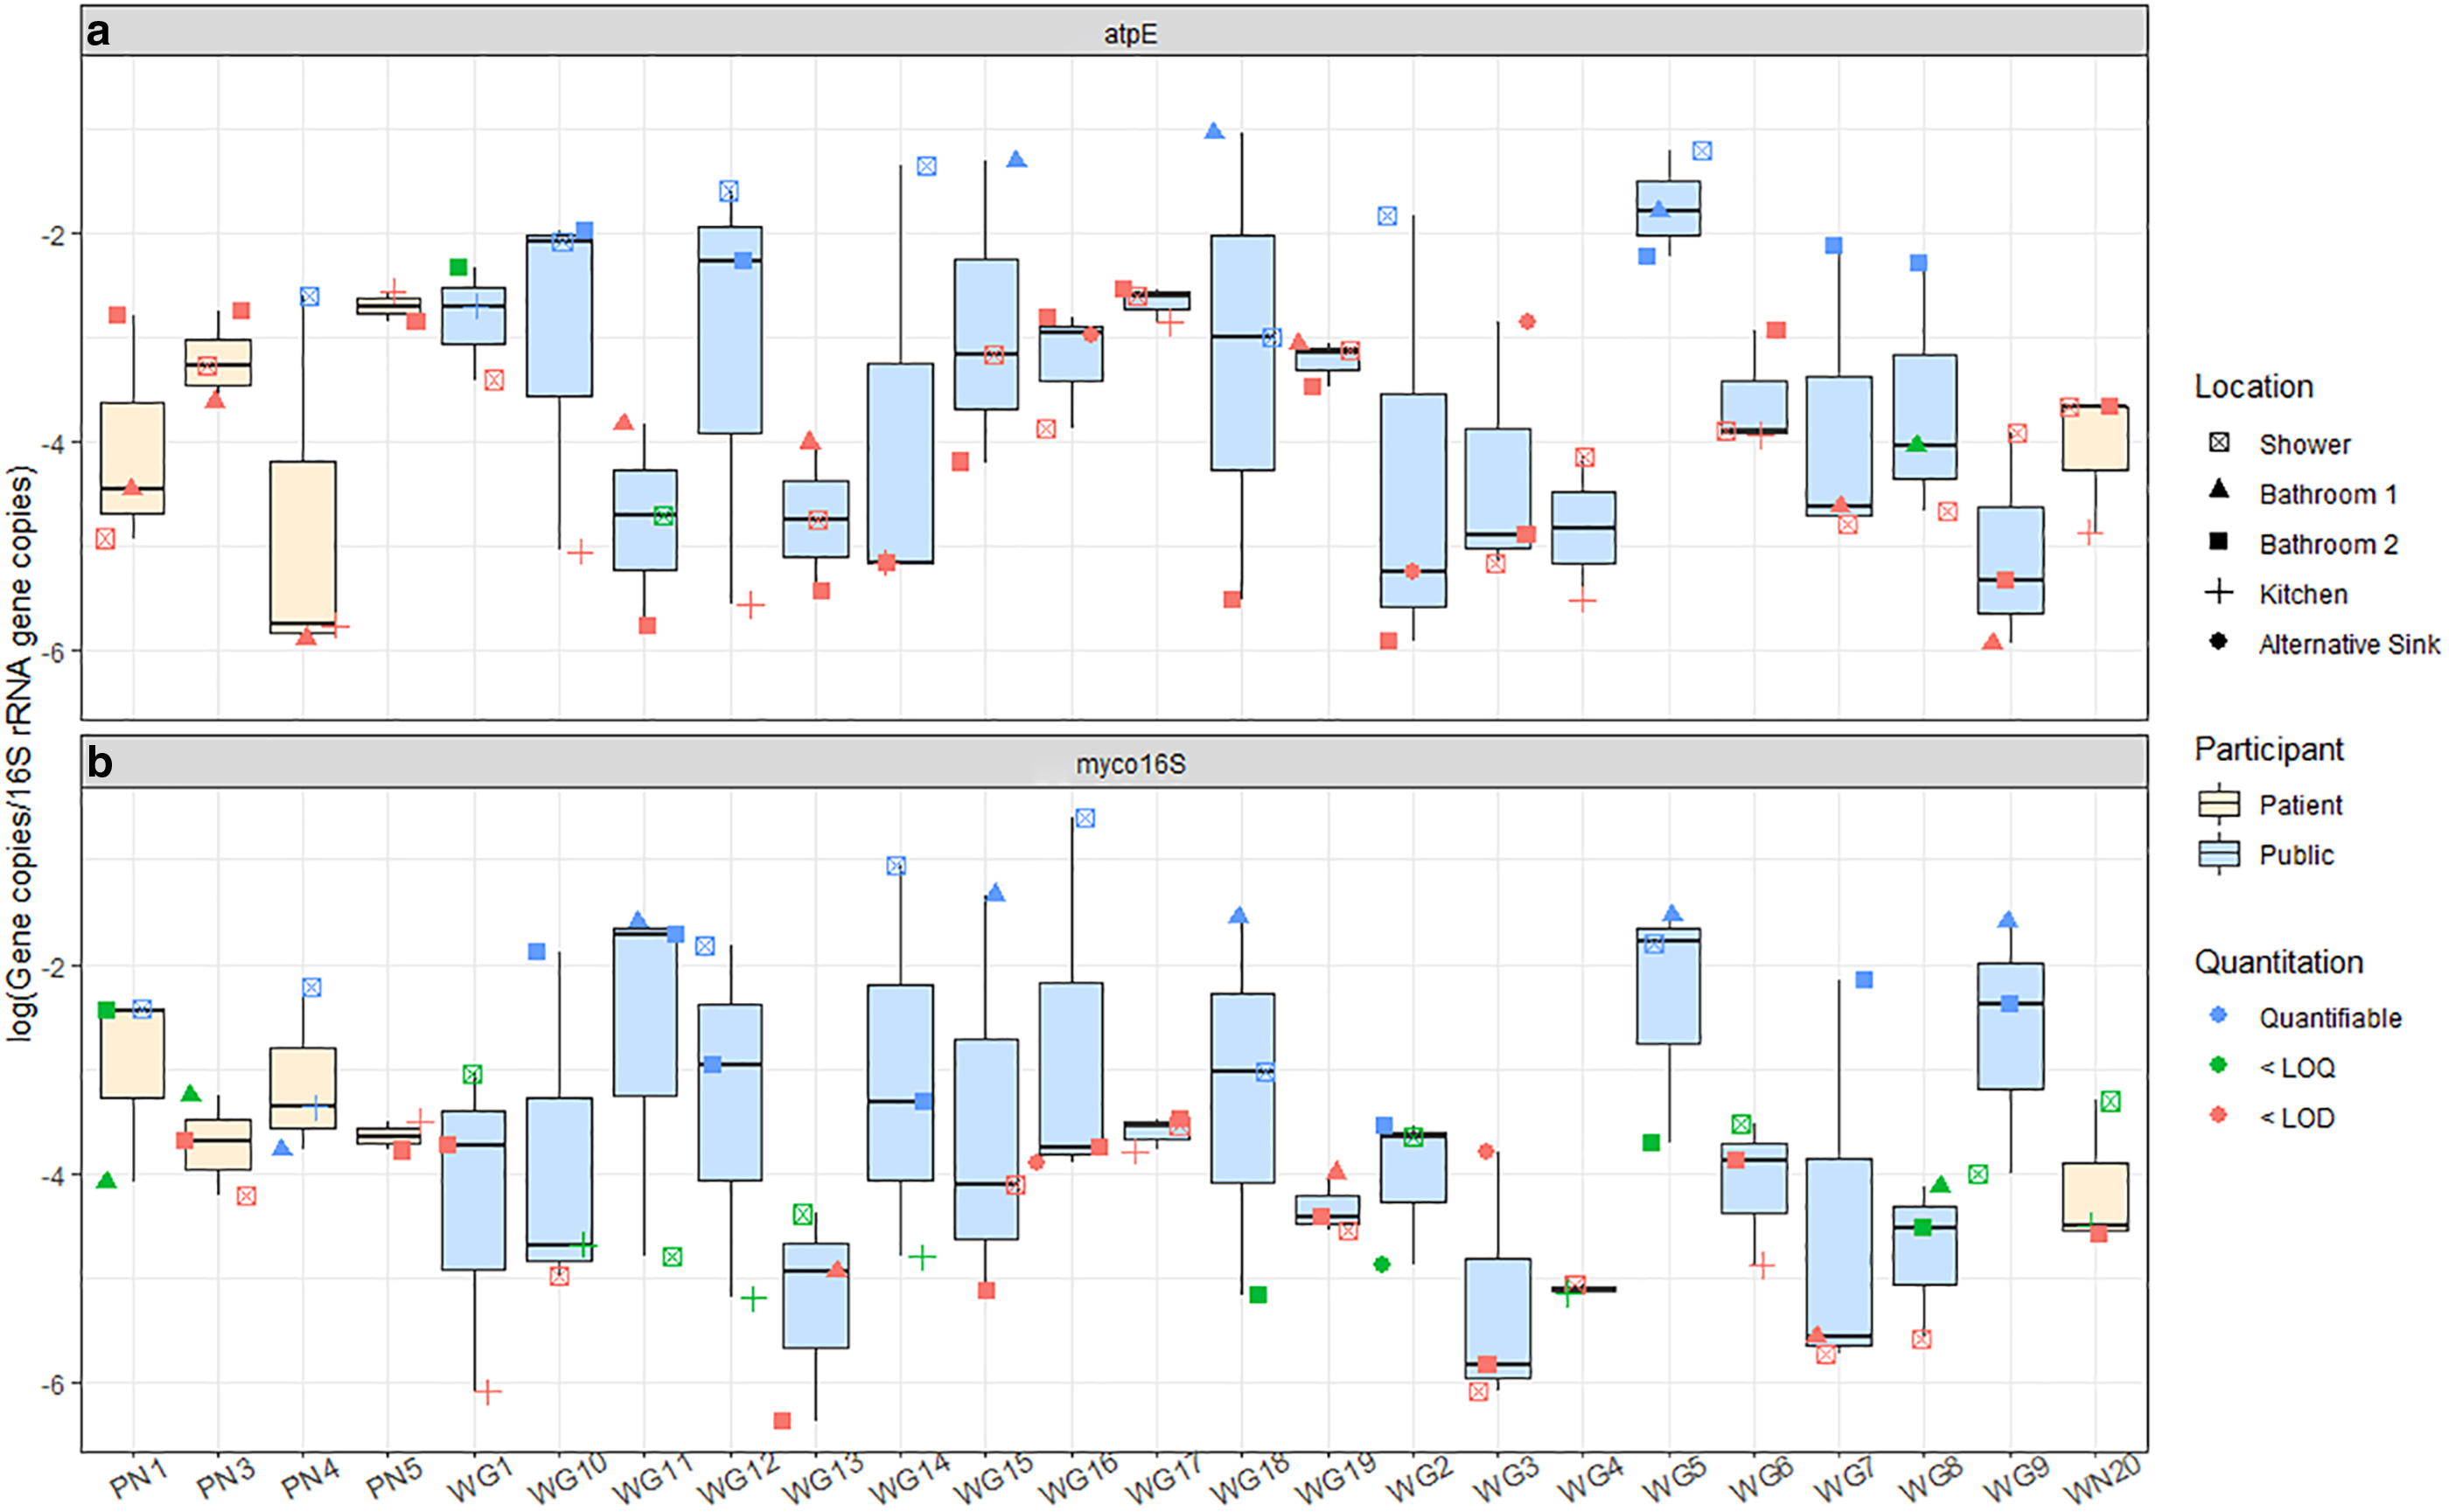
Biofilm samples from the same home did not necessarily have similar relative abundances of the target genes. For example, the variance of the log-relative abundance for atpE within one home ranged from 0.03 to 5.0 (average 1.7 ± 1.7-log) and for myco16S ranged from 2.4 × 10⁻³ to 4.1 (average 1.7 ± 1.4-log). The location within the home with the highest relative abundance was not consistent: showerheads had the highest relative abundances of atpE in 7/24 homes and myco16S in 10/24 homes. Among sinks, second-floor bathroom sinks more frequently had the highest relative abundance of atpE, whereas the same was true of first-floor bathroom sinks for myco16S (Fig. 2). A previous culture-based study suggested that different mycobacterial species tend to colonize biofilms in some home locations, such as kitchen sinks and showerheads, more frequently than others (Honda et al., 2016). A species-level analysis of our data was not possible with the techniques applied in this study.
NTM marker gene relative abundances for
No significant differences were observed between the private and public supply biofilm 16S rRNA gene concentrations (p = 0.20, Wilcoxon). The quantities observed in this study are similar to or slightly higher than those reported in another study of surface water-sourced drinking water biofilm samples in water distribution systems (Waak et al., 2019b). Three biofilm samples from two homes had quantities of 16S rRNA gene copies below the LOD. NTM marker genes were also not identified in these samples, indicating that low biomass may have caused the nondetection in these samples.
RF regression
RF regressions were performed to understand the importance of potential explanatory variables to the relative abundances of NTM marker gene myco16S and 16S rRNA gene copies in private well biofilm samples. The RF regression calculated for the log-relative abundance of myco16S genes was optimized to explain 21% of the variation observed with three predictor variables: physiographic region, within-home location, and the presence of raised soil around the wellhead (Supplementary Fig. S3a). Others have found geography to relate to mycobacteria abundance (Gebert et al., 2018) and soil type to relate to NTM disease risk (Lipner et al., 2017). The high relative importance of within-home location may indicate that the environment of the faucet, such as humidity, which one might expect to be higher in bathrooms than in kitchens, may influence the relative abundance of mycobacteria. Previous work that has found correlations between humidity and culturable mycobacteria abundance supports this idea (Kirschner et al., 1992). The final variable in the model, the presence of soil around the wellhead, appears to be driven by a higher relative abundance of myco16S genes in samples from wells with soil around the wellhead as compared with samples from participants who did not know the answer to this question. Therefore, this variable, although useful for the model's predictive capabilities, cannot be meaningfully interpreted. For atpE, RF models were not developed, as more than 75% of private well biofilm samples had concentrations below the LOQ, to prevent potential bias from the abundance of substituted/censored data (Antweiler and Taylor, 2008). Likewise, due to the low number of public supply biofilm samples collected (n = 11), and the even lower number that had concentrations of the target genes above the LOQ, RF models were not developed for these systems. Previous work regarding the factors that influence mycobacterial abundances in public drinking water biofilms have shown that disinfectant type and residual concentration (Gomez-Smith et al., 2015; Waak et al., 2019a; 2019b; Wang et al., 2012), flow velocity (Douterelo et al., 2017), water age and pipe material, as well as interactions between these factors (Wang et al., 2014), can influence observed quantities.
Using 16S rRNA gene copies collected per swab as a surrogate for total bacterial population, 27% of the variation in total bacterial abundance in private well biofilms was explained by two predictor variables: pipe material and physiography (Supplementary Fig. S3b). Interestingly, biofilms from homes that used copper pipes had significantly higher concentrations of 16S rRNA gene copies than biofilms from homes using PVC (p = 0.04, pairwise PERMANOVA). This could be due to higher surface area in the copper pipe systems as a result of corrosion, which PVC pipes are not subject to (Wang et al., 2014). Previous work also found that pipe materials significantly influenced the amount of 16S rRNA gene copies in drinking water biofilms (Wang et al., 2014). Physiography may influence the abundance of 16S rRNA gene copies for similar reasons as for mycobacteria. The geophysical properties of the soil that water flows through may facilitate different levels of filtration and adsorption, therefore influencing the concentrations of 16S rRNA genes present in the water and subsequently in the biofilms (Lipner et al., 2017).
Biofilm microbiome
Mycobacteriaceae, the microbial family containing only the genus Mycobacterium, were observed in the amplicon sequencing results for 29 biofilm samples from 20 homes in concentrations ranging 0.14–50.6% of the microbiome (log-relative abundance: −2.85 to 0.30) (Table 4). When sequencing was performed on two biofilm samples from the same home, the relative percent difference of log-relative Mycobacteriaceae abundances from different locations [100 × |Sample 1 – Sample 2|/(Average of Sample 1 and Sample 2)] was between 1.81% and 141%, similar to that of qPCR, which for the same samples was 2.23–104%. Similar to the results of qPCR, the location with the highest log-relative abundance of Mycobacteriaceae observations within a home was inconsistent: upstairs bathroom sink was greatest for 5/9 homes, downstairs bathroom sink for 2/9 homes, and kitchen sink for the other 2/9 homes. As with qPCR, log-relative abundance of Mycobacteriaceae was highest in the Coastal Plain region, although the difference was not statistically significant (p = 0.80, Kruskal-Wallis).
Mycobacteriaceae Sequences for 29 Samples by Physiography and Water Supply
Values reported as average ± standard deviation. Mycobacteriaceae sequences were observed in every sample for which sequences were analyzed.
Includes two NTM pulmonary patient samples.
NTM pulmonary patient samples.
GW, groundwater sourced; NTM, nontuberculous mycobacteria; SW, surface water sourced.
The log-relative abundance of myco16S was moderately correlated with log10-transformed relative abundance of Mycobacteriaceae observations in sequenced samples (Spearman's rho = 0.60, p = 8.1 × 10⁻⁴, Supplementary Table S4). There are over 190 species of Mycobacterium (Parte, 2014), and the myco16S primers used in this study have only been tested with 30 of the species and found to have 77% sensitivity and 100% specificity (Radomski et al., 2010), whereas the atpE gene has been tested for sensitivity and specificity (100% for both) with 31 of these species (Radomski et al., 2013). Thus, species not targeted by the primers but identified in amplicon sequences may account for some of the differences observed between these results.
In terms of the microbiome composition, Mycobacteriaceae was one of the top three most abundant families in six private well biofilm samples and one public supply biofilm sample, comprising an average of 8.6% ± 17% of the private well and 3.3% ± 6.8% of public supply biofilm sample observations (Fig. 3). Although species-level short-read Operational Taxonomic Unit (OTU) classifications should be interpreted cautiously, 49% ± 25% of observations were further classified (using Silva 132 reference taxonomy) as belonging to the species Mycobacterium gordonae, a ubiquitous saprophytic species that has exhibited human pathogenicity with increasing frequency in recent years (Mazumder et al., 2010; Utsugi et al., 2015; Zlojtro et al., 2015). Other studies using a combination of culture and biomolecular techniques have similarly found M. gordonae to be the most prevalent NTM species in groundwater-sourced drinking water and biofilm samples from community water supplies (Covert et al., 1999; Perez-Martinez et al., 2013; September et al., 2004). Additionally, a few observations each were further classified as M. abscessus and M. xenopi, both of which are known human pathogens (Wallace et al., 1998). Previous research of a surface water-sourced, chloraminated distribution system similarly found M. abscessus and M. xenopi as a small percentage of observations in drinking water biofilm samples (Gomez-Smith et al., 2015). Again, these species-level observations are reported to provide suggestions for potential targets in future studies involving private well biofilms and require confirmation with other methods.
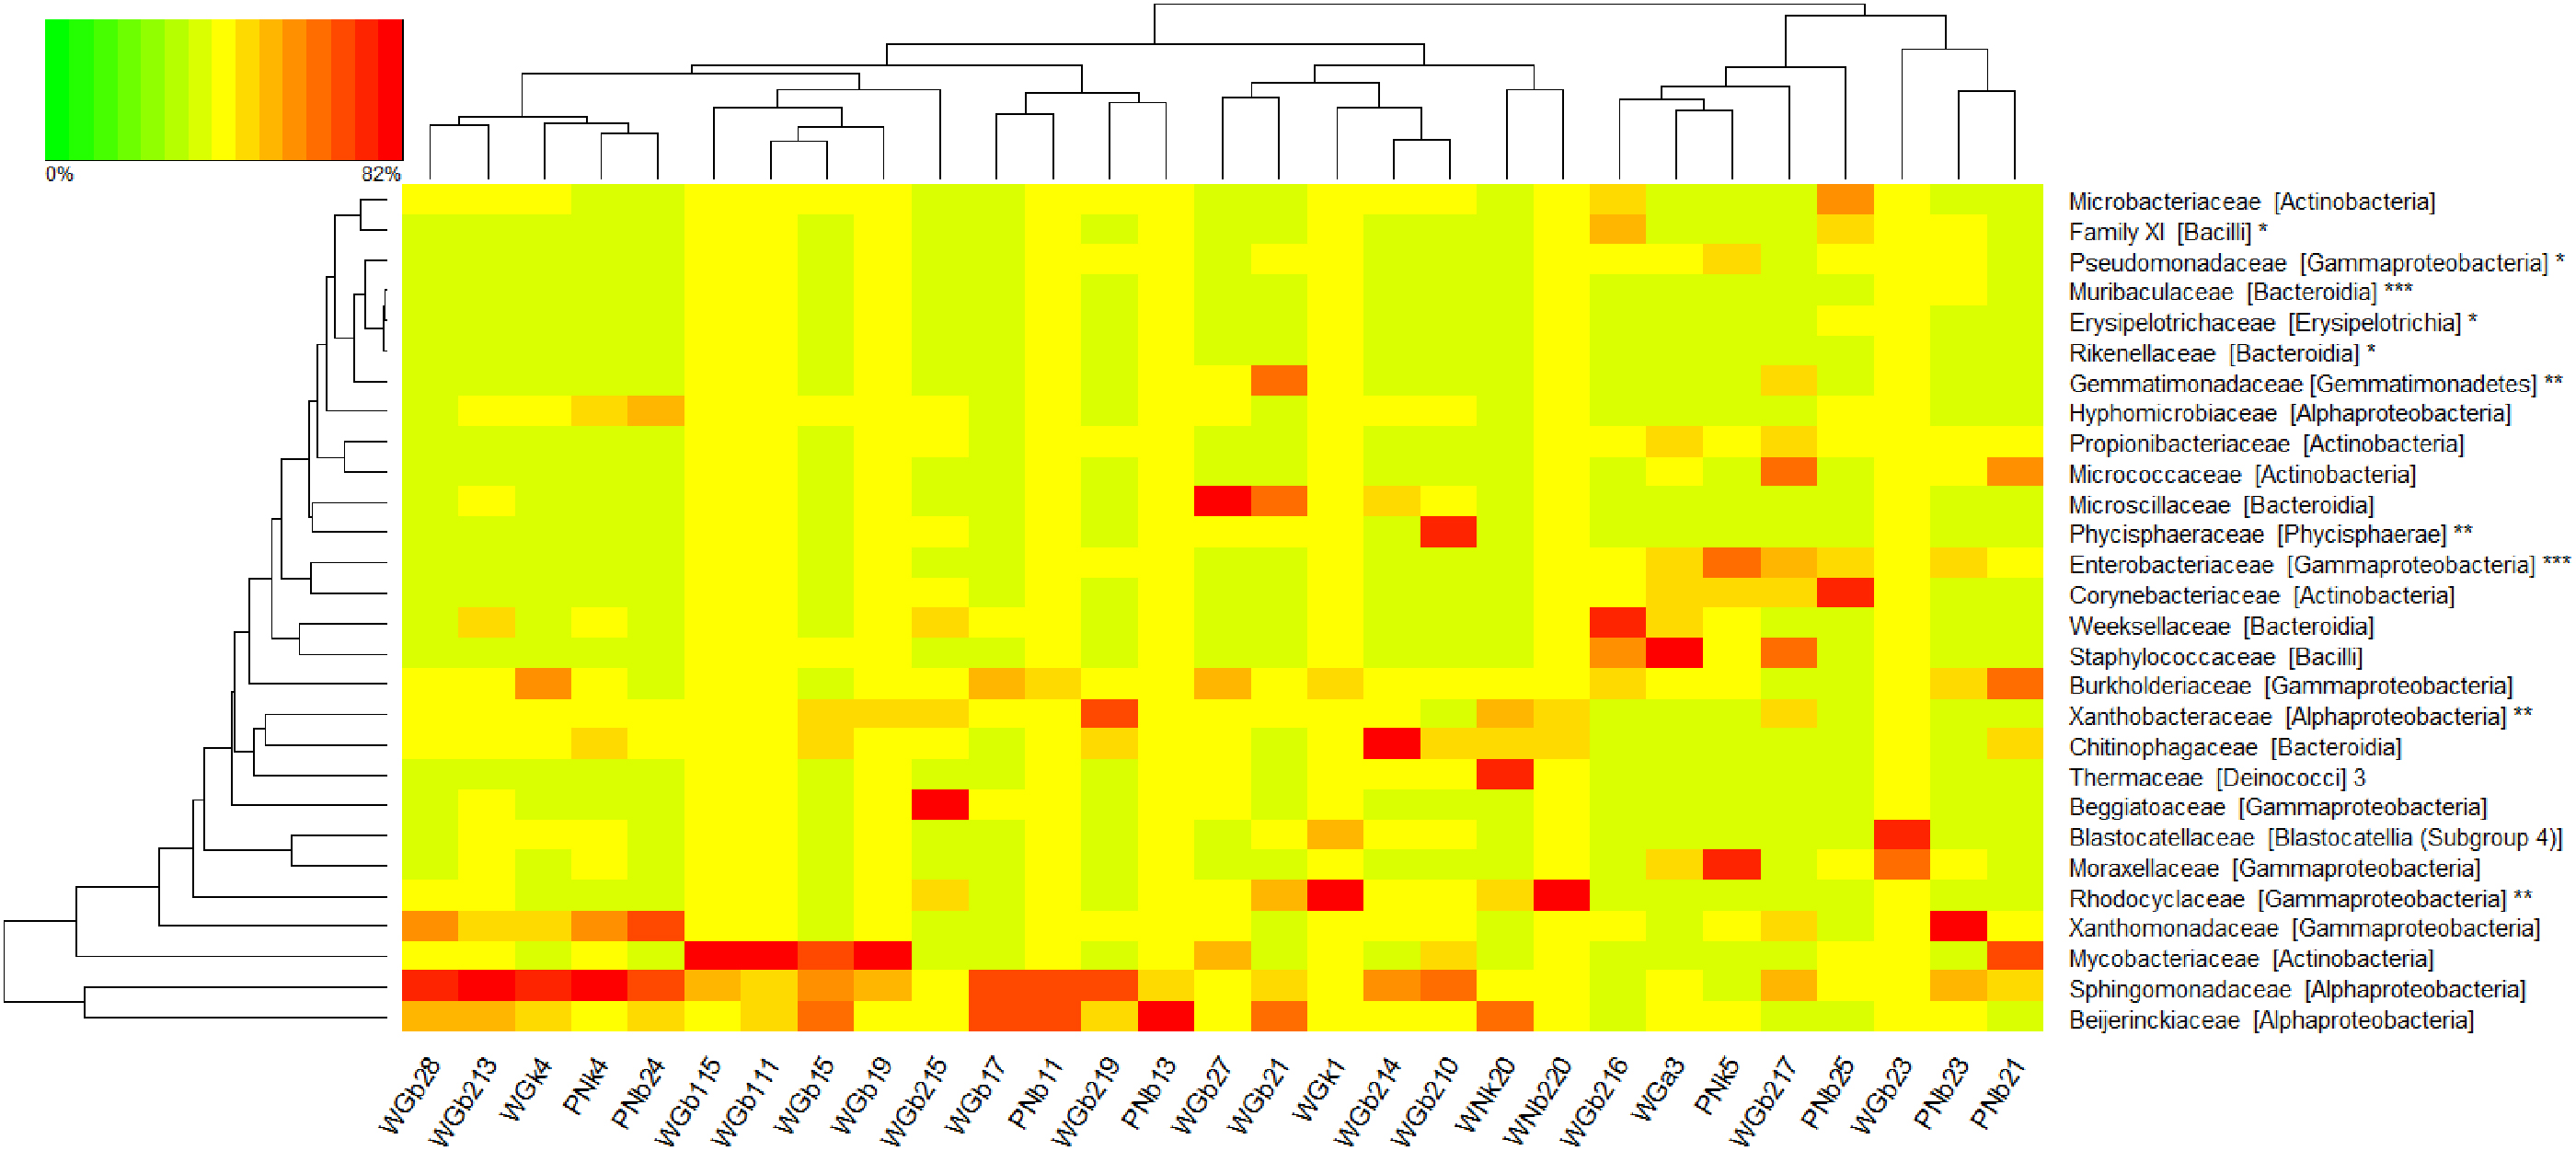
Heat map of family level OTUs >1% of all observations and biomarkers (n = 22,000 sequences per sample) collected from sinks in the homes of the general public (WG#) or an NTM patient (WN# and PN#, for private wells and public supply). Samples are arranged according to hierarchical clustering with a Bray–Curtis Dissimilarity matrix and complete clustering method, as indicated by the top dendrogram. The row dendrogram (left) indicates clustering by row means (i.e., similarity of mean observations for each OTU). OTUs are listed as family [class]. Sample names coded as W = private well, G = general public, P = public supply, N = patient; b1 = first-floor bathroom sink, b2 = second-floor bathroom sink, k = kitchen sink, a = alternative sink, remaining 1–2 digits = system ID (1–20 for private wells; 1–4 for public supply). (Note: * potential mycobacteria antagonists, **biomarkers for private well samples, *** biomarkers for public supply samples.). OTUs, operational taxonomic units.
Of the four samples with the highest relative abundances of Mycobacteriaceae sequences (27–51%), three were from homes with copper plumbing systems, and one used mixed copper and PVC. Previous work has suggested that, unlike many other microbes, mycobacteria carry plasmids that encode resistance to copper, potentially explaining the relatively higher abundance of mycobacteria in these samples with copper plumbing systems (Erardi et al., 1987). The samples also reflected some of the highest myco16S relative abundances in the qPCR data.
Total microbial community analysis through amplicon sequencing
Amplicon sequencing was performed also to characterize the microbial communities more broadly in biofilm samples from homes served by private wells and homes of NTM patients served by public water supply. Of the 70 biofilm samples collected, 29 had sufficient sequences to be fully analyzed (Supplementary Table S3).
At the family level, 21 bacterial families comprised more than 1% of all observations (Fig. 3). For 13 private well and 5 public supply biofilm samples, the Sphingomonadaceae family ranked as 1 of the top 3 most abundant families present per sample, comprising an average of 14% ± 13% and 17% ± 14% of observations for private well and public supply samples, respectively. Members of the alphaproteobacterial Sphingomonadaceae family have been frequently found in drinking water and associated biofilms and were seen to exhibit resistance to disinfection and antibiotics (ldi et al. 2010; Narciso-da-Rocha et al. 2014; Vaz-Moreira et al. 2011). Some members of the Sphingomonadaceae family, such as Sphingomonas paucimobilis, are potential opportunistic pathogens and have been implicated in nosocomial disease (Narciso-da-Rocha et al., 2014; Ozdemir et al., 2011; Ryan and Adley, 2010).
Measures of diversity within each sample (alpha) and across all samples (beta) were calculated and analyzed to understand potential explanatory factors. Alpha diversity indices calculated were species richness, Shannon's H’, and Shannon's evenness. Species richness was significantly higher in private well biofilms than in biofilms collected from homes on public supply (p = 2.6 × 10⁻⁶, Wilcoxon, Supplementary Table S5). Shannon's H’ and evenness were similar for private well systems and public supply, alike (p > 0.24, Kruskal–Wallis). The influence of potential explanatory variables on the values of alpha indices was assessed using RF regression models. For Shannon's H’ (37% variation explained) and evenness (30% variation explained), the RF model found that the location within the home was the most important predictor variable (Supplementary Fig. S3). This appears to be driven by the lower H’ (p = 0.024, pairwise PERMANOVA) and evenness (p = 0.006, pairwise PERMANOVA) in first-floor bathrooms compared with second-floor bathrooms, potentially indicative of different levels of use and environmental conditions between the lesser-used first-floor bathrooms and second-floor bathrooms that frequently contained the home's primary shower. The RF model for species richness explained a lesser 20% of the variation with the visibility of a participant's wellhead aboveground as the most important variable. Interestingly, richness was nearly double in samples whose wellheads were not visible aboveground versus those whose wellheads were.
For beta diversity analyses, 2D nMDS plots generated using Bray–Curtis dissimilarities did not reveal clusters of biofilm bacterial communities at the family level (Fig. 4) as a function of water supply type, water source, physiography, pipe material, well age, well visibility aboveground, disinfection method, sampling time of day, sampling season, and whether or not the aerator was removed. This was confirmed using pairwise PERMANOVA analyses of the community dissimilarity matrix for each variable with a Bonferroni correction for multiple comparisons, which found all p > 0.058 (pairwise PERMANOVA). Previous work with simulated and operating water distribution systems, as well as with simulated and actual premise plumbing, has suggested that source water chemistry, geographic location, available carbon, disinfectant type and residual, stagnation period, water age, water heater temperature, and pipe material, and interactions between these factors, influence microbiome composition of biofilms formed on plumbing surfaces (Falkinham, 2011; Ji et al., 2015; Proctor et al., 2017; Wang et al., 2013; Xue et al., 2020).
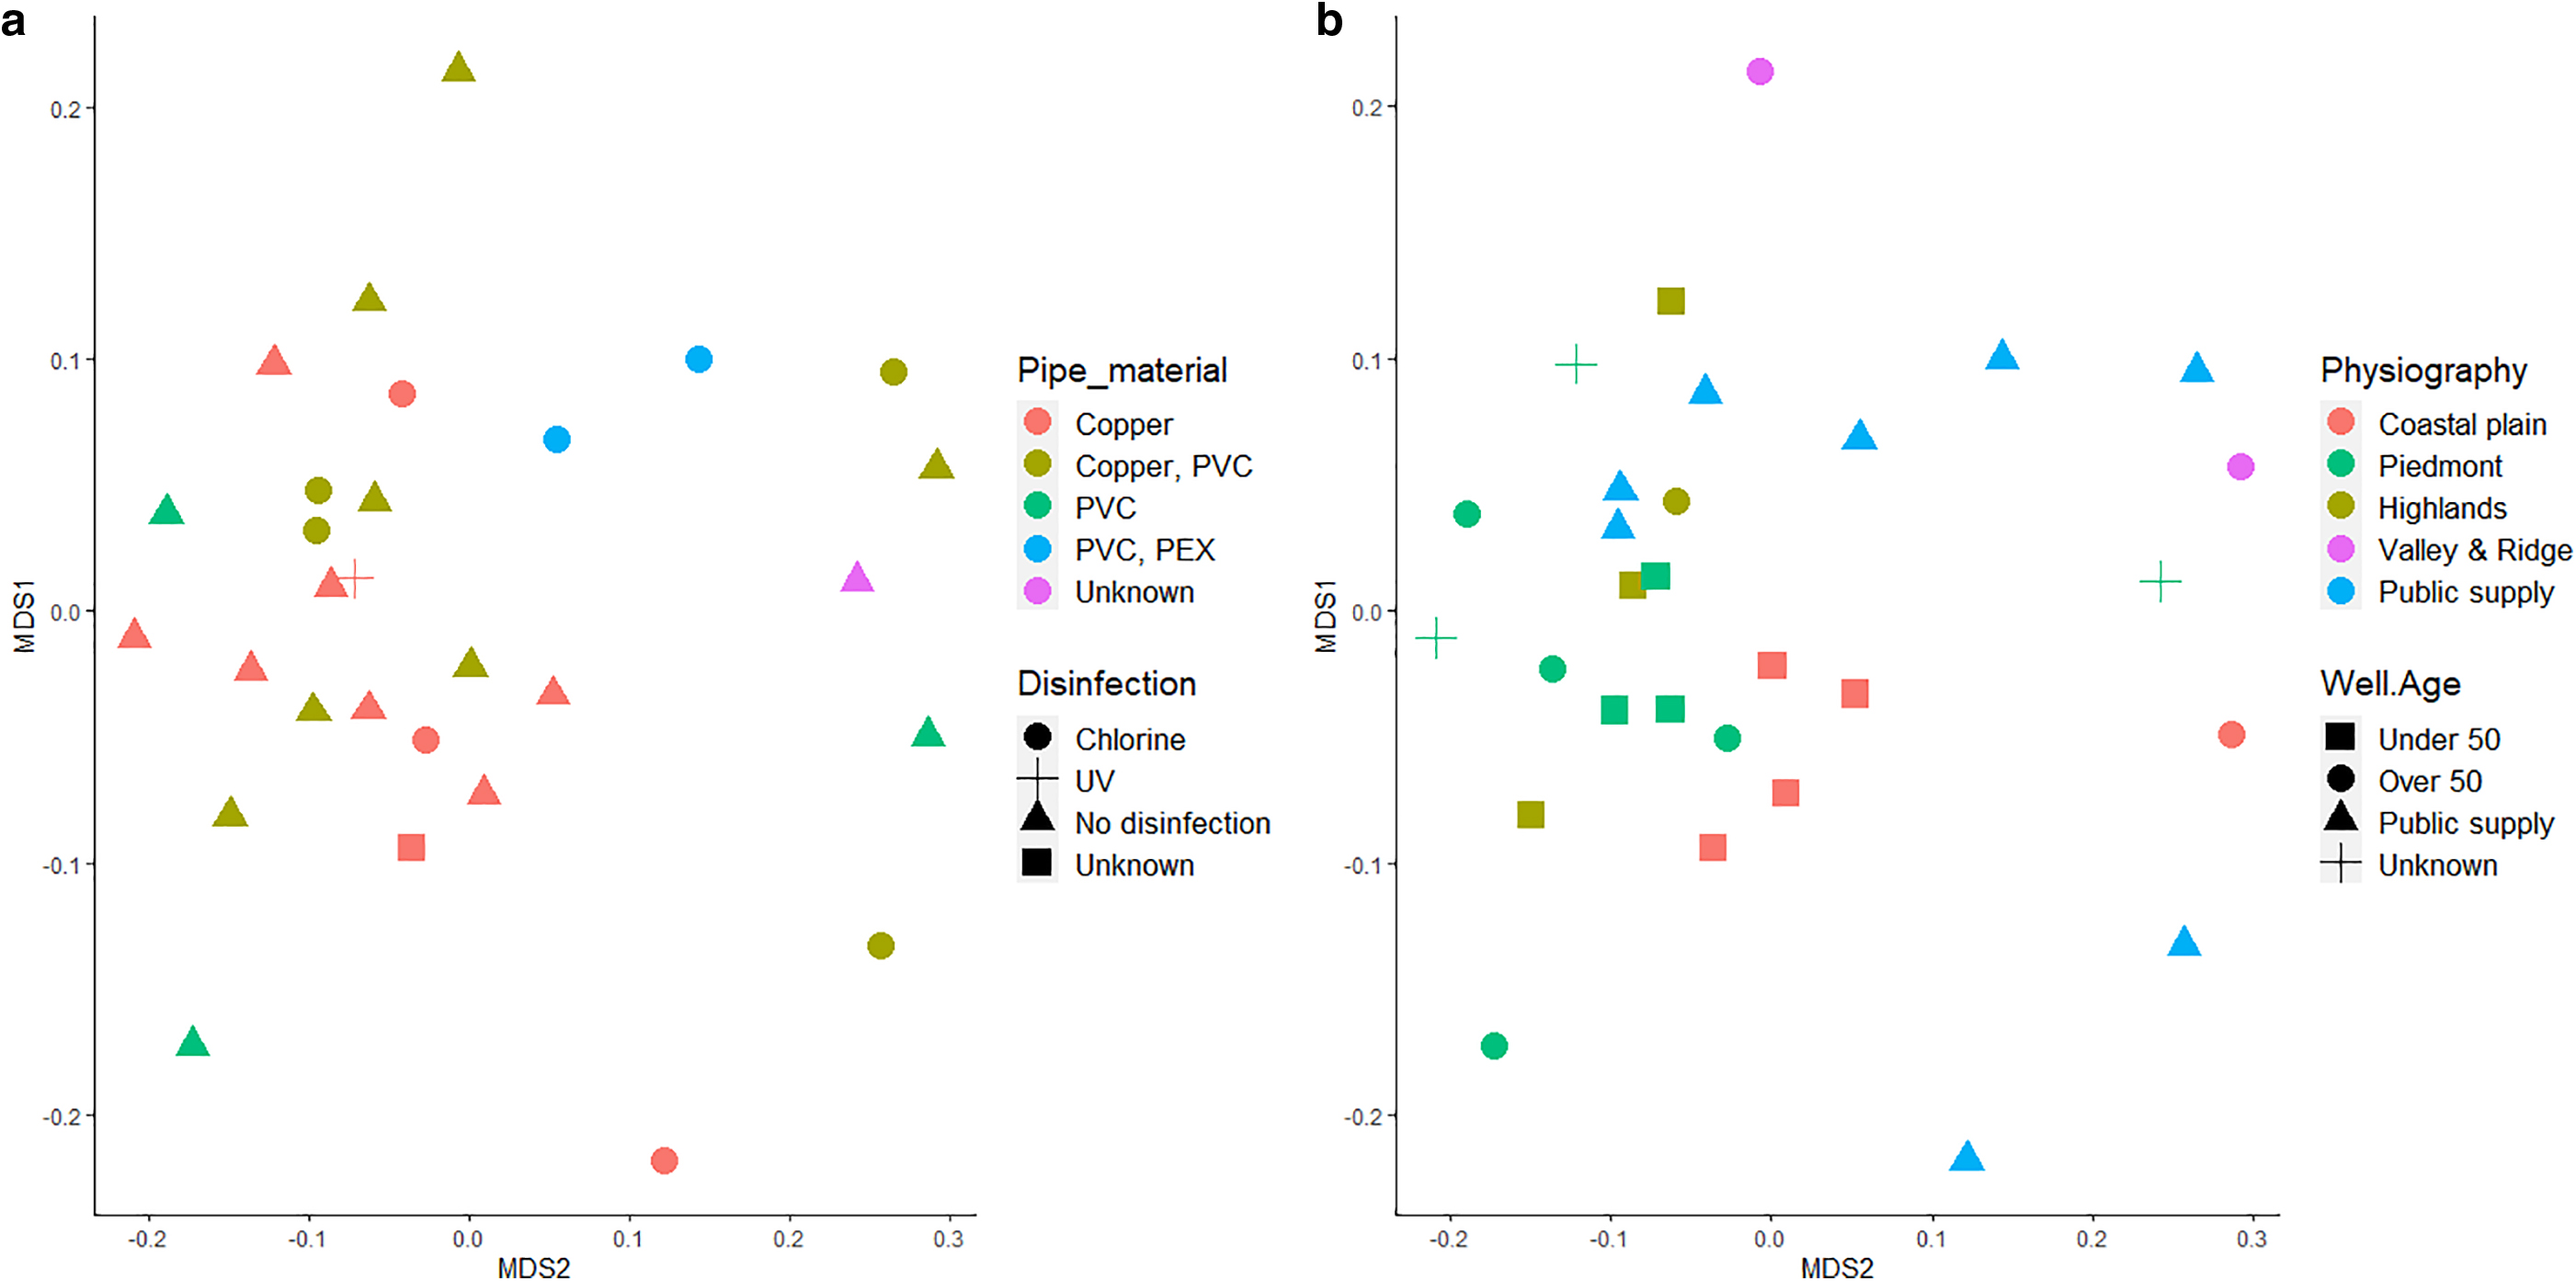
nMDS plot using Bray–Curtis Dissimilarity Matrix at the family level (n = 22,000 sequences per sample) (stress = 0.18) as a function of
LEfSe results
LEfSe was performed on all 29 sequenced biofilm samples (18 replicate samples from 9 homes, 11 samples from individual homes) to determine potential antagonists or mutualists of NTM by identifying biomarkers of sample groups with and without myco16S genes. Four prokaryotic families under the phyla Proteobacteria, Firmicutes, and Bacteroidetes were identified as biomarkers for the absence of myco16S (Supplementary Table S6). These families comprised either environmental or gut bacteria, and three out of four contain known human pathogens. For example, the Pseudomonadaceae family has members that are often found in soils and water and contains the species Pseudomonas aeruginosa, a known opportunistic pathogen (Brennan and Geddes, 2002; Palleroni, 1981). The others are enteric bacterial families, including the currently assumed nonpathogenic Rikenellaceae family (Dworkin and Falkow, 2006), the Erysipelotrichaceae family (Kaakoush, 2015), and the unnamed Bacillales Family Ⅺ that contains some opportunistic pathogens, such as Gemella morbillorum (Vos et al., 2011). These findings suggest that mycobacteria are less likely to live with other bacteria that prefer complex ecosystems with competition, as is found in the human gut microbiome. This aligns with the existing understanding of mycobacteria as a group that thrives with less competition (Falkinham, 2002). Identifying such markers of the absence of NTM could be a starting point for ecological engineering of premise plumbing microbiomes by exploiting antagonistic relationships as suggested by Wang et al. (2013), but further studies are required to evaluate this possibility. Additionally, as Wang et al. mention, and as our findings suggest, the search for potential antagonists to ecologically engineer mycobacteria out of drinking water systems may be complicated by the growth of other opportunistic pathogens, such as those that belong to the other taxonomic families identified as biomarkers for the absence of myco16S.
For the presence of myco16S, nine prokaryotic families in addition to the expected Mycobacteriaceae family were identified. Among them was Beijerinckiaceae, a family of carbon cycling and dinitrogen-fixing bacteria, as previously described (Dedysh et al., 2016; Singleton et al., 2018). Interestingly, previous studies have reported that the presence of Methylobacterium, the genus of the Beijerinckiaceae family most frequently detected in our study, corresponded to lower mycobacteria biofilm formation (Falkinham et al., 2016; García-Coca et al., 2020). In contrast to this and in agreement with our findings, other work has suggested a positive association between Mycobacterium and Methylobacterium in the biofilms of chloraminated systems (Waak et al., 2019b). Thus, the relationship between these genera remains unresolved.
LEfSe was also used to identify biomarkers that distinguished between biofilm samples from homes with private well water versus public water supply (Supplementary Table S6). From this, five prokaryotic families emerged as biomarkers for samples from homes with private wells and two for homes with public supply. For private well samples, the biomarkers were generally families of typical environmental bacteria, including Rhodocyclaceae and Gemmatimonadaceae (Corteselli et al., 2017; Z. Wang et al., 2019). For public supply, the identified biomarkers were Enterobacteriaceae and Muribaculaceae (previously S24-7), bacterial families common to animal gut microbiomes (Wiesenborn et al., 2019), likely indicative of the surface water source water for most of the public supply samples, and unlikely to have been viable in the biofilms at the sampling time, given the samples were from systems with residual disinfectant (Korzeniewska and Harnisz, 2012). See Supplementary Information Section S.2 for more information regarding private well and public supply biomarkers. Due to the lack of existing information about private well household plumbing biofilms, no direct comparisons can be made between these findings and those of other studies.
Conclusion
Mycobacteria were detected using qPCR and amplicon sequencing in the household plumbing biofilms of homes with private wells across physiographic regions in NJ. Biofilms from private well households, including many without disinfection selection pressures, were no less likely than those from NTM patient public supply households to contain NTM. It is recommended that future studies of NTM in biofilms of homes served by private wells include cultivation-, viability-, or activity-based biomolecular techniques to confirm that these observations correspond to viable NTM. RF regressions using the survey and environmental data collected in this study suggested that physiography and indoor environments or use patterns may influence mycobacteria abundance in home biofilms in homes with private wells. However, the models did not explain more than 21% of the variation in NTM observed, which may indicate that a larger sample size and/or measurement of factors not included in this study, such as water age or flow velocity, is needed. This study was limited by the need to stop sampling in participant homes as a result of the COVID-19 pandemic. Collection of more samples is recommended when possible, to facilitate more robust comparisons. While M. avium was not detected in any samples, amplicon sequencing results indicate potential presence of pathogenic mycobacteria species, M. abscessus and M. xenopi, the confirmation of whose presence can be the focus of future investigations. Through the LEfSe biomarker analysis, one microbial family that does not contain known human pathogens emerged as a marker for the absence of mycobacteria Rikenellaceae. Understanding such ecological relationships may be useful for engineering healthy plumbing microbiomes. As the burden of disease from NTM continues to rise, and as 43 million Americans use largely disinfection-free private wells, future work should consider levels of microbial contaminants beyond fecal indicators, including NTM, in private well and public systems, alike.
Footnotes
Authors' Contributions
Conception/design of the work: C.V., N.L.F., and M.L.G. Data collection: S.M.B. and D.P. Data analysis and interpretation: S.M.B. and N.L.F. Drafting the article: S.M.B. Critical revision of the article: S.M.B., C.V., M.L.G., and N.L.F.
Acknowledgments
The authors thank Cassidy Schneider and Rachel Feldstein for assisting in field sampling. They thank Melissa Tu for assisting with qPCR. They thank Thomas Scanlin and Sugeet Jagpal for help in recruiting participants. They also thank Alessia Eramo and Aishwarya Deshpande for assistance with qPCR and DNA extraction methods.
Author Disclosure Statement
No competing financial interests exist.
Funding Information
This work was supported by a grant from the NJ Department of Health to N.L.F., C.V., and M.L.G., USGS NJ Water Resources Research Institute Grant-In-Aid to S.M.B., and the Rutgers Coastal Climate Risk and Resiliency traineeship supported by the U.S. National Science Foundation grant DGE-1633557. The funders had no role in the study design, data collection, interpretation, or decision to publish.
References
Supplementary Material
Please find the following supplemental material available below.
For Open Access articles published under a Creative Commons License, all supplemental material carries the same license as the article it is associated with.
For non-Open Access articles published, all supplemental material carries a non-exclusive license, and permission requests for re-use of supplemental material or any part of supplemental material shall be sent directly to the copyright owner as specified in the copyright notice associated with the article.