




Abstract
Under the pressure of global warming and energy crisis, more and more attention has been paid to renewable energy, which promotes the rapid growth of global photovoltaic (PV) power plants. The construction of large-scale PV power plants changes the surface energy distribution, which inevitably affects the local microclimate and material exchange at the land surface. However, few studies have focused on the influence of large-scale PV power plants on soil heat exchange. Thus, this article studied the effects of two types of PV panels (fixed-tilt PV panels and oblique single-axis PV panels) on soil temperature in a desert climate area through field observations from September 2018 to August 2019. The result shows that PV panels cause seasonal and diurnal variations in soil temperature. Specifically, on a seasonal scale, PV panels have a warming effect up to 2.08°C during winter, but a cooling effect up to 4.15°C from spring to autumn. Furthermore, on a diurnal scale, PV panels have a warming effect on soil temperature during autumn and winter, but a cooling effect during spring and summer. The difference of soil temperature under PV panels was small under different weather conditions. In addition, air temperature, global radiation, and vapor pressure deficit were positively correlated with soil temperature, and global radiation has no direct effect on soil temperature under PV panels. We concluded that PV panels significantly changed soil temperature regime in desert areas, but their effects depended mainly on seasons.
Introduction
Due to global challenges, such as climate warming and environmental deterioration, many countries are committed to researching and developing renewable energy. Renewable energy sources such as biomass, wind, solar, hydropower, and geothermal can provide sustainable energy service (Herzog et al., 2001). According to the International Energy Agency (IEA) report, the use of renewable energy can reduce 70% of global carbon emissions (IEA, 2016). Comparing all renewable types based on environmental, economic, and safety criteria, solar energy appears the most promising (Bórawski et al., 2019). Solar photovoltaic (PV) energy generation accounts for 11% of global green power production, reduces CO2 emissions by 2.3 Gt year−1 (Choudhary and Srivastava, 2019). From the perspective of the abundance and inexhaustibility of solar energy on the earth, the current solar power generation leads the growth of renewable energy by 64% throughout the forecast period of 2050 (Eia, 2018).
PV panels generate electricity by absorbing radiant energy and this process changes the radiation balance between earth's surface and atmosphere. The physical presence of PV arrays will affect the photosynthetic active radiation, reduce the surface albedo, and change the distribution of precipitation (Chang et al., 2018; Li et al., 2018). These changes have a significant impact on the driving factors of local microclimate, such as the air temperature and soil temperature. Based on field observations, the average annual air temperature at 2.5 m at the Tucson PV power plant in the United States increased by 2.4°C, while the night-time air temperature increased by 3–4°C (Barron-Gafford et al., 2016). In the Red Rock PV Power Plant in the United States, the maximum daytime air temperature increased by 1.38°C at a height of 1.5 m, while a significant difference was not observed in the night-time air temperature (Broadbent et al., 2019). In the Golmud PV Power Plant in Qinghai, China, the air temperature field at 2 m was higher compared with the off-site control area, with a maximum air temperature difference of 0.67°C, while the air temperature at 10 m was lower (Gao et al., 2016a). Based on climate model simulations, solar panels on urban roofs can reduce the heat island effect during summer and decrease the air temperature during the day (0.28–0.48°C) and at night (0.38–0.78°C) (Salamanca et al., 2016). However, for large PV power plants in the Sahara, the air temperature increased (Li et al., 2018). The conclusions of current reports on the impact of PV power plants on air temperature are inconsistent, and further study is needed.
PV panels reduce the incoming direct shortwave and outgoing longwave radiant flux of the underlying soil (Adeh et al., 2018), and the spatial change of the radiant flux balance directly affects the soil temperature. Field observations of PV power plants on grassland showed that PV panels changed the underlying microclimate and caused a decrease in the summer soil temperature by 5.2°C, but an increase in the winter soil temperature by 1.7°C relative to the control areas (Armstrong et al., 2016). In addition, the average soil temperature during the growing season decreased by 4°C (Makaronidou, 2020). However, the soil temperature of PV power plants in desert areas was cooler throughout the year than control areas outside the PV power plants (Gao et al., 2016b). The impact of PV power plants on temperature may change the growth of vegetation and the carbon cycle of the ecosystem. For example, Marrou et al. (2013) found that changes in soil temperatures had an effect on the leaf emission rate of cucumbers and lettuces. Armstrong et al. (2016) found that microclimate changes caused by a PV array reached the magnitude that affects the terrestrial carbon cycle. In an arid environment, changes in the microclimate of PV power plants have caused an increase in biomass and species diversity, and the vegetation coverage rate has reached 90.5% (Liu et al., 2019). The above findings showed that PV power plants in different climates have different effects on temperature. The lack of accurate assessment of environmental changes caused by PV power plants may cause uncertainty in ecosystem assessment. Therefore, a detailed understanding of changes of soil temperature under PV panels in the desert area is necessary to determine the impact of PV power plants on ecosystem processes.
In this study, the effect of PV panels on soil temperature was evaluated by field monitoring at the Gonghe PV power plant, which is in a desert area. Field observation data with a continuous resolution of 30 min from September 2018 to August 2019 were used to compare the soil thermal regime and the influence of environmental factors under two types of PV panels. The objectives of this study are as follows: (1) to quantitatively explain the effect of PV panels on soil temperature in different seasons and at different depths and (2) to explain the effect of environmental factors (global radiation, air temperature, and vapor pressure deficit [VPD]) on soil temperature.
Materials and Methods
Site description
Measurements were taken at the Gonghe PV power plant (36. 130°N, 100.574° E), which is located in Qinghai Province ∼18 km south of Gonghe County (Fig. 1a). The study area has an elevation of 2900–3100 m, and the local climate is a typical alpine arid desert, with an annual average temperature of 4.1°C. The annual precipitation is 246.3 mm, and the annual evaporation is 1716.7 mm. The annual average number of gale days is 51 days, mainly in winter and spring. The annual average wind speed is 1.8 m/s, and the wind direction is mainly west and northwest. The local soil is mainly chestnut soil and the thickness of soil layer is generally 50–70 cm. The local soil parent material is loess or gravel, and the texture is mostly sandy loam and light silt loam (Shao et al., 1988). The local vegetation mainly includes Achnatherum splendens, Stipa breviflora, Orinus kokonorica, Leymus secalinus, Artemisia frigida, and Caragana tibetica (Wei and Wu, 2011).

Instruments and experimental design
Two types of PV panels are installed in the study area. The fixed-tilt PV panels are tilted 34° from the horizontal and pointed toward the south, and the distance between the panels is ∼7.5 m (Chang et al., 2018). The oblique single-axis (OSA) PV panels are controlled by an automatic optical tracking system and can rotate in an east-west direction. A weather station (Fig. 1b, 36.131°N, 100.567°E, 2913 m) was installed in the open space at the boundary of the fixed-tilt PV panels and the OSA PV panels. Three soil temperature monitoring sites were established (Fig. 1c), and the installation depths of the monitoring sites were 0.1, 0.2, and 0.4 m. One monitoring site was located under a fixed-tilt (FIX) PV panel (FIX site) and fully covered by the PV panel. Another monitoring site was located under an OSA PV panel (OSA site), and it was partially covered by the PV panel. The reference monitoring site (REF site) was located in an open space ∼20 m away from the PV panels, and it was not covered by a PV panel. Data from the REF site (i.e., non-PV) were compared with data from the other two sites. Table 1 shows the mounting heights and depths of all instruments. The data collection (CR1000X) was synchronous, and the collection interval was 30 min.
Summary of Instrument Specifications at the Fixed-Tilt (Under the Fixed-Tilt Photovoltaic Panel), Oblique Single-Axis (Under the Oblique Single-Axis Photovoltaic Panel), and Reference (Nonphotovoltaic) Sites
The VPD (kPa) was calculated as follows (Zha et al., 2017),
where RH is relative humidity (%), T is air temperature (°C), and es is saturated vapor pressure (kPa).
Data analysis
The annual average, seasonal average, and diurnal average soil temperatures were calculated by averaging the original data from 30 min for comparison. A one-way analysis of variance and Pearson correlation analysis were used to study the significant differences in soil temperature at the three monitoring sites, and the calculations were performed using SPSS software (SPSS 22.0; SPSS Incorporation, USA). The figures were plotted using Origin software (OriginPro; OriginLab, USA).
Results
Annual variation in soil temperature
The soil temperature observed under the PV panels (FIX site and OSA site) was compared with that in the area without PV (REF site) as shown in Fig. 2. The annual average soil temperatures (average of 0.1, 0.2, and 0.4 m) at the FIX and OSA sites were lower than the value at the REF site. The annual average soil temperatures at the FIX and OSA sites were 5.57°C and 5.90°C, respectively, while that at the REF site was 7.08°C. The annual variation in soil temperature indicated that the PV panels had cooling effects. We also found that the soil temperature varied with the seasons in the three monitoring sites; therefore, the seasonal changes in soil temperature are discussed next.
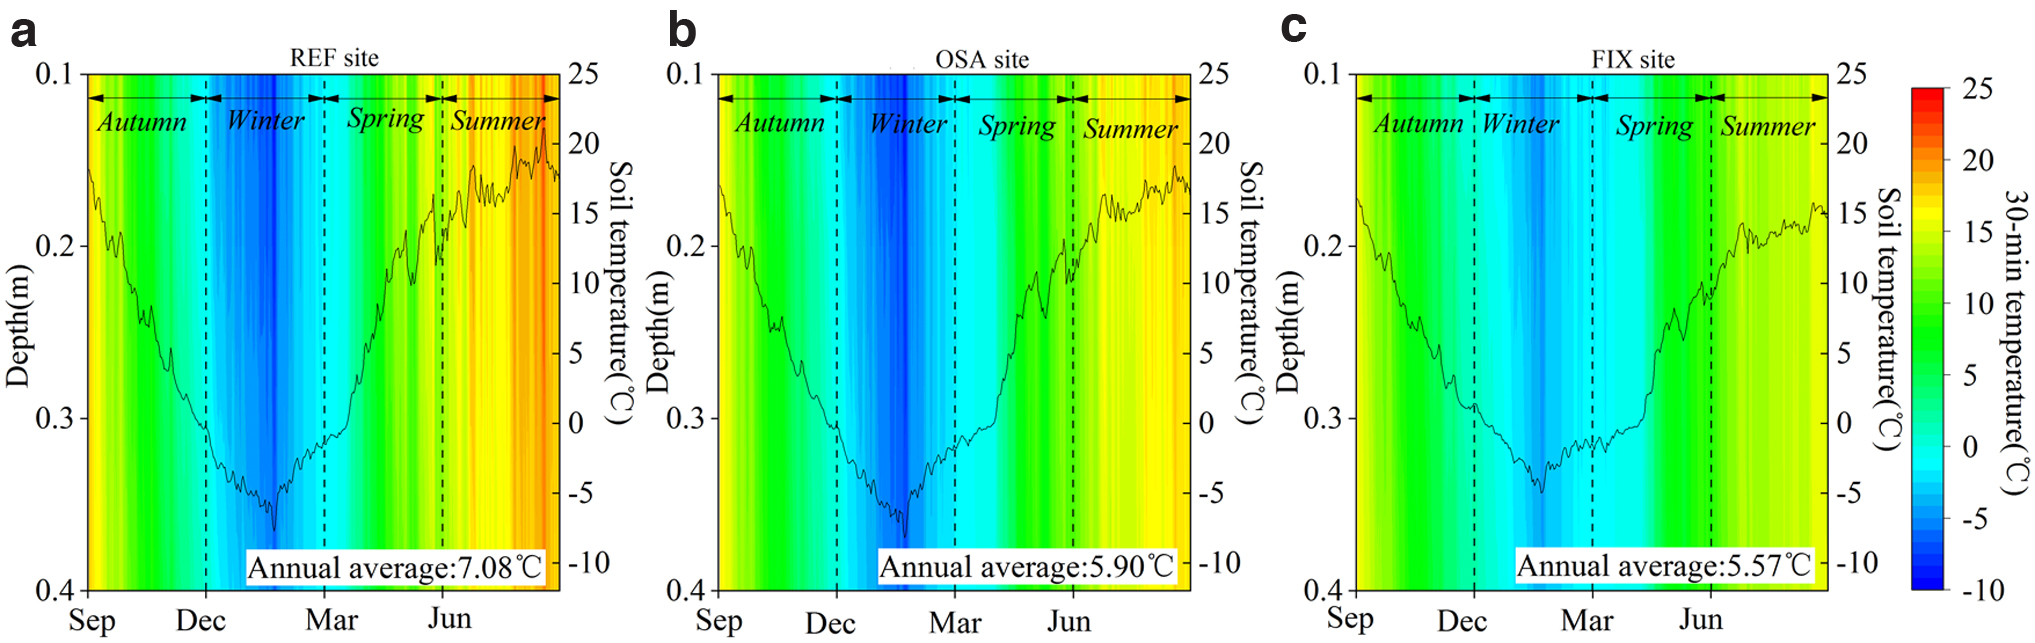
An overview of the 30-min soil temperature profile across the three monitoring sites over the study period (September 2018–August 2019),
Characteristics of seasonal soil temperature variations
The presence of PV panels led to differences in the variation patterns of soil temperature at the seasonal scale, as shown in Fig. 3. In autumn, with the decrease in solar radiation and evaporation (Qi et al., 2016), significant differences were not observed in the soil temperature at various depths among the three monitoring sites (Fig. 3a).
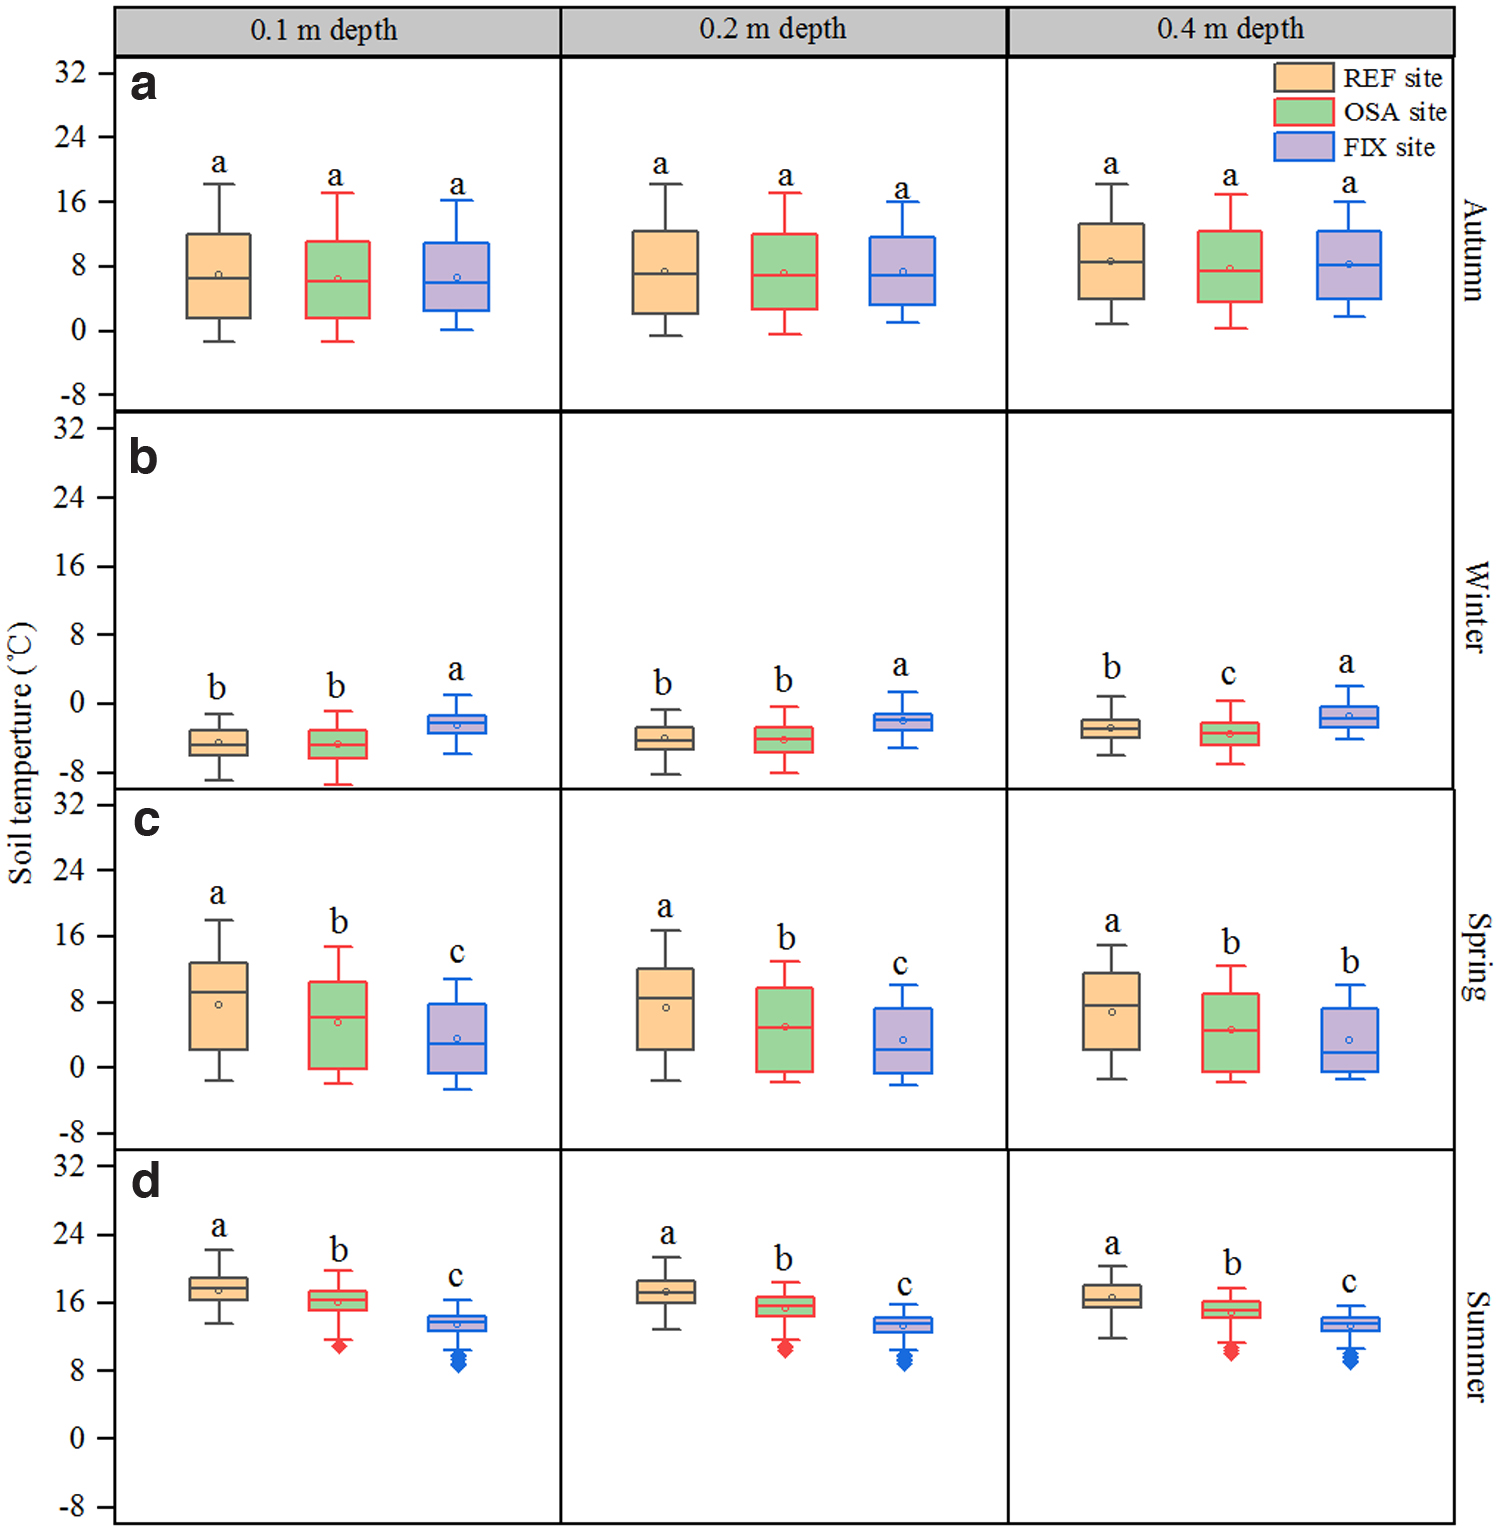
Comparison of soil temperature across the monitoring sites at various depths and by season:
In winter, significant differences were not observed between the OSA and REF sites at 0.1 and 0.2 m depths; however, both the OSA and REF sites were significantly different from the FIX site (Fig. 3b). Significant differences were observed among the three monitoring sites at 0.4 m depth. The soil temperatures at various depths at the FIX site were significantly higher than those at the OSA and REF sites: at 0.1 m, the temperature at the FIX site was 2.25°C and 2.08°C higher; at 0.2 m, the temperature was 2.12°C and 2.08°C higher; and at 0.4 m, the temperature was 2.05°C and 1.46°C higher, respectively. Therefore, the PV panels had a warming effect in winter, and the most significant warming was caused by the fixed-tilt PV panels.
In spring, a significant difference was observed in the soil temperature at 0.1 and 0.2 m depths among the three monitoring sites; however, the FIX and OSA sites were not significantly different at 0.4 m depth (Fig. 3c). The soil temperatures at the various depths at the REF site were significantly higher than those at the FIX and OSA sites: at 0.1 m, the temperature at the REF site was 4.15°C and 2.18°C higher; at 0.2 m, the temperature was 4.01°C and 2.40°C higher; and at 0.4 m, the temperature was 3.49°C and 2.18°C higher, respectively.
In summer, which had the strongest solar radiation and evaporation intensity (Qi et al., 2016), significant differences were observed in the soil temperatures at various depths (Fig. 3d). The soil temperatures at the REF site were significantly higher than those at the FIX and OSA sites: at 0.1 m, the temperature at the REF site was 4.04°C and 1.53°C higher; at 0.2 m, the temperature was 3.98°C and 1.91°C higher; and at 0.4 m, the temperature was 3.29°C and 1.63°C higher, respectively. From spring to autumn, the shielding effect of the PV panels reduces the solar radiation incident at the soil surface (Smith et al., 1987); therefore, the soil temperature under the PV panels experienced a cooling effect. In terms of ecosystems, the cooling effect may alter many key plant–soil processes, from productivity to decomposition (Feng et al., 2008; Wu et al., 2012).
Figure 4 shows the vertical distribution of soil temperature. The soil temperature at these three monitoring sites increased with increasing depth in autumn and winter (Fig. 4a, b), but decreased with increasing depth in spring and summer (Fig. 4c, d). The results were in agreement with those observed by Chen et al. (2013).

Vertical distribution characteristics of soil temperature by season:
Diurnal variations in soil temperature
During the diurnal cycles throughout the year, the PV panels had a cooling effect on the soil temperature. The magnitude of the diurnal variation in the annual average soil temperature increased in the order FIX<OSA<REF (Fig. 5). The annual average soil temperature during the day (from 08:00 to 20:00 local time) at the FIX site was 1.31–1.88°C lower than that at the REF site and 1.32–1.58°C lower at night (from 21:00 to 07:00 local time). The annual average soil temperature during the day at the OSA site was 1.20–1.31°C lower than that at the REF site and 0.96–1.35°C lower at night. During the day, significant differences in temperature were not observed between the OSA and FIX sites; however, both the OSA and FIX sites were significantly different from the REF site at various soil depths. At night, significant differences were observed at 0.2 and 0.4 m depths at these three monitoring sites, but significant differences were not observed at 0.1 m between the OSA and FIX sites.
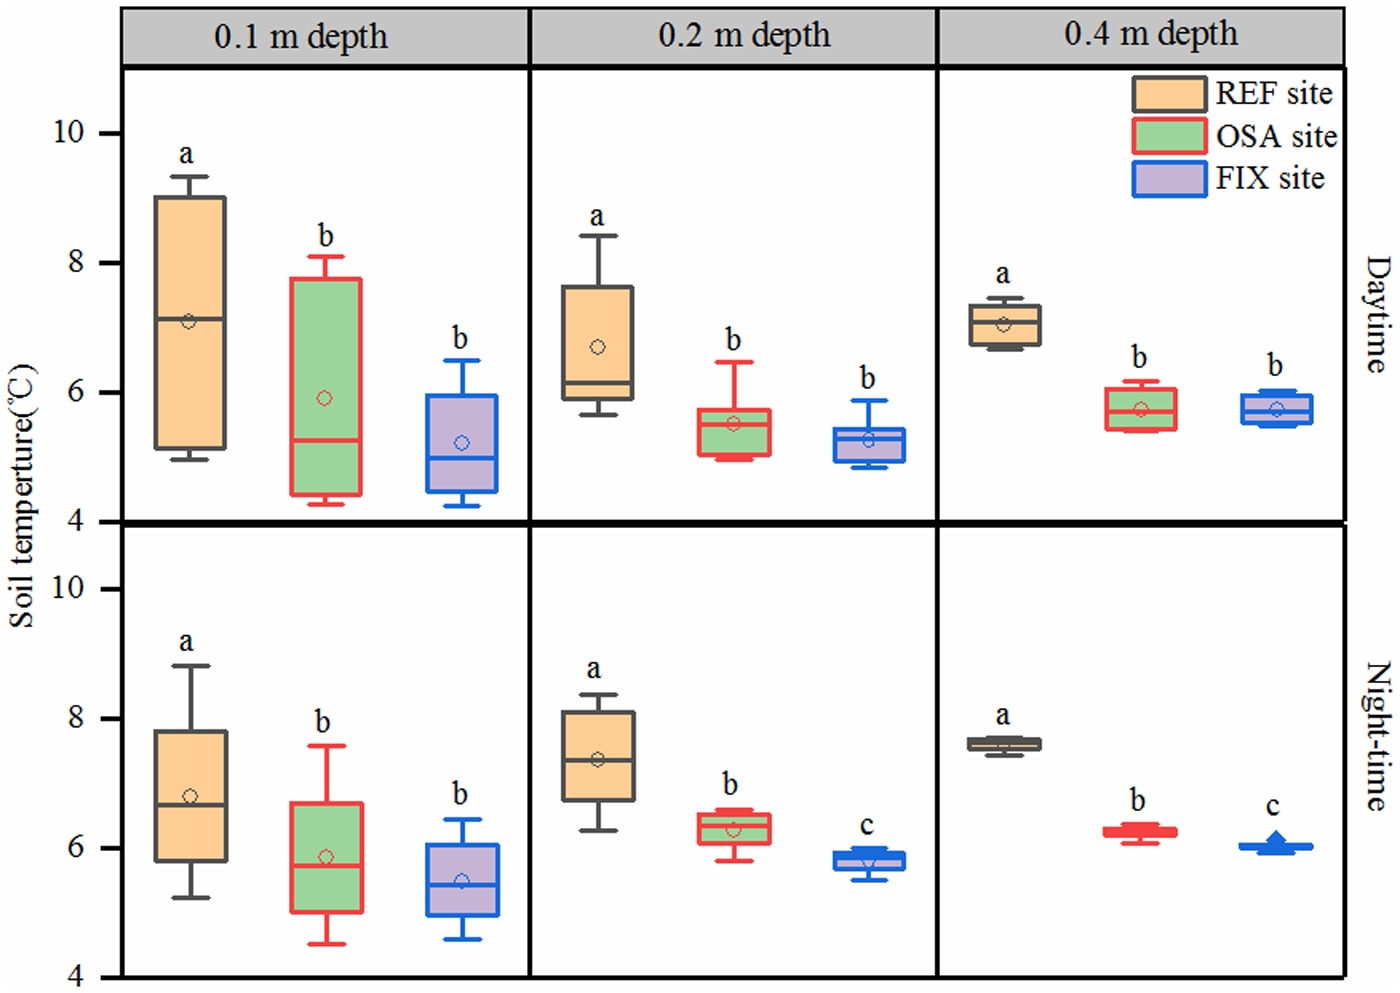
Comparison of soil temperature across the monitoring sites at various depths and during the day and night. The daytime soil temperature is the average of temperatures measured between 08:00 and 20:00 local time. The night-time soil temperature is the average of temperatures measured between 21:00 and 07:00 local time. Letters on the error bars (a–c) indicate significant differences in soil temperature among the monitoring sites at a probability of 95%.
The diurnal variations in soil temperature were seasonal (Table 2). In autumn and winter, the diurnal variations in soil temperature at the FIX and OSA sites were higher than that at the REF site and the PV panels had a warming effect on soil temperature. In contrast, in spring and summer, the diurnal variations in soil temperature at the FIX and OSA sites were lower than that at the REF site and the PV panels had a cooling effect on soil temperature. Overall, during the daytime, the cooling effect at 0.1 m at the FIX site was the most significant in summer (the difference from the REF site was 4.44°C), whereas at night, the cooling effect was most significant at 0.2 m (the difference from the REF site was 4.05°C). The effects of warming and cooling on soil temperature were more significant under the FIX PV panel than under the OSA PV panel. PV panels absorb solar radiation and change the surface energy balance (Masson et al., 2014; Broadbent et al., 2019), which has an impact on the diurnal soil temperature cycle at PV power plants and further affects plant-soil processes (Armstrong et al., 2016).
Average Soil Temperature Differences Among the Three Sites at Various Times of Day and By Season
Positive values indicate a warming effect of the photovoltaic panels, while negative values indicate a cooling effect.
Bold numbers represent the largest soil temperature differences between the FIX (or OSA, under the PV panel) and REF (non-PV) sites across the four seasons and times of day at various soil depths.
FIX, fixed-tilt; OSA, oblique single axis; REF, reference; PV, photovoltaic.
Diurnal variation of soil temperature under different weather conditions
To study the difference of diurnal variation of soil temperature under different weather conditions, we selected typical sunny days (cloud amount ≤10%, July 25, 2019), cloudy days (cloud amount ≥70%, July 16, 2019), and rainfall days (July 16, 2019) to compare and analyze the diurnal variation characteristics of soil temperature, as showed in Fig. 6. The average daily soil temperature at REF and OSA sites was sunny day > rainy day > cloudy day, and the difference of soil temperature in sunny and cloudy days was 2.14°C and 1.30°C, respectively. However, the daily average of soil temperature at FIX sites was sunny day > cloudy day > rainy day, and the temperature difference between sunny and rainy days was 0.56°C. Due to the shading of PV panels, the difference of soil temperature under PV panels was small under different weather conditions.
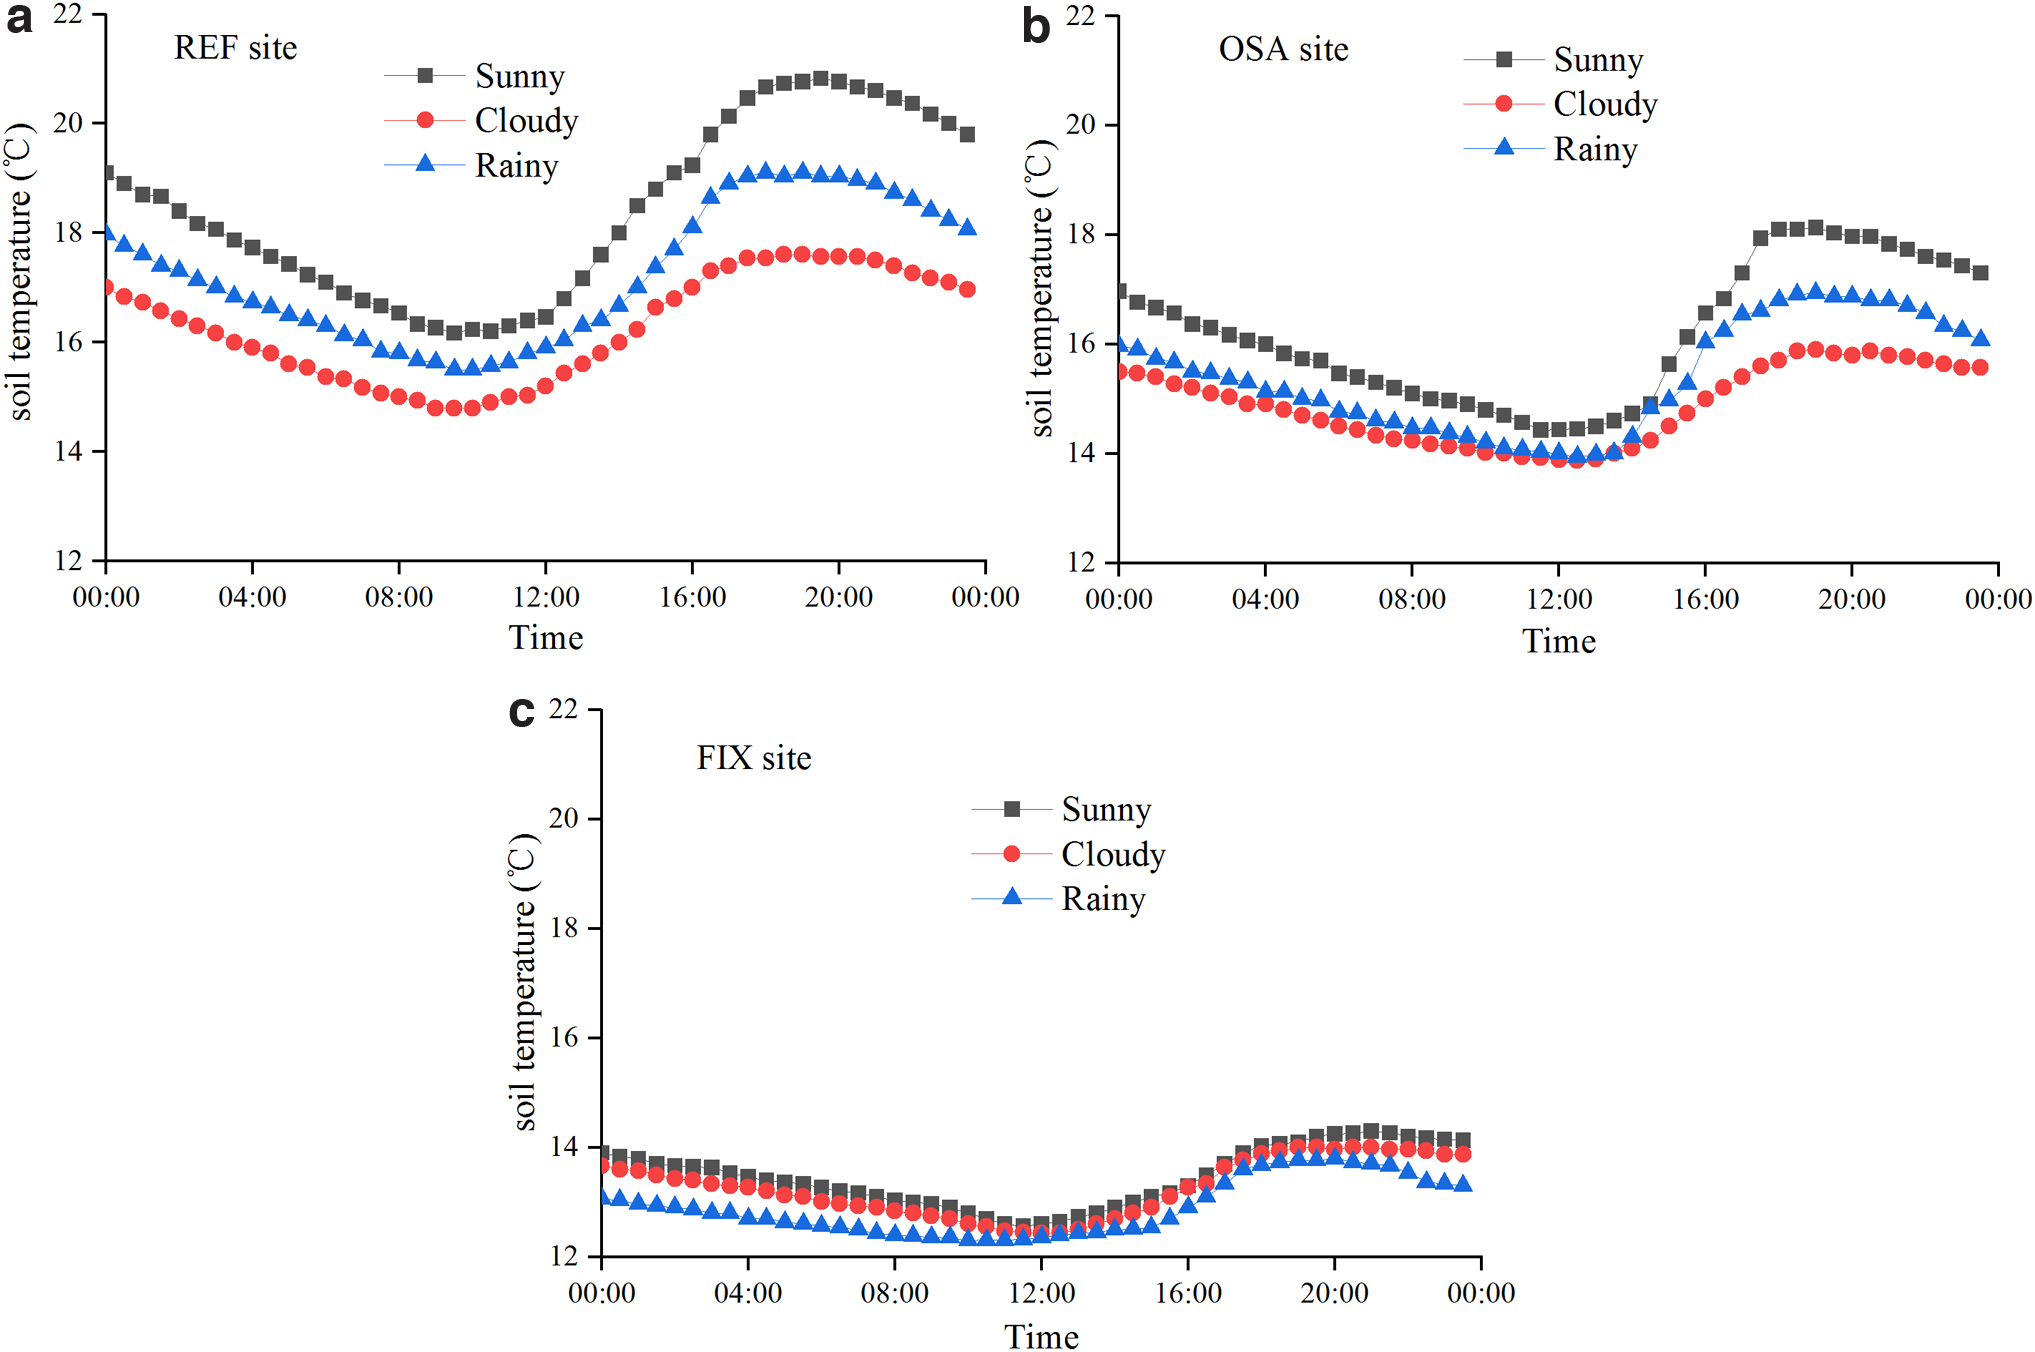
Comparison of soil temperature in three monitoring sites under different weather conditions (sunny day, cloudy day, and rainy day),
Correlation analysis between soil temperature and environmental factors
The results of the correlation analysis between soil temperature and environmental factors showed that global radiation, air temperature, and VPD were correlated with soil temperature (Table 3, n = 365, r > 0.370, p < 0.01). The Pearson correlation coefficient between air temperature and soil temperature was the largest, as shown in Table 3 and Fig. 7. The Pearson correlation coefficient between air temperature (or global radiation) and soil temperature was the largest at REF site and the smallest at FIX site, and the Pearson correlation coefficient decreased with increasing depth. Besides, soil temperature was also positively correlated with VPD (r > 0.901, Table 3 and Fig. 8). Contrary to the air temperature correlation, the correlation coefficient between soil temperature and VPD was the smallest at REF site and the largest at FIX site.

Correlation between soil temperature and air temperature at various depths,

Correlation between soil temperature and vapor pressure deficit at various depths,
Pearson Correlation Matrix Showing the Relationships Between Soil Temperature and Environmental Factors at 0–0.4 m Depth of Reference (Nonphotovoltaic), Oblique Single-Axis (Under the Oblique Single-Axis Photovoltaic Panel), and Fixed-Tilt (Under the Fixed-Tilt Photovoltaic Panel) Sites
p < 0.01.
VPD, vapor pressure deficit.
Multiple stepwise regression analysis of environmental factors (as independent variables) and soil temperature showed that air temperature, VPD, and global radiation had significant effects on soil temperature in non-PV areas (REF site), as shown in Table 4; for instance, the above three factors together explained 96.7% of the variation of soil temperature at 0.1 m depth of REF site. However, under PV panels (OSA and FIX sites), only air temperature and VPD entered the stepwise regression model. For example, air temperature and VPD jointly explained 94.3% of the variation of soil temperature at 0.1 m depth of FIX site. The degree of shading provided by PV panels can significantly impact the effects of global radiation on soil temperature.
The Relative Contribution of Environmental Factors to Soil Temperature at 0–0.4 m Depth of Reference (Nonphotovoltaic), Oblique Single-Axis (Under the Oblique Single-Axis Photovoltaic Panel), and Fixed-Tilt (Under the Fixed-Tilt Photovoltaic Panel) Sites using Stepwise Multiple Regression
T = air temperature (°C); VPD = kPa; Q = global radiation (W m−2).
The t statistics can help you determine the relative importance of each variable in the model; the independent variables are usually measured in different units, and hence the standardized coefficients make the regression coefficients more comparable. **p < 0.01.
Discussion
Effects of PV panels on soil temperature
The operation of large-scale PV power plants has changed local microclimates, and the microclimate goes through obvious changes at seasonal and diurnal scales (Armstrong et al., 2016). This study investigated the impact of PV panels on soil temperature in desert areas and noted that the effects of PV panels can also show significant seasonal differences (Fig. 3, Table 2). In autumn, the soil temperature under the FIX and OSA panels at various depths did not decrease significantly (no more than 0.9°C, Fig. 3a), which indicates that the shading of the PV panels does not have an obvious effect on soil temperature during the transition from warm to cold seasons. In spring and summer, due to the interception of shortwave radiation by the PV panels before it reached the ground (Weinstock and Appelbaum, 2009), the soil temperatures at various depths under the FIX and OSA PV panels decreased. The soil temperature under the FIX PV panel decreased significantly compared with that under the OSA PV panel (the maximum temperature difference was 4.15°C, as shown in Fig. 3c, d) because the OSA tracking PV panel received more solar radiation than the FIX PV panel and the solar radiation was more uniform under the OSA PV panel. The soil temperatures under the FIX and OSA PV panels also decreased in the diurnal cycle in spring and summer (the maximum temperature difference was 4.44°C during the day in summer, Table 2).
In winter, soil temperatures at various depths under the FIX PV panel increased (the maximum temperature difference was 2.08°C as shown in Fig. 3b), while soil temperatures decreased under the OSA PV panel (the maximum temperature difference was 0.59°C). Soil temperatures under the FIX and OSA PV panels also increased during the diurnal cycle in autumn and winter (the maximum temperature difference was 2.18°C), which may have been caused by the lower solar altitude angle during the winter reducing the solar radiation received by the FIX and OSA PV panels, the smaller sky view (i.e., the fraction of sky visible) under the PV panels reducing net longwave radiation loss (and thus heat loss) from the surface (Oke, 1982), and the impacts of the PV panels on air turbulence, heat transfer, and soil temperature (Armstrong et al., 2016). Since the soil in the study area was frozen during winter, the microbial activity in soil and litter was usually low; therefore, the effects of soil temperature differences on plant–soil processes were limited. The above conclusions were consistent with the observations of the soil temperature in UK grassland solar park. The observation results were that the soil temperature under the PV panels in summer has decreased by 5.2°C, while it increased by 1.7°C in winter (Armstrong et al., 2016). However, regardless of the seasonal changes in warm zones, the soil under the PV panels was cooler (Makaronidou, 2020). Similarly, the soil temperature inside the PV power plants was lower than outside throughout the year in arid areas. Due to the different climatic conditions and measured soil depths in different research areas, the conclusions on the impact of PV panels on soil temperature were also different.
Response of environmental factors to soil temperature
There was a positive correlation between soil temperature and global radiation in non-PV areas. However, due to the shading of PV panels, the absorption of solar radiation heat by the soil was prevented, so global radiation did not contribute to soil temperature under PV panels. This research also showed that as the degree of shading increased (the REF site→under the OSA panel→under the FIX panel), the response of soil temperature to air temperature decreased (Table 3 and Fig. 7). In addition, there were certain differences in the response degree of soil temperature to air temperature at different depths, which showed that with the increasing soil depth, the Pearson correlation coefficient decreased and the response intensity decreased. This can be explained as air temperature transfers heat from shallow soil to deep soil, mainly through heat conduction and heat convection; with the increase of soil depth, the energy of heat convection and heat conduction decreases gradually, so the deeper the soil layer was, the smaller the response of temperature to soil temperature was.
The change of temperature in PV power plants may have an impact on vegetation. Plants in desert areas will be stressed by high temperature, and high soil temperature will make the leaves dry during the growing season (Wahid et al., 2007), and not conducive to the growth of plant roots (Nishar et al., 2017), and it also has an adverse effect on soil microbial activities and plant growth (Althoff et al., 2016). PV panels can prevent the adverse effects of high temperature and excessive radiation on plants in arid climates. In a UK grassland PV power plant, the average air temperature and soil temperature under the PV panels in the growing season were cooler compared to the gap between the PV panel rows, by ∼2°C and 4°C, respectively, and the productivity and diversity of plants under the PV panels were reduced (Armstrong et al., 2016). In arid sandy areas, the air temperature above the PV panels was ∼1.67 times higher than that under the PV panels, and the soil temperature under the PV panels was reduced by 3°C, while the plant biomass and species diversity under the PV panels were increased (Liu et al., 2019), which was contrary to the conclusion of the grassland PV power plant. This may be due to the fact that water conditions in arid areas are the key factor restricting the growth of vegetation, and the shading of PV panels provides higher soil water content and lower evaporation (Liu et al., 2019). In addition, change of temperature under PV panels will affect the soil hydraulic properties (Gao and Shao, 2015), which in turn affect the storage and movement of soil moisture, may also provide support for vegetation growth.
Conclusions
To more deeply understand the influence of PV power plants on soil temperature, we conducted field observation on soil temperature of two types of PV panels (fixed-tilt PV panels and OSA PV panels) in desert area for a whole year. The results showed that PV panels had significant effect on soil temperature, as follows: (1) the effect of PV panels on soil temperature was seasonal. In spring, summer, and autumn, PV panels had a cooling effect on soil temperature, while in winter, PV panels had a warming effect on soil temperature; (2) the difference of soil temperature under PV panels was small under different weather conditions; and (3) air temperature, global radiation, and VPD were positively correlated with soil temperature, in which air temperature has the greatest impact on soil temperature, while global radiation has no direct impact on soil temperature under PV panels. Overall, when the temperature was higher, the soil temperature under PV panels was lower; moreover, the influence of the fixed-tilt PV panels on the soil temperature was greater compared with the OSA PV panels. Differences in microclimate and vegetation coverage of PV power plants would also cause differences in soil temperature.
Footnotes
Authors' Contributions
S.Y. designed and performed the research; W.W. and X.Z. were the main technical guidance; and S.Y. and W.W. analyzed the data and wrote the article. L.R and J.W. provided valuable suggestions on the comparative methods. All authors reviewed and approved the article.
Author Disclosure Statement
No competing financial interests exist.
Funding Information
This work was supported by the National Natural Science Foundation of China (Grant No. 51979222 and 91747206).