




Abstract
Enunciatively, antibiotic resistance genes (ARGs) have attracted global attention because of their pronounced dangers on human health or ecosystems. The bacterial community (BC) and ARG profile transmission of the fish/water samples were analyzed under high-throughput (HT)-qPCR. ARGs from different fish samples and different ponds varied significantly. In the same pond type, the ARGs in water outnumbered the ARGs in fish based on 16S rRNA gene copies with significant differences, although their genetic structures were similar based on shared characteristics. The highest ARG removal efficiencies of the five pond types rated 98.08–75.6% for top 6 antibiotics (fluoroquinolone > glycopeptide > tetracycline > aminoglycoside > macrolide–lincosamide–streptogramin B > rifamycin). Majority (33) of shared ARGs were discovered in water, although 14 featured in fish and 7 in both mediums. Fusobacteria (0.5–61%), Bacteroidetes (11–57%), and Proteobacteria (15–53%) dominated other phyla. Spirochaetes, Epsilonbacteraeota, aad7, and mefA demonstrated stronger potential to change ARG structures.
Shared ARG redundancy correlation analyses revealed tighter relationships among Bacteroidetes, Spirochaetes, and Epsilonbacteraeota, which probably favored ARG partitioning. Although 28.07% variations were unexplainable, mobile genetic elements + BC predominantly influenced 35.50% ARG structural changes while transposase resistance genes, and BC contributed 10.90% and 25.44%, respectively. Analyzed ARGs of the entire aquaculture systems demonstrated significant differential characteristics (numbers, relative abundances, and structural distributions) (p < 0.05). The fish and water ARGs detected in this study constitute indicators for tracing ARG contamination in large-scale environments where antibiotics usage is ubiquitous. The findings imply that the entire aquaculture system understudied are hotspots for advanced antibiotic resistome analyses.
Introduction
Misuse of antibiotics has generally become a threatening global health issue due to its association with risks or harmful effects caused to humans and other living organisms because of exposure to antibiotic resistance gene (ARG) contamination in fish ponds. Currently due to their large-scale usage and real or potential damages caused, nations are therefore making concerted attempts to counteract deleterious effects on human health, ecosystems at large (Woolhouse et al., 2016). Apart from using antibiotics as antimicrobial agents to manage infections, it promotes sustainable food production in husbandry and aquaculture in some countries (Hays, 2020).
Wastewater from fish and pig farms contains harmful chemicals and ARGs often transported through several bacterial community (BC), and mobile genetic elements (MGEs) (Yang et al., 2021). Potentially, antibiotics may toxicologically and genetically cause human allergic reactions particularly to exposed fish farmers. Also, long-term exposure to antibiotics particularly intoxicates fish and crustaceans in aquaria beyond the idiosyncratic concentrations (Kovalakova et al., 2020). Although the aquaculture industry demonstrates potential for higher global economic prospects, the abuse of antibiotics, which is rather detrimental to sustainable fisheries development is also likely to affect attainment of the full-scale economic benefits by 2030 (CEA, 2018). Besides, tailored research to address eminent, multiple, and scientific issues such as huge pollution deposits of ARGs is entangled with inadequate reliable methods to help identify and prioritize research (Carey et al., 2020).
Furthermore, several characteristics shared by ARGs are undetermined or yet to be identified in water, fish, and pond bottom sediments (He et al., 2017). Also, current scientific literature about the induced structural changes exhibited through high-throughput (HT) profile transmissions of ARGs from different bacterial community compositions in aquaculture systems is currently limited. Probably, the preliminary investigations on antibiotic residues focused on large-scale aquaculture projects' development conjointly with the marine resources of Italy (Lalumera et al., 2004). Recent investigations unveiled that microplastics constitute antibiotic resistance transmission media based upon preliminary insights from polystyrene-associated bacteria. Synergistic transmission pattern of antibiotics and other chemicals from aquaculture systems (shown in Supplementary Fig. SI-4), has demonstrated high pollution deposits in the Jiulong River watershed, southeastern China, the South Korea Sea, and Bangladesh Sea (Hong et al., 2020).
Also, the stream water sampled in both wet and dry seasons of 2016 showed that 59 out of the selected 94 compounds from 6 pharmaceutical categories were quantified among these stream water samples, up to 1,488 ng/L for caffeine. The central nervous system drugs and antibiotics collectively dominated the pharmaceutical residuals in streams, whereas the outbreaks of humans, aquaculture, and livestock epidemic infectious diseases significantly but partially matched seasonality of the instream pharmaceutical residuals (Hong et al., 2020). The fluoroquinolone residues are reportedly higher in most aquatic environments despite the fact that the usage of antibiotics largely differ on regional bases (Hu and Cowling, 2020).
Antibiotic residues are often minimal in fish culture systems, although higher levels may be detected in fish because of bioaccumulation. This phenomenon was discovered in the Beibu Gulf and concurrently engenders recent scientific research interest (Zheng et al., 2012). The circulation of ARGs is influenced by coevolving physicochemical parameters, such as COD, T, DO, NO3−-N, and heavy metal contaminants such as Zn, Cd, Cu, Pb, Co, and Hg. These variables have also demonstrated significant correlations with ARGs statistically at p < 0.05 (Guo et al., 2018; Tiimub et al., 2021).
Principal component analysis (PCA) of ARGs serves as a statistical method to convert a set of observations with possibly correlated variables into a dataset of linearly uncorrelated variables (Matous, 2016), in environmental pollution trace for contaminants of emerging concerns in public health such as pharmaceutical and personal care products, antibiotics, and their metabolites as well as pharmaceutically active compounds (Lai et al., 2018). However, the insufficiency of current experimental data militates the elucidation of ARG profile transmission updates from specialized entities such as aquaculture systems, where antibiotics are often administered orally to fish or integrated to fish meals and the residues consequently excreted into waters (Mog et al., 2020).
The outcome of this research has enhanced data on ARG pollution sources for elucidation of more accurate results. Although some pollution risk assessment raised evidences of abundant dissemination from poultry and pig farms, it unthoroughly explained the HT profiling and ARG transmission patterns as well as shared relationships of ARGs and its structural change patterns in closer analyses from different fish and water sample types. Thus, special attention must be devoted on the analyses of ARG transmission patterns in fish and water samples because of the synergistic impacts (cumulative effects of the different antibiotic application) on the aquaculture systems. The study objectives were to: (1) investigate the profile characteristics of ARGs in fish and water samples; (2) compare the removal rate (persistence and disappearance) of each kind of ARGs in the four fish pond water supply/treatment types; (3) assess the correlations between BC and ARGs from fish and water samples; and (4) analyze the effect of BCs and MGEs—mainly transposase resistance genes (TRGs) on ARG partitioning.
Methodology
Study sites, sampling, and DNA extraction
The study sites are located in Huzhou, a prefecture-level city in northern Zhejiang Province in the eastern part of China in Asia.
Four species of fish along with 10 different fish pond waters of Huzhou city in Zhejiang Province were sampled once in a month from May to August 2020. The guts of the largemouth bass fish (Micropterus salmoides) (F1), Chinese black carp (Mylopharyngodon piceu) (F2), bream fish (Abramis brama) (F3), and grass carp (Ctenopharyngodon idella) (F4) were used for DNA extraction. As for bass fish, water samples were collected in the entire process of fish farming and wastewater treatment (Fig. 1), including influent of bass fish pond (WIN), outlet water of bass fish pond (WPP), wastewater in the ecological ditch (WED), and effluent of ecological tank (WEFF). The 10 water samples (A–J) (Supplementary Table SI-2.1A), were aseptically collected from 10 to 20 cm below the water surface with sterile 5-L capacity polyethylene containers, refrigerated during transport to the laboratory for analyses within 24 h.

Schematic diagram of sample sites in the entire process of bass fish aquaculture and wastewater treatment system.
Samples for DNA extraction were collected by vacuum filtration of water onto 0.22-μm pore-size nitrocellulose filters (Millipore, USA) until the filter clogged. The total water volume filtered was recorded for subsequent calculations. The membrane filters were carefully transferred to sterile silver paper specimen bags for storage at −80°C. DNA extraction of each filter was performed using a commercial kit (the FastDNA SPIN Kit for soil; MP Biomedicals, Santa Ana, CA, USA) according to the manufacturer's instructions (Zhou et al., 2017).
The purity and concentration of DNA extracts were determined by 1.5% agar gel electrophoresis and spectrophotometry (NanoDrop ND-2000c; Thermo, Waltham, MA, USA). According to the protocol for gel electrophoresis, the use of 1.5% gel is recommended for analyses of smaller DNA (500 bp or less). To achieve this, proportionately more agarose is used. Thus, a 1% gel is 1% weight/volume (w/v), for example, for a 1.5% gel, 0.45 g agarose was added to 30 mL final volume.
Fish gut DNA was extracted from fresh stool samples by gently slit opening the abdominal section of the fish to abduct the intestinal tracts containing the feces using a sharp scissor under aseptic conditions. The feces were emptied into 200-mL tubes for DNA extraction by applying the same MP, biomedical protocol involving the FastDNA SPIN Kit for soil. Extracted DNA concentrations were determined spectrophotometrically using (NanoDrop ND-1000; Thermo Scientific, Waltham, MA, USA) and stored at −80°C before downstream applications.
Physicochemical analysis
Six physicochemical parameters were analyzed, including temperature, pH, dissolved oxygen (DO), total nitrogen (TN), ammonium (NH3-N), and phosphate (PO4+3). All analysis followed standard methods (Mei et al., 2014). Average physicochemical parameters in the entire aquaculture systems within the 3 months ranged from 22.00°C ± 1.53°C to 24°C ± 1.53°C; 7.56 ± 0.33 to 8.69 ± 0.33; and 2.44 ± 2.56 to 9.40 ± 2.56 mg/L for temperatures, pH, and DO, respectively (Supplementary Table SI-2.1A). Other physicochemical parameters' data (TN, NH3-N, PO4+3) about the ponds were captured (Supplementary Table SI-2.1B).
High-throughput quantitative polymerase chain reaction
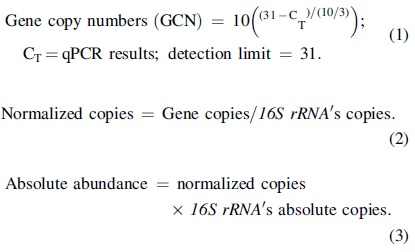
The ARGs and MGEs in 10 fish pond water samples and 4 different fish fecal samples were detected by high-throughput quantitative polymerase chain reaction with TaKaRa SmartChipTM (Zhu et al., 2017). There were 384 primer sets targeting the 16S rRNA gene, 319 ARGs, 57 MGEs, and 7 bacterial taxonomic genes (Supplementary Table S3). The 319 ARGs, including the 12 groups divided by the antibiotics conferred resistance to aminoglycoside, beta-lactam, fluoroquinolone, glycopeptide, multidrug (MD), macrolide–lincosamide–streptogramin B (MLSB), phenicol, rifamycin, sulfonamide, tetracycline, trimethoprim, and others. The 57 MGEs included integrase, and transposase genes. The 100 nL of amplification reaction contains 1 × Light Cycler 480 SYBR Green I Master Mix (Roche, USA), 1 μmol/L forward and reverse primer, 1 ng/μL albumin from bovine serum, 3 ng/μL DNA, and nuclease-free PCR-grade water. Technically each sample was performed in triplicates of quantitative PCRs with a nontemplate negative control under three thermal cycle amplification conditions: (1) initial denaturation, 10 min at 95°C, (2) 40 cycles of denaturation, 30 s at 95°C, and (3) annealing, 30 s at 60°C. Data quality control conditions comprised: (1) the well efficiencies ranging within (90–110%); (2) amplicons without multiple melting curves; and (3) three replicates within the detection limit (a threshold cycle [Ct] of 31).
The normalized copies of ARGs (copies per 16S rRNA gene) were the ratio of the ARG copies to the 16S rRNA gene copies (Zhu et al., 2013). The absolute abundance of each gene was recorded as the product of the normalized copies and the 16S rRNA's absolute copies according to previous applied techniques (Zheng et al., 2018). The absolute copies of 16S rRNA were determined by quantitative real-time PCR described in previous research (Jiao et al., 2018; Zhou et al., 2018). The formulas applied are as follows:
16S rRNA sequencing
The BC compositions in each sample were determined by performing 16S rRNA gene HT sequencing on a HiSeq PE250 platform (Illumina, USA). The PE250 platform of Illumina, USA, enhanced fish and water BC determination under HiSeq. Barcoded PCR was conducted with two universal primer sets: 515F (5′-GTGCCAGCMGCCGCGG-3′) as well as 907R (5′-CCGTCAATTCMTTTRAGTTT-3′) (Supplementary Table S4). These primer sets were strictly applied in conducting the PCR barcoding while targeting the V4 to V5 regions of 16S rRNA gene (Turner et al., 1999). The PCR reaction condition was elucidated in line with standard specifications applied in previous study (Zheng et al., 2017). The DNA of each sample was subsequently sequenced.
High-quality sequencing results were achieved by following recommended guidelines through—trimming of primers, barcodes, adaptor sequences, and removal of low-quality reads. Hence, the final sequenced outputs were properly aligned by clustering into recognizable Operational Taxonomic Units (OTUs) with UCLUST at 97% similarity suggested in Quantitative Insights Into Microbial Ecology (QIIME) (Bolyen et al., 2019).
Data analyses
SmartChip qPCR software (V2.7.0.1) was used to export data to Microsoft Excel 2016 for statistical analysis. Spearman's correlations among 16S rRNA and BCs were examined in SPSS Version 17.5 at p < 0.05 level of significance. Origin 2020 (OriginLab Corporation, USA) was used to construct pie chart, histograms, and line graphs, and the data were correlated using a nonparametric method. The PCoA and redundancy analyses (RDA) generated in CANOCO 5 were used to examine the relationship between BCs and MGEs on the ARG structural changes (Huerta et al., 2013). Procrustes and variation partitioning analyses (VPA) (RDA), were conducted on Vegan while ARG projection performed with Cytoscape (version 3.7.2) was presented on a circus (Oksanen et al., 2014).
Results
Profile characteristics and PCA of ARGs
The relative profile abundances and structural distributions of ARGs in the different fish species are captured as Supplementary Figures (Supplementary Figure SI-1A–1C). The 16S profile abundances (numbers) with corresponding percentages of the 12 distinct ARGs detected from the different analyzed fish pond water and fish sample types are elucidated (Fig. 2A, B). The average number of ARG ranges detected in the fish pond (water) samples of 16S absolute abundance in W1, W2, and W3 were: [W1(1.2E+07), W2(1.1E+07), and W3(1.2E+07)], respectively (Supplementary Table S3). The corresponding ARG types ranging percentagewise in the various water sample types, W1, W2, and W3, also encompassed: (aminoglycoside [21–45%], beta lactamase [0–2%], fluoroquinolone [0.2–17%], glycopeptide [0–0.8%], MLSB [12–27%], multidrug [12–16%], phenicol [0–2%], rifamycin [not clearly detective; NCD], sulfonamide [20–25%], tetracycline [2.5–7.5%], trimethoprim [2.5–9%], and others [NCD]) (Fig. 2A).
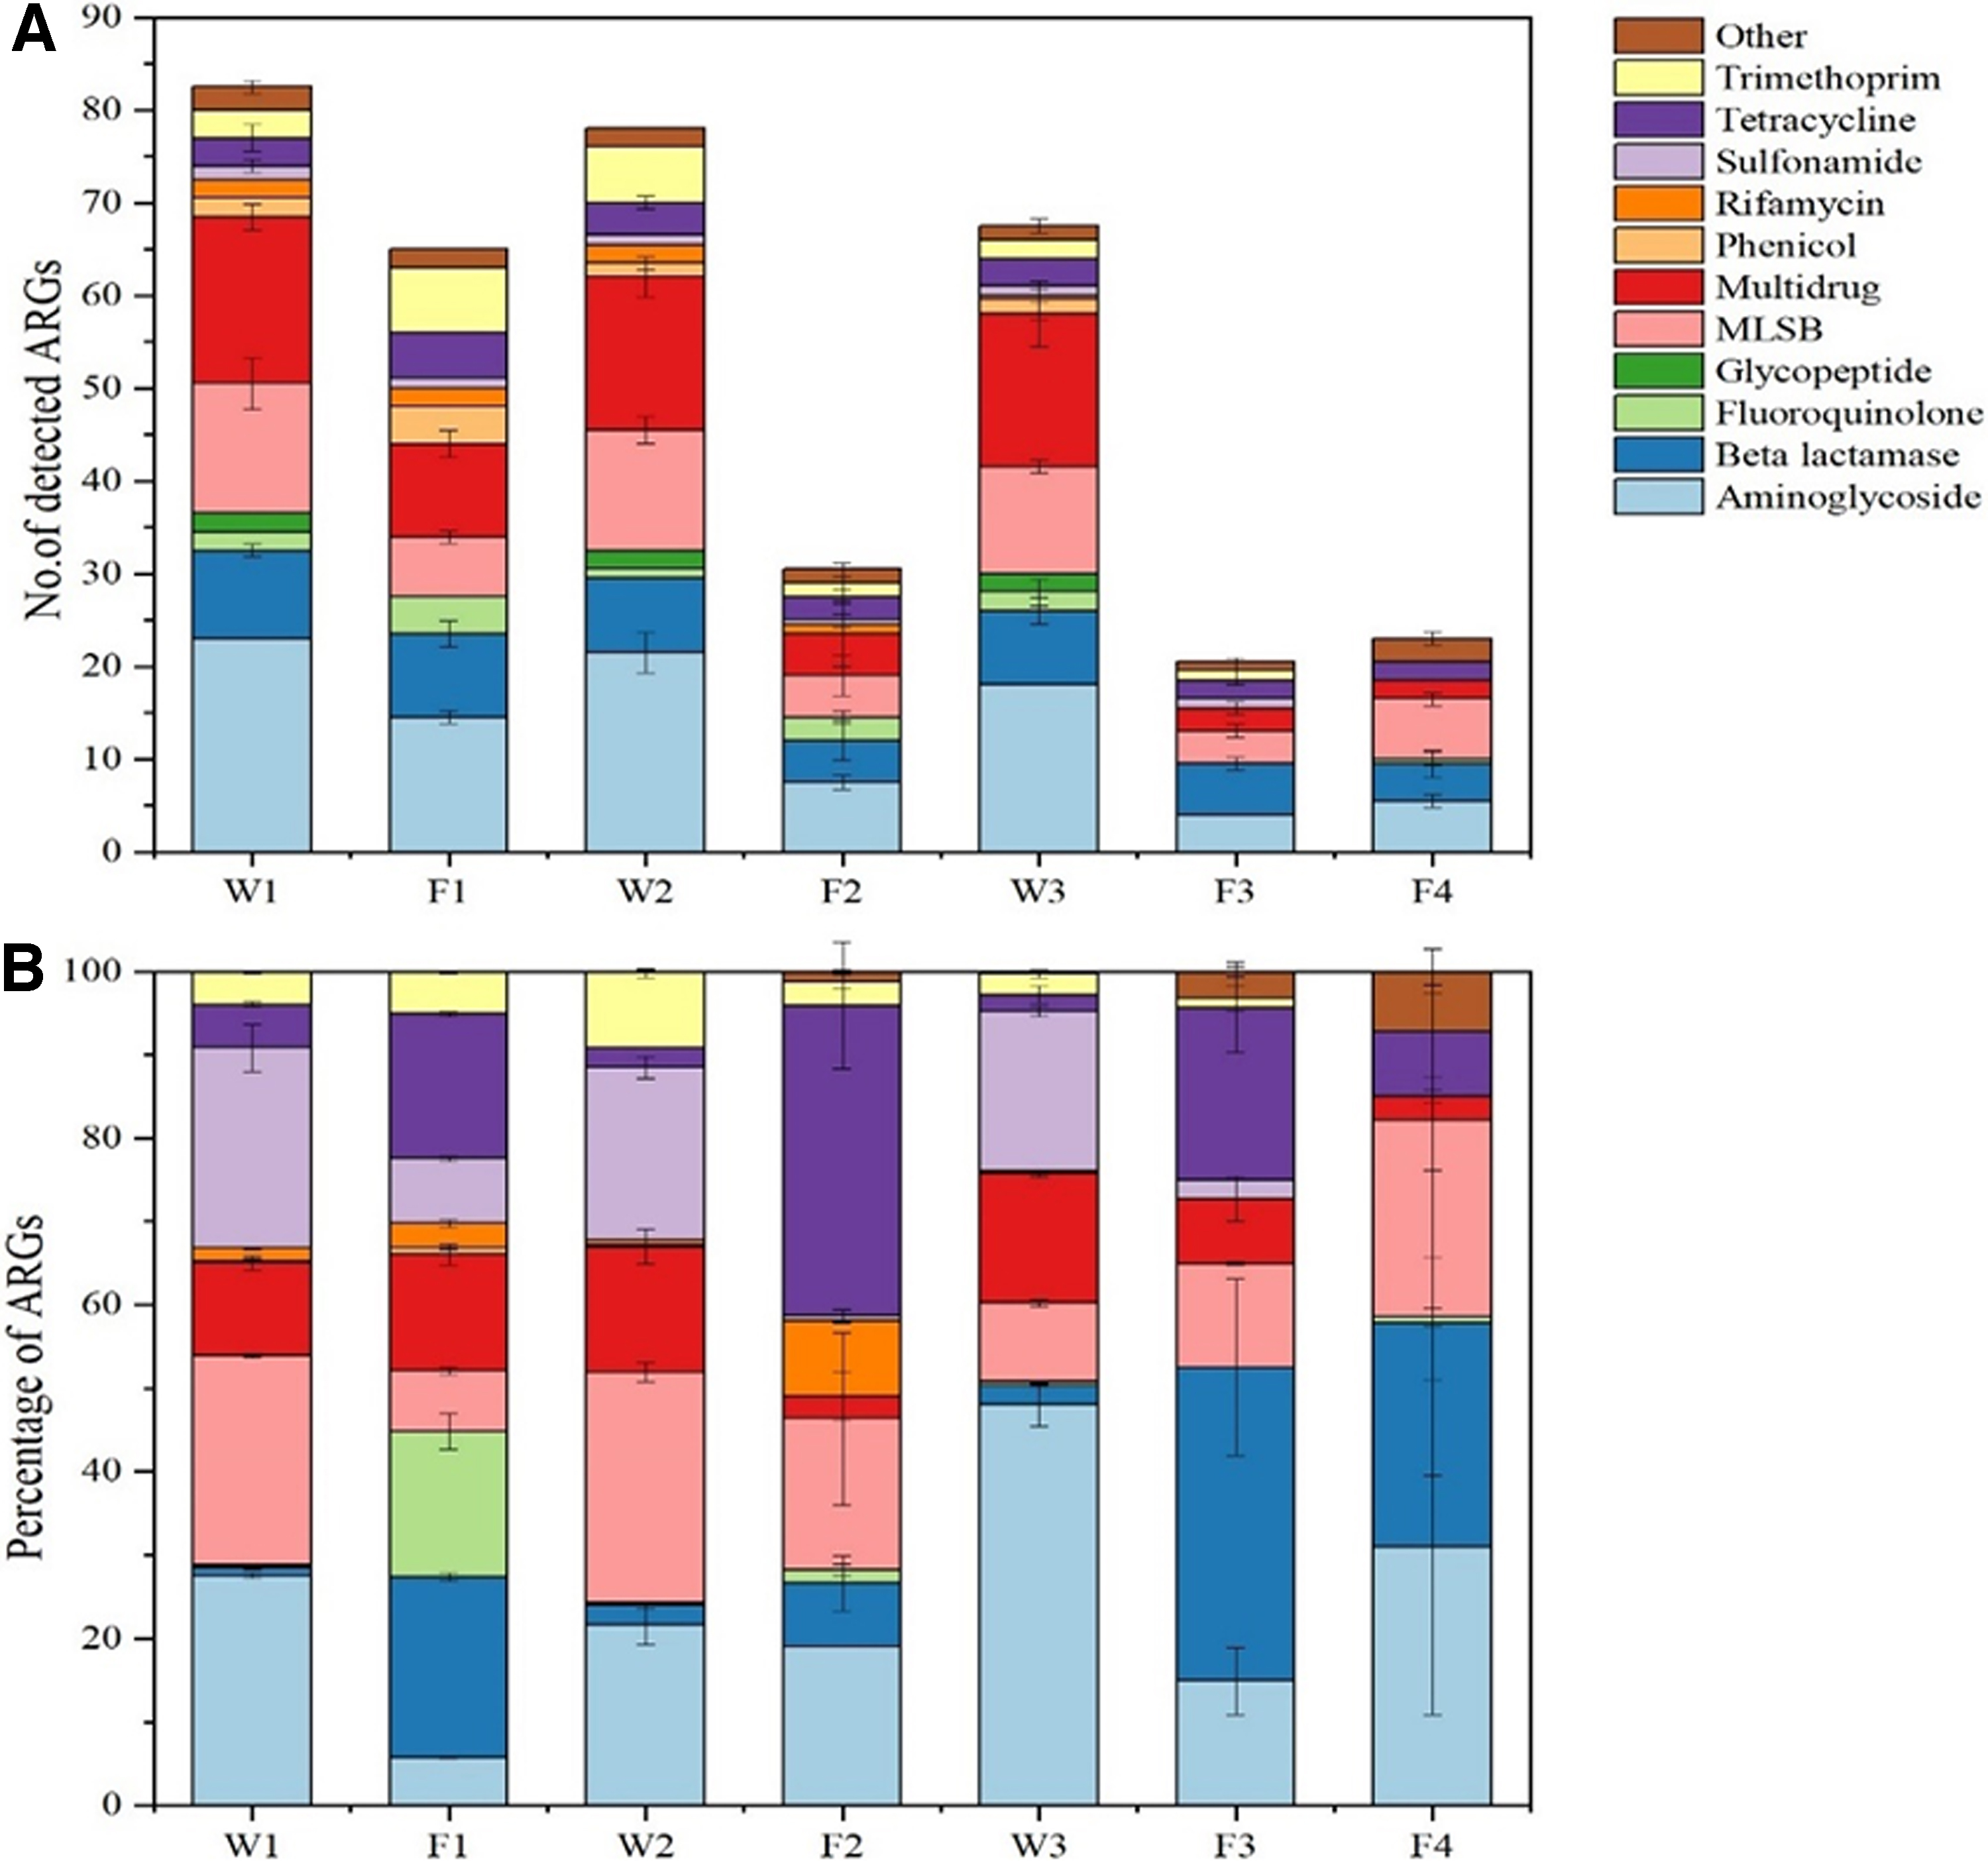
On the other hand, the 16S absolute abundances of the 12 different types of ARGs detected in the 4 fish samples, F1, F2, F3, and F4, were averagely: [F1(9.3E+08), F2(1.7E+07), F3(2.5E+07), F4(1.3E+07)], respectively, from the 16S absolute abundance (Supplementary Table S3). The corresponding average percentage ranges of the 12 ARGs detected in the 4 different fish samples, F1, F2, F3, and F4 on Fig. 2B, were: aminoglycoside (5–25%), beta-lactamase (10–41%), fluoroquinolone (1–15%), glycopeptide (0.5–0.8%), MLSB (0.5–0.7%), multidrug (3–15%), phenicol (0.5–1%), rifamycin (4–14%), sulfonamide (2.5–7.5%), tetracycline (8–38%), and trimethoprim (0.5–5.3%), respectively (Fig. 2B). The data presented elucidate that the numbers, relative abundances, and structural distributions of ARGs were different (p < 0.05) in varying fish species, although that of fish samples F1 and F4 exhibited similarities probably because it featured in the same pond. Furthermore, types of ARGs in the fish were mainly AG, BLA, MLSB, and TC resistance genes (Supplementary Fig. SI-1C).
Similarly, Fig. 2A and B data further project the key findings on the number and structure of ARGs in the fish pond water and the different fish samples in them. In the same pond, concentrations of the ARGs in water were higher than the fish ARG, but their structures (distributions) in both water and fish were almost same. Some ARGs only existed in the fish probably due to the microbial community profiles in them. Supplementary Figure SI-3 in the Supplementary Data captures the findings on principal component analyses (PCA) of the distributed fish and water ARGs based on their oriental patterns (the visible characteristics of the ARGs based on their similarities and differences in four different quadrants).
Most of the water samples were separated apart with the fish samples, implying that, the structure of ARGs between the water and fish exhibited some significant differences. The distribution of ARG principal components (PCs) stretched widely across the breath (PC1 = 62.0%) than along the length (PC2 = 30.5%) of the entire quadrants with bleak representation of ARGs inside the first quadrant from the upper left section. Additionally, some water ARGs agglomerated with the fish samples, thus, demonstrating some intimate relationships or shared similarities between them.
Distinctly, the fish ARG variables, which were dotted in black coloration dominated the entire PCA coverage displayed on Supplementary Fig. SI-3, were clustered in the lower left corner of the first PCA quadrant and directly aligned to the y-axis line at an interval range between 0 and 0.2 on the y-axis and 0–0.2 on the x-axis of the x−y scale. This level of close marking of the fish ARG clusters suggest stronger affinity or closely shared genetic similarities between them in the first PCA quadrant. A similar closer affinity was observed between the clustered fish ARGs on top right corner of the third PCA quadrant with the ARG variables clustered between 0 to −1 and 0 to −1.5 on the x−y axis. However, the fish ARG variables on Fig. 3 and Supplementary Figure SI-3 were sparsely distributed on the top middle portion of the second quadrant with PC variable distribution or coverage between 2.4–6.5 and 0 to −0.2 on the x and y axis of the scale, respectively.

Been separated apart indicates that, the fish ARGs in the second PCA quadrant were genetically so dissimilar in terms of shared characteristics. The entire water ARG variables presented on Supplementary Figure SI-3, covered only a smaller portion on the top right corner of the third PCA quadrant suggesting that, but they were tightly bonded but lower in abundance as compared with the fish ARGs. Strong bonding between the water ARGs suggest they also shared some genetic similarities displayed in deep red coloration within an interval of 0 to −2 in both x and y axis of the PCA (Supplementary Fig. SI-3).
Persistence and disappearance of ARGs in fish ponds
Figure 3A and B captures findings on the persistence and disappearance of each kind of ARG in various types of ponds—namely, (1) WIN-influent, (2) WPP-perch pond, (3) WED-ecological ditch, and (4) WEFF-effluent. The net ARG profiles in WPP dominated the WIN, probably because WPP contained fish. Also, the line chart elucidates removal efficiency of various ARGs in the four pond types (Fig. 3B).
The ARG persistence and disappearance (removal rate) based on highest and lowest potential removal efficiencies were clearly analyzed and the trend graphically depicted in blue above the bar charts (Fig. 3B). The highest ARG removal efficiency of the five pond types rated 98.08–75.6% for top 6 antibiotics (FQ (98.08%) > GP (96.31%) > TC (78.52%) > AG (77.68) > MLSB (75.77%) > RIF (75.60%). About 33 shared ARGs in water, 14 in fish, and 7 in both fish and water were discovered. Multidrug and beta-lactam in the upper mid-range demonstrated the next highest ARG removal efficiency rate of about 58.3% and 52.29%, respectively. Also, trimethoprim (49.3%), sulfa (43.7), and the others (18.1%) at the lower upper middle range, respectively, demonstrated lower ARG removal efficiencies, except in the WEFF-water type, where the removal rate was approximately lowest and negative for Phenicol (−72.644). It is suspected that ARG's introduction into these ponds may further result from fingerling introduction during stocking into the ponds in the entire aquaculture process (Fig. 1). The extensive use of antibiotics in aquaculture contributes to water and sediment contamination and the development of ARGs (Supplementary Fig. SI-4).
Shared, exclusive, and other fish sample ARGs discovered in the same pond
The supporting information Supplementary Figure SI-2 accounts for the shared (occurring in both water and fish samples at the same time), exclusive (occurring only in the water or only in the water samples at a given time), and other ARGs (F3 and F4) discovered in the same pond (corresponding to water sample W3). The entire water samples analyzed shared 33 gene couples (which existed in all water samples). The fish samples also shared 14 genes (found in all fish samples), whereas 7 genes were shared in the entire water and fish samples (Fig. 4). The other ARGs in F3 and F4 were detected in the same pond (corresponding to water sample W3). The shared genes accounted for 23.9% and 37.1% of the total ARG abundance in the two fish and 4.4% of the water samples (Supplementary Fig. SI-2). This reveals that about 1/3 of the ARG's absolute abundances in the background fish samples are contracted from pond waters of the entire aquaculture systems.

Shared ARG (33 in water, 14 in fish and 7 in both water and fish) samples.
The BC structure of selected water and fish samples
The majority BC structure phyla in the selected water and fish samples are presented (Fig. 5). Estimated numbers of the BC in the selected water and fish samples are similarly captured (Table 1). In the 7 selected BC structures comprising 3 water (W1; W3; W3) and 4 fish (F1; F2; F3; F4) samples, 14 different majority bacteria phyla featured prominently at varying levels of net distributions.
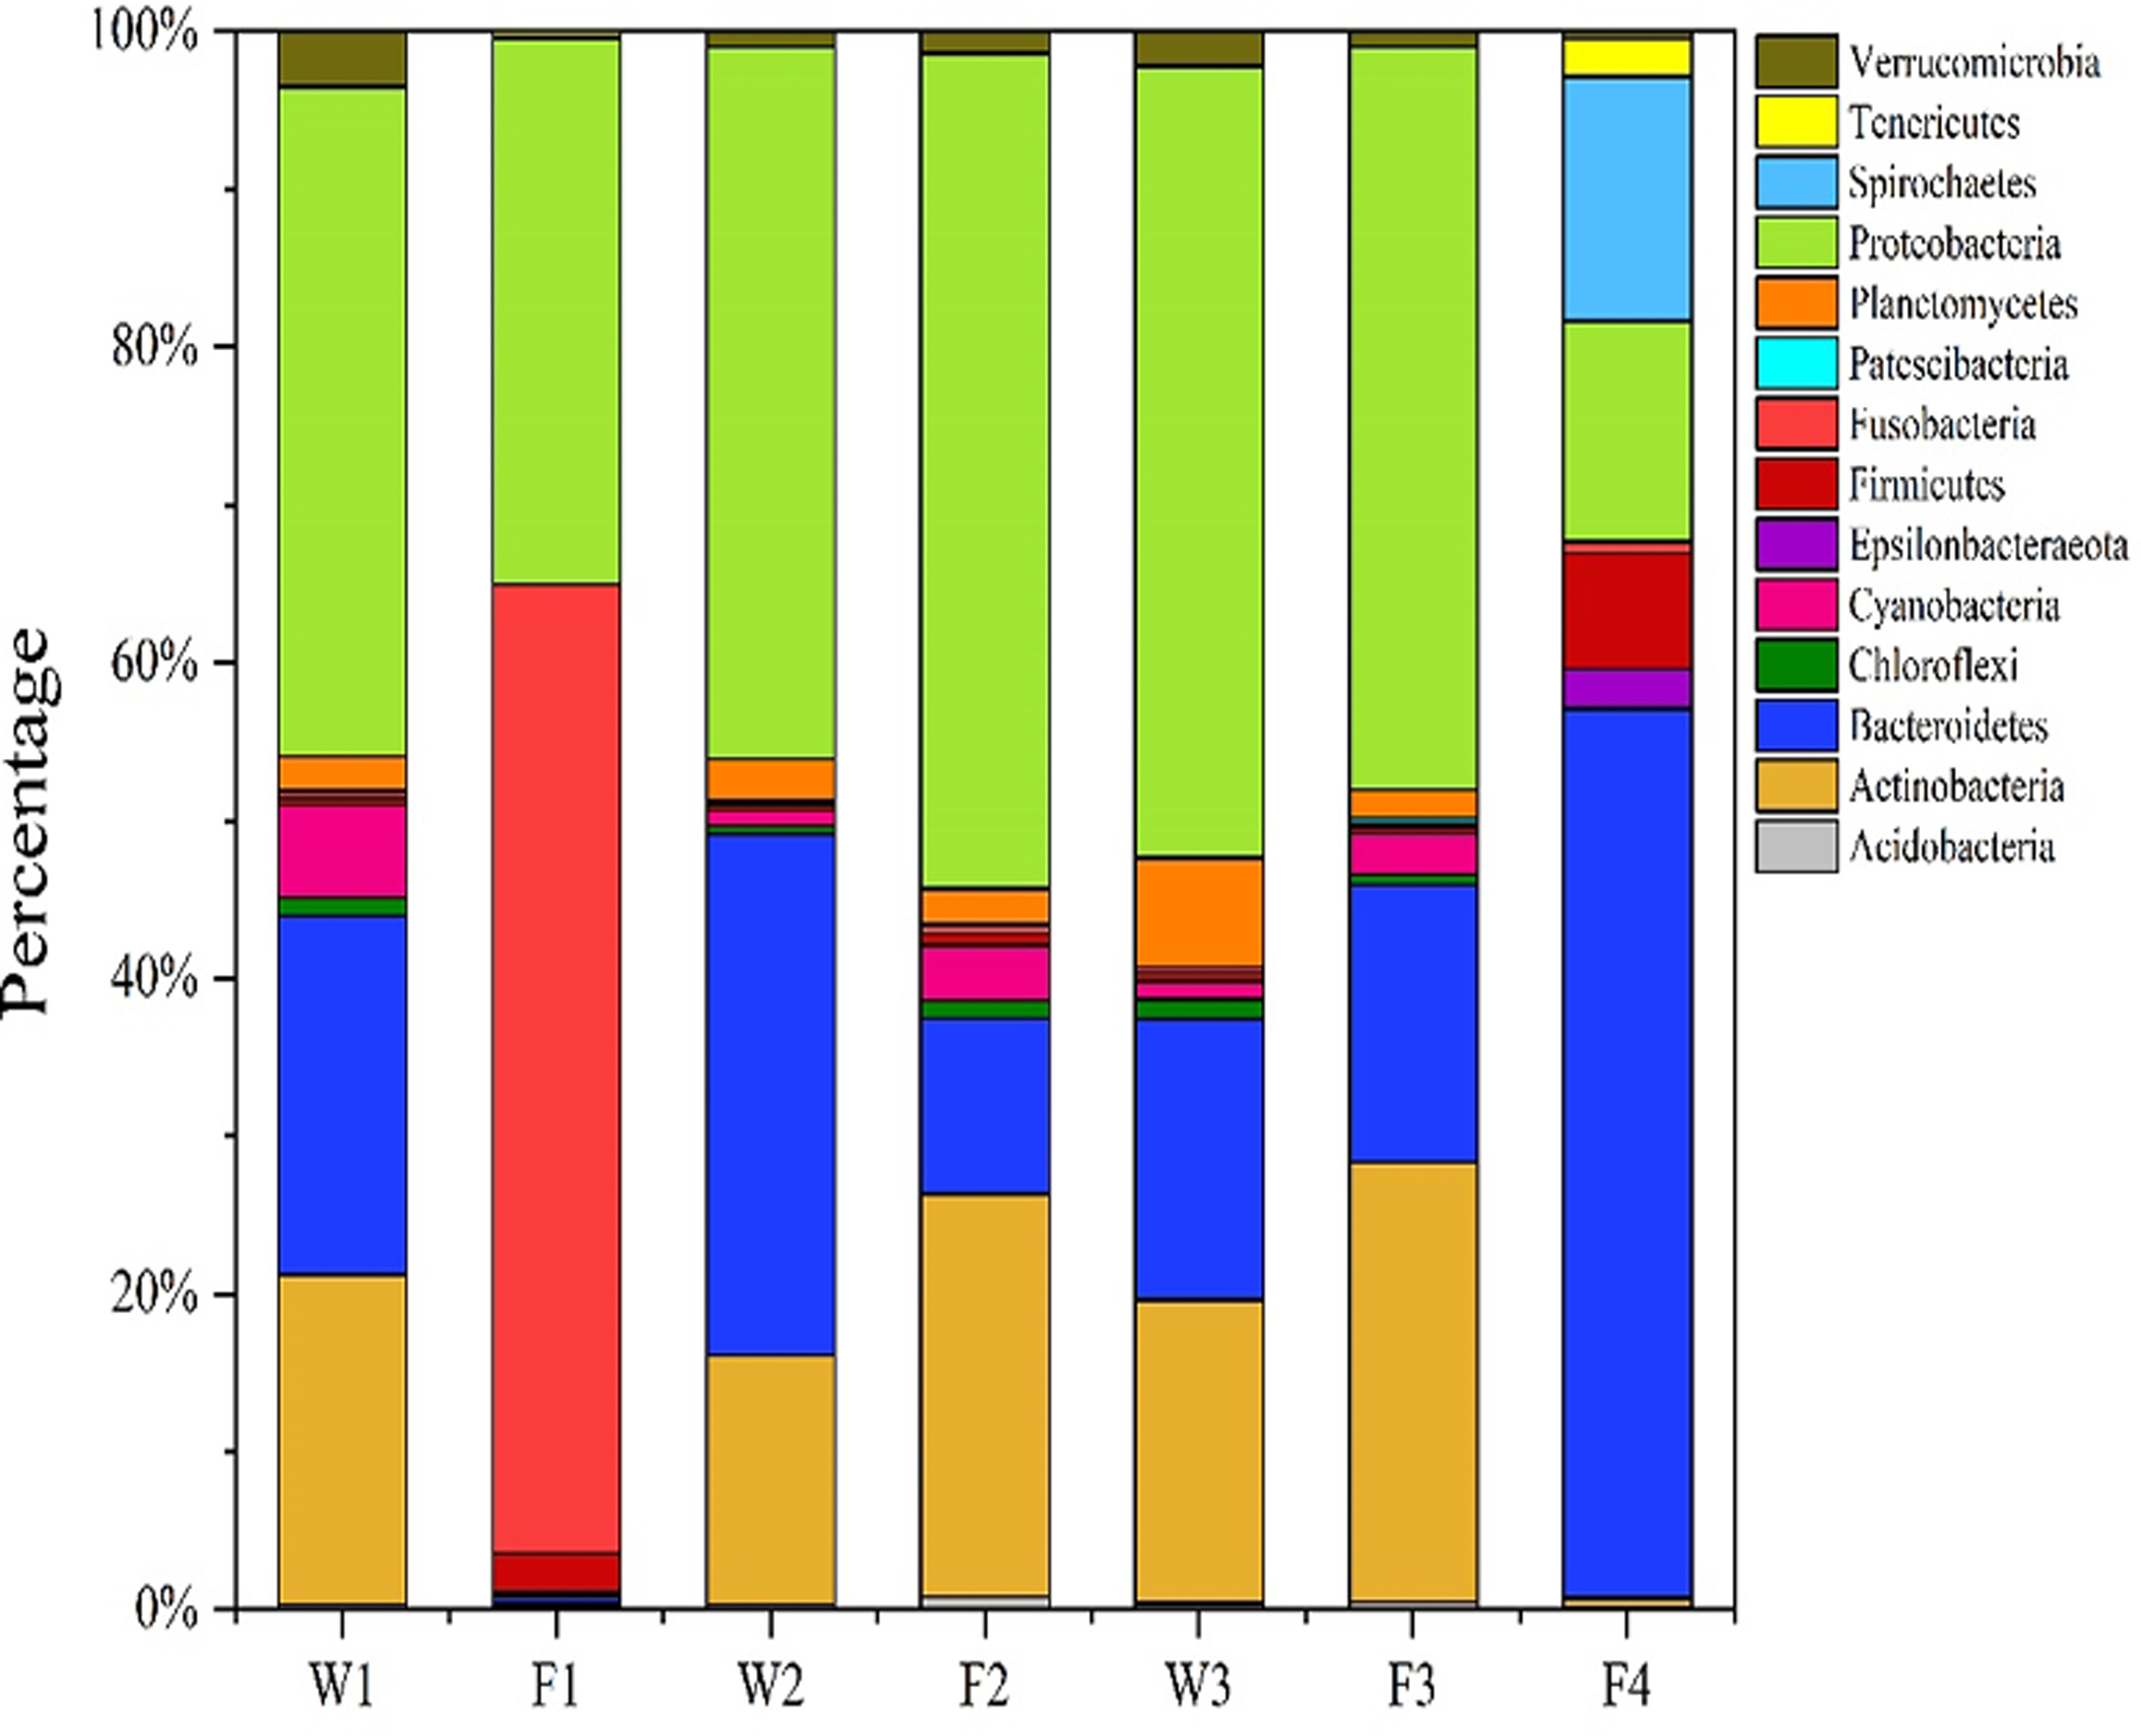
The BC structure of the 7 selected samples exhibiting the 14 majority phyla. BC, bacterial community.
Majority Bacterial Community Phyla in the Selected Water and Fish Samples
BCC, bacteria community composition; ACI, Acidobacteria; ACT, Actinobacteria; BAC, Bacteroidetes; CHL, Chloroflexi; CYA, Cyanobacteria; EPS, Epsilonbacteraeota; FIR, Firmicutes; FUS, Fusobacteria; GEM, Gemmatimonadetes; PAT, Patescibacteria; PLA, Planctomycetes; PRO, Proteobacteria; SPI, Spirochaetes; TEN, Tenericutes; VER, Verrucomicrobia.
Network exclusive structural distributive prominence (occurrence of majority BC phyla) as featured in the entire water and fish samples analyzed were approximately in the order of [Fusobacteria (0.5–61%, dominating in sample F1, F4 but not apparently visible in the other samples) > Bacteroidetes (11–57% in all samples, except F1) > Proteobacteria (15–53% of entire samples) > Firmicutes (0.5–11% of entire samples) > Cyanobacteria (0.5–6% of entire samples, except F1 where it disappeared) > Planctomycetes (0.5–2.5% of all samples, except F1 and F4) > Chloroflexi, which appeared faintly (0.5–1%) in W1, W2, and W3, as compared with (< 0.8%) in F2 and F3 > Verrucomicrobia (0.1–0.6%) in F1 and W3, but not so apparently visible in other samples]. Although the Spirochaetes and Tenericutes phyla covered 16.5% and 2.6%, respectively, and were both apparently visible in sample F4, Patescibacteria (<0.5%) only appeared faintly in fish sample F2, and its seclusion therein suggests the potentiality for further discriminatory bacterial analyses in an attempt to determine the specific pond conditions that promote their selective developments (Fig. 5).
Further ARG analyses of the majority BC phyla in selected water and fish samples may be able to affirm whether the fish samples F4 and F2 actually bear the marked potential target genes for elaborate comparative analyses on Spirochaetes and Tenericutes from the F4 DNA and the Patescibacteria in F2 DNA. This may further enhance selective Spirochaetes, Tenericutes, and Patescibacteria replication response studies within ARG structures in the entire aquaculture systems (Fig. 5). Alternatively, the first 3 most preponderant phyla (Fusobacteria, Bacteroidetes, and Proteobacteria at 61%, 57%, and 53%, respectively, in both water and fish samples) could also be targeted for further dominant bacteria characterization in the fish ponds.
Scientifically, this current discovery from field-based larger conventional fish pond water and fish samples corroborate well with the findings of our progressive laboratory investigations. The ascertained results justify the previous recommendation about the high selective prospects of most dominant Proteobacteria for high-throughput profiling of the transmission of ARGs in aquaculture systems based on its similarity with cooccurring BC phyla or highest abundance relative to other bacterial phyla when both field and laboratory analytically confirmed results are compared.
Structural relationship between BCs and ARGs
A circus visual projection of the correlation between BCs and ARGs is captured (Fig. 6). Structures of the majority BC phyla of the seven selected samples apparently found in four fish and three water samples were analyzed. These 14 phyla served as majority phyla detected from the entire aquaculture system (Fig. 6).

A circus projection of the correlation between 14 BC and 12 ARGs types detected in fish and water samples of the aquaculture system.
In the projected circus, all the effects on the right side of the ring presents the different types of ARGs, whereas the left side effects of the ring demonstrate the BC phylum. Both the ARGs and BC phylum were positively correlated in the data displayed (Fig. 6). All circa data with zeros implies that the BC were noncorrelated with any types of the ARGs in the circus. The level of change in numbers of BC phylum were explained based on the number of lines in them, which indicates how it can affect the ARG changes. More and wider circa lines exhibited by BC phylum further imply they have stronger correlations with higher impact (ability to affect or initiate changes) on specific corresponding ARGs and vice versa. The number, level of deepness, and largeness (wideness) of the colored ring exhibits also confirms that there are significantly stronger existent correlations between the BC phyla and ARGs displayed (Fig. 6). Alternatively, faint colored and thinner networked relationship illustration between BC phyla and ARGs indicates weak correlations between the BC phyla and ARGs.
Patescibacteria has demonstrated the most significant (deepest blue) positive hotspot correlations with seven of the ARGs. Genes demonstrated hotspot correlation capacities to confer resistance to trimethoprim, sulfonamide, beta-lactam, rifamycin, fluoroquinolone, multidrug, tetracycline in respective percentages of 35–40%; 25–30%; 15–20%; 10–15%; 10–15%; 10–15%; and 10–13% within the width length networked fabrics (Fig. 6). The correlation between Planctomycetes and Glycopeptide as well as Proteobacteria and Glycopeptide at 20–25% and 10–12% enunciated their capacities to directly impact, affect, or initiate changes on specific ARG structures. These levels of correlation were also found to be very strong (deep) as compared with the rest of light blue networks. Succinctly, there was a distinctly stronger (deeper green) correlation between the Actinobacteria and rifamycin (30–35%), as well as Actinobacteria and trimethoprim (15–20%), revealing the capacity of the two BC phyla to change the ARG structures as compared with the other light green BC and ARG network fabrics demonstrated in the circus (Fig. 6).
Effect of BCs and MGEs on ARG partitioning
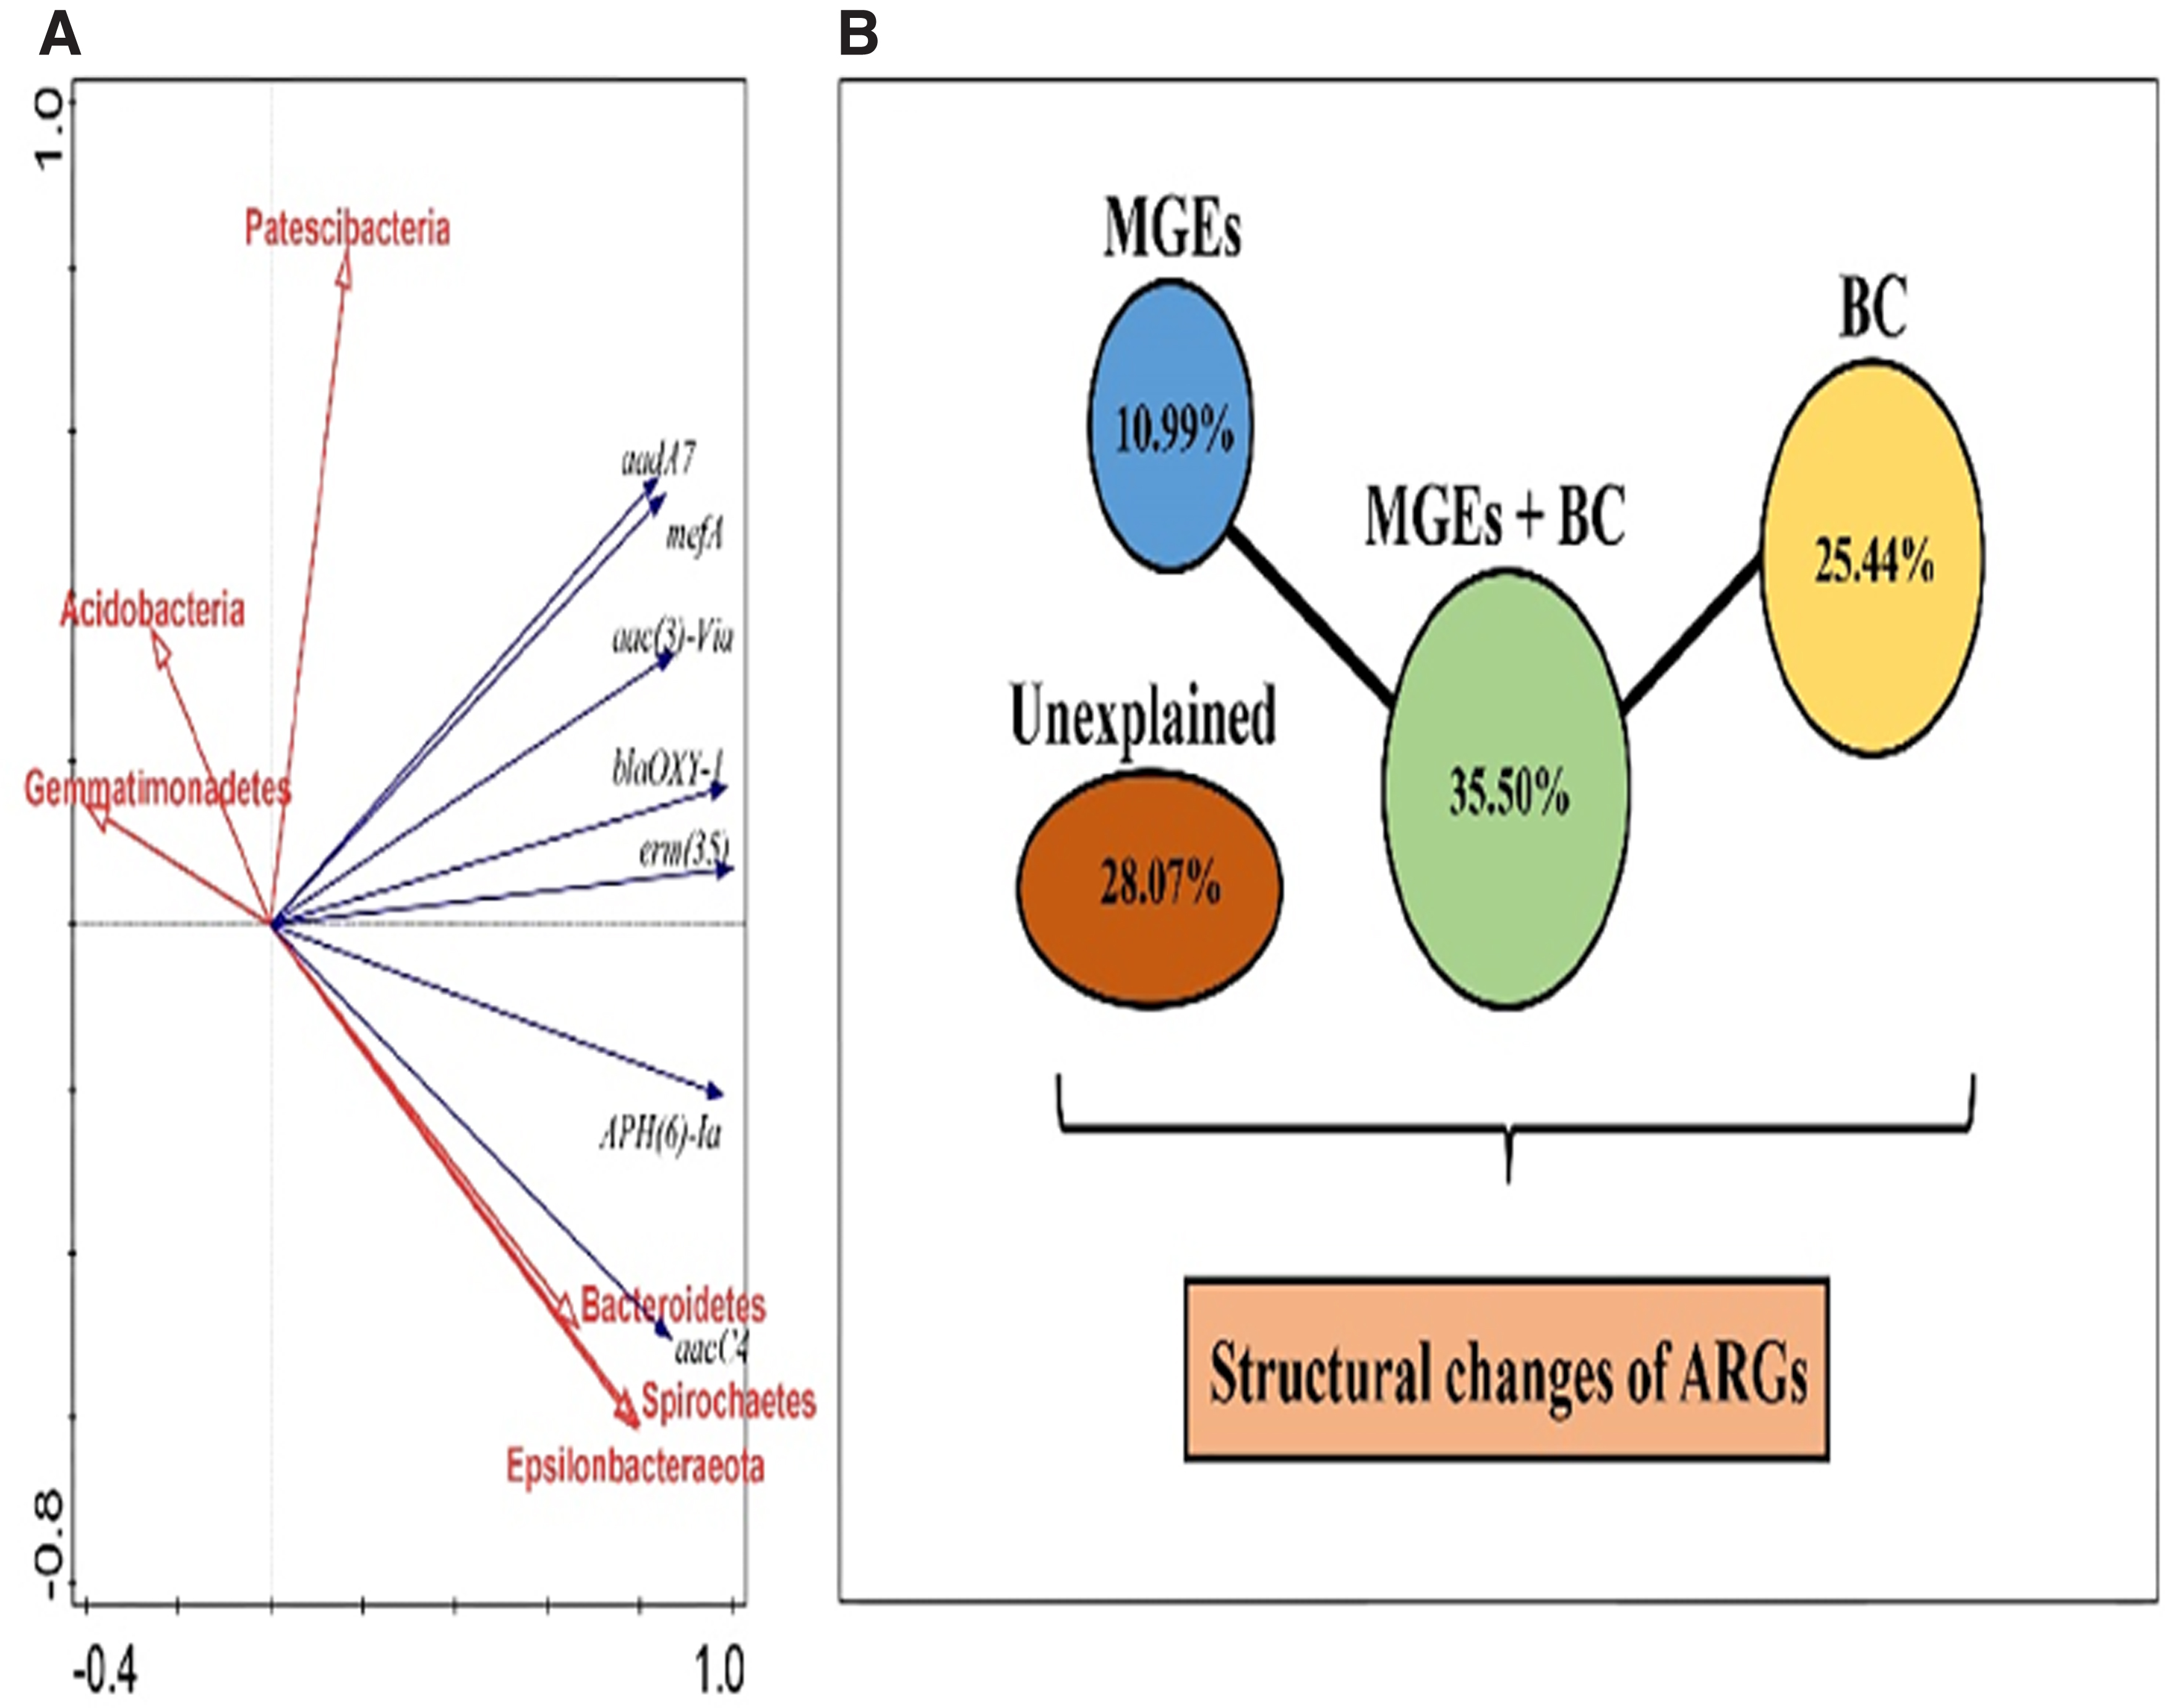
The results of redundancy analysis (RDA) of the 7 shared ARGs and the 14 majority phyla are captured on Fig. 7A with their detailed numerical data in the selected 3 water samples and 4 fish sample types displayed (Table 2). The RDA clearly indicate correlations of the 7 shared ARGs in the water and fish samples and 14 majority BC phyla from the water and fish sample partitioning analyses. Among the six majority BC phyla correlates of the seven water and fish sample ARGs, three of the BC phyla from the upper right section of Fig. 7A namely, Patescibacteria, Actinobacteria, and Gemmatimonadetes, respectively, were positively correlated with 5 of the shared ARGs encompassing (aadA7, MefA, aac (3)-Via, blaOXY-1, and erm (35) at vertical correlation intervals of between y ≤ 0.40 and y ≤ 1.00, and a horizontal correlation interval of x ≤ 0.78 to x ≤ 0.98 in the upper right section of the RDA.
Average Absolute Abundances of the Seven Antibiotic Resistance Genes Phyla Discovered from RDA of the Water and Fish Samples
Water samples include (W1, W2, W3, W4) and fish samples include (F1, F2, F3, F4).
ARG, antibiotic resistance gene; RDA, redundancy analyses.
The ARG partition correlation analyses between the other three majority BC phyla comprising (Bacteroidetes, Spirochaetes, and Epsilonbacteraeota) in the water and fish samples demonstrated a negative correlation pattern of the three BC phyla with two of the ARGs (APH(6)-1a, and aac(4)), respectively, at vertical correlation interval of y ≤ −0.20 and y ≤ −0.08 and horizontal interval of x ≤ 0.94 and x ≤ 0.98, within the lower right section of the RDA in Fig. 7A. Estimated numbers of the majority BCs [(aac(3)-Via, aadA7, aacC4, APH(6)-Ia, blaOXY-1, erm(35), and mefA)] in the analyzed water samples (W1, W2, W3, and W4) and fish samples (F1, F2, F3, and F4), were annotated in terms of their average absolute abundances detected in the ARG RDA results summarily presented (Table 2).
Alternatively, the partitioning responses of the seven shared ARGs and six majority BC phyla portrayed, differentiated those with similarities in the same quadrants, whereas those with significant differences were separated apart. Both Acidobacteria and Gemmatimonadetes demonstrated stronger correlation with Patescibacteria, although the effect of the later was much greater on ARG response to structural changes than the former in the upper left quadrant within an interval scale of 0.40 ≤ x ≤ 0.55 horizontally on the x-axis and 0.40 ≤ y ≤ 0.95 vertically on the y-axis, respectively (Fig. 7A). The aad7 and mefA were closely correlated with almost the same level of response and demonstrated similarities with aac(3)-via, bla-OXY-1, and enn(35), which were not so closely correlated to each other but triggered similar degree of ARG structural transformations from the middle to upper right sections of the second quadrant within a scale interval of 0.5 ≤ x ≤ 1.0 horizontally on the x-axis and 0.5 ≤ y ≤ 1.0 vertically on the y-axis (Fig. 7A). In the lower upper section of the RDA, APH6.la and aac(4) demonstrated closer similarities in their inductive ARG structural transformational capacities with atypically weak correlations among them.
In the extreme lower section between interval scale of 0.5 ≤ x ≤ 0.9 horizontally in the x-axis, there was closer similarity with stronger synergistic positive correlation between the three majority ARG phyla. The tighter relationship among Bacteroidetes, Spirochaetes, and Epsilonbacteraeota synergistically engendered the ARG structural variations, even though, individual impacts were severely inflicting by the latter two, which critically triggered same-level responses to ARG structural changes. The analyses proved that Spirochaetes and Epsilonbacteraeota exhibited stronger positive correlation with almost equal potential to trigger circular ARG structural transformations in the aquaculture systems and should be earmarked for deeper screening of their distinct characteristics at the higher molecular level, similar to that of aad7 and mefA, which demonstrated high potentials toward ARG structural mutilations.
The unique characteristics of these five most strongly correlated majority BC phyla in the two categories that it featured should further be analyzed to determine the factors that promote its development and high impact on ARG structural variation response rates. The effect of feeds or fish interactions with other evolutionary physiographic factors may have also influenced the pond water quality for triggered fish responses to some change mechanisms that cause high-throughput profile transmission of the ARGs bound to DNA of the entire aquaculture system. The ARG structural changes were determined by the VPA, whereby, effects of the BCs, TREs, BC + MGEs (mainly TRGs), and other unexplained factors are illustrated (Fig. 7B).
It revealed that, ∼28.07% phenomenal ARG structural changes were unexplainable and suspected on variations in the pond microenvironmental conditions and other unidentified factors. However, the bacterial community served as the single predominant factor that accounted for some 25.44% of ARG structural mutilations, whereas the MGEs alone, and MGEs + BC, respectively, contributed to 10.99% and 35.50% of the ARG structural changes in the entire aquaculture system (Fig. 7B).
Discussion
Different fish sample ARGs from different ponds varied significantly. Averagely, the 16S absolute abundances of the 12 different types of ARGs detected in fish samples F1, F2, F3, and F4 were: [F1(9.3E+08), F2(1.7E+07), F3(2.5E+07), and F4(1.3E+07)], respectively, with correspondent 12 ARG percentages: (aminoglycoside [5–25%], beta-lactamase [10–41%], fluoroquinolone [1–15%], glycopeptide [0.5–0.8%], MLSB [0.5–0.7%], multidrug [3–15%], phenicol [0.5–1%], rifamycin [4–14%], sulfonamide [2.5–7.5%], tetracycline [8–38%], and trimethoprim [0.5–5.3%]), respectively (Fig. 2A, B). The data presented elucidate that the numbers, relative abundances, and structural distributions of ARGs were different (p < 0.05) in varying fish species. The 16S absolute abundances of the 12 different types of ARGs detected in the water samples W1, W2, and W3 averagely numbered: W1(1.2E+07), W2(1.1E+07), and W3(1.2E+07 with corresponding ARG types in them ranging percentagewise: (aminoglycoside [21–45], beta-lactamase [0–2%], fluoroquinolone [0.2–17%], glycopeptide [0–0.8], MLSB [12–27%], multidrug [12–16%], phenicol [0–2%], rifamycin [NCD], sulfonamide [20–25%], tetracycline [2.5–7.5%], and trimethoprim [2.5–9%], and others not commonly detected) (Fig. 2A, B).
The AG, BLA, MLSB, and TC resistance genes were predominant in the fish samples as compared with the water samples. Microbial community shifts are found to have directly promoted ARG variations in aquatic environments (Yu et al., 2020). In this current study, the ARG PCs in the fish and water samples were widely distributed in fish and water samples, whereas some ARGs agglomerated on the bases of shared similarities. Natural and spatiotemporal factors may affect niche adaptation, whereas artificial pond enrichment impart shared ARG principal characteristics to aquaculture systems (Lu et al., 2020). Sharing of ARGs among wild fish guts and water DNA extracts of polluted rivers was recently showcased in China (Zhou et al., 2021a, 2021b), thereby confirming the earlier suggestion that higher ARG profile transmissions spiral different environmental mediums (Wang et al., 2019). The results imply that the understudied urban bass fish ponds with adjoining influent, ecological ditch, and effluent compartments are hotspots for analyses of antibiotic resistome.
The results on Fig. 2A and B further demonstrated key findings on the number and structure of ARGs in the fish pond water and the different fish samples in them. In the same pond, concentrations of the ARGs in water were higher than the fish ARG, but their structures (distributions) in both water and fish were almost same. Some ARGs only existed in the fish probably due to the microbial community profiles in them. Supplementary Figure SI-3 illustrated the findings on principal component analyses (PCA) of the distributed fish and water ARGs based on their oriental patterns (the visible characteristics of the ARGs based on their similarities and differences in four different quadrants). Most of the water samples were separated apart with the fish samples, implying that, the structure of ARGs between the water and fish exhibited some significant differences. Apparently, the highest ARGs removal efficiency rate demonstrated by the top 6 antibiotics in both fish and water samples was up to 98.08%. Antibiotics, microplastics, and heavy metals synergistically determine ARGs transferase in aquaculture systems (Dong et al., 2021).
Several health risks of antibiotics, heavy metal usage in husbandry and aquaculture systems recently demonstrated relationship complexities whereby, most ARGs detected in human guts were also found in fish guts, pond waste water, livestock, poultry and wildlife species (Graham el al., 2019; Zhao et al., 2020). The introduction of fish meals into fish ponds can constitute a medium for further ARGs pollution and may have accounted for the detected ARGs in the conventional aquaculture systems at Huzhou. Recent laboratory analyses of the characteristics of bacteria community and ARGs profile in 12 engineered goldfish tanks with tresses of sulfanilamide and copper, enriched with the identical quality Badun feed which is commercially applied to the conventional fish ponds revealed Sul 1 and Intl 1 genes and different discriminatory bacteria pollution in them (Tiimub et al., 2021).
Touching further on the ARGs relative abundances, the data presented elucidate that, relative abundances and structural distributions of ARGs were different (p < 0.05) in varying fish species, although fish samples F1 and F4 exhibited similarities probably because it featured in the same pond. Further, types of ARGs in the fish were mainly AG, BLA, MLSB and TC resistance genes (Supplementary Figure SI-1C) in them. Supplementary Figure SI-3 illustrated the PCs of the distributed fish and water ARGs based on their characteristic similarities and differences in four different quadrants. Most of the water samples were separated apart with the fish samples, implying that, the structure of ARGs between the water and fish exhibited significant differences at p < 0.05 level of probability. The 33 shared ARGs detected in fish and water sample analyses can serve as indicators for tracing the ARG contamination in aquaculture systems (Du et al., 2019). Stochastic processes dominating ARG compositions are capable of influencing their systemic large-scale transmission because of random horizontal gene transferase facilitated by MGEs (Hou et al., 2021).
Following analyses of BC structures, the majority phyla sequenced in water/fish samples were Fusobacteria, Bacteroidetes, and Proteobacteria. ARG preponderance in aquaculture systems may result from oral administration of antibiotics to fish or its utilization as improved growth performance feed additives (Sáenz et al., 2019). In recent studies, Proteobacteria and Bacteroidetes featured asynchronously as the dominant phyla harboring most of the ARGs detected, compared with lower Planctomycetes and other BC phyla in the aquaculture systems in which manuring or fertilization and heavy metal pollution determine water quality (Shen et al., 2020). The three dominant bacteria constitute targets for prospective antibiotic risk exposure analyses (Kim et al., 2018).
The relationship between BC structure and ARGs has demonstrated that Patescibacteria exhibits a stronger, positive significant hotspot correlations with seven ARGs in the entire aquaculture system, probably because of its higher potential to attach with migratory fish. Resistome and microbiome analyses reveal that MGEs could significantly trigger transmission of ARGs in freshwater aquaculture systems (Xu et al., 2020). Resistome analyses between different aquaculture systems hinted that cooccurrence of Patescibacteria in higher abundances with ARGs is probably caused by fish migratory interactions with water, sediments, nutrients (Cao et al., 2020), or increased usage of antibiotics as nutritional additives in aquaculture (Mog et al., 2020).
Redundancy analyses between shared ARGs and the majority phyla proved tighter correlations among Bacteroides, Spirochaetes, Epsilonbacteraeota Spirochaetes, Epsilonbacteraeota, aad7, and mefA, which promote ARG partitioning (can be earmarked for deeper screening of their distinct characteristics) at the higher molecular level. Partitioning of ARGs can be influenced by response to selective pressures in the water, horizontal factors, human pathogens, and aquatic bacteria that release antibiotics into the aquaculture systems (Gufe et al., 2019). Also, NH3, CuSO4 II, ZnSO4 II, and other chemical compound stresses in ponds trigger ARG structural changes (Zhang et al., 2020). Structural equation modelling elucidates that geographical location and sample types (fish, pond water, reservoirs, river) can directly influence ARG partitioning by altering the antibiotic concentration and BCs (Han et al., 2020a, 2020b).
Evolutionary physiographic factors influencing pond water quality may trigger fish response to change mechanisms that cause high-throughput profile transmission of ARGs bound to eDNA circulars of aquaculture systems (Yang et al., 2019). Some eDNA analyses in typical estuary regions reveal that rivers or fresh water resources are immediate conveyor belts for biodiversity information (Yuan et al., 2019). The current study established that, aquaculture systems deriving water intake from urban rivers are main channels for ARGs' HT profiling and transmission. This garners baseline information for advanced climate change, pollution risk analyses, and taxonomic characterization of aquatic species richness toward achievement of the hottest of hotspot conservation targets (Amoroso, 2000; Tong et al., 2020). The VPA of BC can facilitate advanced projection of ARG characteristics in aquaculture systems when particularly interspersed with seasonal monitoring (Yi et al., 2021).
Phenomenal ARG partitioning was predominantly caused by the combined effect of MGEs (mainly TRGs) and BC, which contributed to 35.5% ARG structural changes from the results highlighted; and three of the ARG-associated BC (Fusobacteria, Bacteroidetes, Proteobacteria effects) also dominated ARG partitioning in RDAs in the current report. At variant overlapped lotus ponds, pig, fish, and duck farms, BC of the ARG sequences were found to be similar from RDA responses, although their structural evenness and diversity were more significantly differed with habitat type (Zhou et al., 2019). Tentatively, unidentified or unexplained factors of phenomenal ARG structural mutilations can be suspected on the synergistic impact of little or sharp variations in the microenvironmental conditions (Ouyang et al., 2020).
Conclusions
Summarily, this study clearly demonstrates the impact of five different fish pond types of an aquaculture system with four types of compartments comprising (WIN, WPP, WED, and WEFF), on the ARGs transformed characteristics of fish and water samples as affected by the BC. Same water ARGs with structural similarities predominated fish samples and were significantly differentiated from them. Highest removal efficiencies (occurrence and disappearance) in water/fish for top 6 ARGs detected suggested that both sample types could reliably complement advanced, high throughput profile transmission, partitioning studies. Shared ARG redundancy correlation analyses revealed tighter relationships among Bacteroidetes, Spirochaetes, and Epsilonbacteraeota, which probably favored ARG partitioning. Although some variations were unexplainable, MGE (the TGEs) + BC synergistic effect mainly caused significant ARG partitioning. Generally, screened sample ARGs exhibited significant differential characteristics, implying that, the urban bass fish culture systems are hotspots for advanced antibiotic resistome analyses.
Further analyses are required to elucidate the relationship traits at different stages of the fish growth, WWT processes, and transmission patterns of predominant ARG associations. This could be achieved by the present HT-qPCR method. It is also crucial to identify specific ARGs, which may be target genes, and can help to monitor the quality of reclaimed fish pond water to mitigate potential pollution threat to human health. Attempt to also establish unknown factors controlling ARG partitioning in the aquaculture systems will be scientifically innovative.
Footnotes
Acknowledgments
The authors remain grateful to the resource persons in Laboratories of Environmental Microbial Technology, Water Pollution Control, and Environmental Biotechnology at the Institutes of Environmental Engineering and Environmental Pollution Control and Treatment at CERS of ZJU for providing technical support.
Authors' Contributions
B.M.T. was the main researcher and PhD. student writer, supported by Z.-C.Z., L.Z., and Z.-J.L., to extract DNA samples for downstream applications and statistical data analyses, whereas L.-X.M. and Y.-J.S. supported in making the graphs. They also offered constructive criticisms, which shaped the work, whereas C.N., E.D., and K.O.-D. proof read the article. H.C. was the main supervisor who provided guidance and facilitated funding of the research work. All authors coedited the article.
Ethics Approval,Participation Consent,Data and Materials Availability
The fish experiments were guided by written informed notices for consent of participants following compliance protocols that conform to applicable national or international laws or guidelines under the Zhejiang University Research Ethics Statement Policy involving humans and animals. Also, raw excel, statistical tables, and relevant data regarding the article have been included as additional information and made available as  .
.
Author Disclosure Statement
No competing financial interests exist.
Funding Information
This project was initiated and funded by the Natural Science Foundation of China (Grant No. 21876147) and the Fundamental Research Fund for the Central Universities (2020FZZX003-02-06).
Supplementary Material
References
Supplementary Material
Please find the following supplemental material available below.
For Open Access articles published under a Creative Commons License, all supplemental material carries the same license as the article it is associated with.
For non-Open Access articles published, all supplemental material carries a non-exclusive license, and permission requests for re-use of supplemental material or any part of supplemental material shall be sent directly to the copyright owner as specified in the copyright notice associated with the article.
