
Abstract
The transition to a circular economy (CE) challenges organizations from different backgrounds. This research performed a combined circularity and Organizational Life Cycle Assessment (OLCA) of a certified zero-waste vegan restaurant in Brazil. The circularity assessment was carried through the Circular Transition Indicators (CTI) and Waste Hierarchy Index (WHI). Three scenarios were developed: Scenario 1 characterizes the real operations of the organization; Scenario 2 adds meat and dairy to the menu, and Scenario 3 disregards all circular practices applied by the restaurant. Scenario 1 performed better in eight out of nine impact categories assessed (ex: the carbon footprint of a regular restaurant was 26% higher than the reported organization). OLCA results point at the environmental benefit of following a plant-based menu and applying circular practices in the case of the targeted organization. CTI characterized the three scenarios as being 91%, 67%, and 62% circular, respectively. These results showed that avoiding meat and dairy, procuring agroecological food options, and implementing practices such as reuse, recycling, and composting directly improve the overall circularity of the system. WHI results were 51% for Scenarios 1 and 2, and −83% for Scenario 3, pointing at a drastic change in waste hierarchy through redirecting waste to different pathways other than the sanitary landfill. Due to the large variety of inputs needed by the restaurants, the production and procurement of goods were appointed as the main impact driver in all three methodologies. The influence of dietary changes, localism, and CE-related waste management practices is stressed in discussions of the article. Our research innovates by combining life cycle and circularity assessments at the organizational scale. This integrated approach equips decision-makers to understand the circularity, waste hierarchy, and environmental impacts of their business through a unified methodology. Future studies could bring our approach to other sectors and companies.
Introduction
The rising attention given to the circular economy (CE) triggered responses from different sectors. The private sector embraced CE principles through the promotion of circular business models and the search for innovative pathways for handling resources and residues (Geissdoerfer et al., 2018; Dantas et al., 2021). According to Fassio and Tecco (2019), CE represents a novel production and consumption logic that can be applied to the life cycle of the agrifood system.
Moving from a linear model to a large-scale regenerative profile could have emissions from the agrifood sector [Ellen MacArthur Foundation (EMF), 2019a]. However, intense changes in the life cycle of food-related products have to occur for a circular transition of this industry to happen (EMF, 2019b). Against that background, literature shows that cross-sectoral cooperation between the several stakeholders involved in the sector is crucial for such a model shift to take place (Esposito et al., 2020).
The foodservice sector plays a central role in the broader agrifood sector. Due to its large capillarity and perennial characteristics, it works as a platform for experimentation and upscaling of circular strategies (Mistretta et al., 2019). However, as pointed out by Fusi et al. (2016), despite its substantial size and economic value, there is still limited information on its environmental impact, which also relates to the attention given to this industry under the CE scope. This sector offers alluring characteristics for the development and implementation of CE practices and solutions due to a large amount of Small and Medium Enterprises (SMEs) linked to it.
As reported by Garza-Reyes et al. (2019), there is still lacking information and tools preventing SMEs from fully contributing to CE. As SMEs are often embodied in the value chain of larger organizations [United Nations Environment Programme (UNEP), 2015], it becomes clear that they have a substantial potential to reduce nationwide environmental impacts and further the development of CE.
Nevertheless, caution must be exercised in the evaluation of the transition from linear to circular systems. According to de Souza Junior et al. (2020), modifications in value-chains are liable to trade-offs between environmental impacts. The same authors argue that Life Cycle Assessment (LCA) is one of the preferable options for the assessment of circular systems. LCA is a science-based method for the quantification of environmental impacts from products and services (ISO, 2006a, 2006b).
Recently, its methodology has been upscaled to Organizational Life Cycle Assessment (OLCA) to provide decision-makers with company-wide information on their environmental performance and possible trade-offs, enabling resolutions that could influence entire value-chains (UNEP, 2015). In parallel, circularity assessments also target products, companies, or even larger systems. However, rather than accessing environmental impacts, circularity indicators commonly focus on the flows of materials, energy, and waste through the evaluated system (de Oliveira et al., 2021).
Against this background, it becomes clear that OLCA and company-level circularity indicators share the same scope. Therefrom, we argue that the combination of OLCA and microlevel circularity indicators delivers comprehensive outcomes regarding a system's circularity, applied resources, generated waste, while still quantifying the company's environmental profile. Similar approaches have been tested for products and services (Glogic et al., 2021; Rufí-Salís et al., 2021; Schulte et al., 2021), but an integrated approach capable of delivering the circularity and environmental assessment of entire businesses is still lacking.
The objective of this article is to test the implementation of circularity indicators alongside OLCA. The two circularity indicators applied are the Circular Transition Indicators (CTI) [World Business Council for Sustainable Development (WBCSD), 2019a] and the Waste Hierarchy Index (WHI) (Pires and Martinho, 2019). The proposed method is applied in the assessment of a vegan and certified zero-waste restaurant located in Brazil.
The purpose of this article is therefore not only limited to a case study, but it also serves toward the methodological alignment between life cycle-based methodologies and circularity assessments. As far as the authors are aware, this is the first publication to propose such an integrated approach at the organizational level. Thus, through this article, the authors intend to test this strategy to further support the development of simultaneous sustainability and circularity assessments.
The remainder of the article presents as follows: the Methodology section discloses the applied methodology. Following, the Results section explores the results of each assessment. The Discussion section addresses the main insights provided by the case study, as well as discusses the benefits and limitations of the strategy applied. Finally, the Conclusions section provides final remarks and future research possibilities.
Methodology
Organizational life cycle assessment
This study follows the procedures presented in the Guidance on OLCA report (UNEP, 2015) and ISO 14072 (ISO, 2014). According to the latter, “OLCA is the compilation and evaluation of all inputs, outputs, and potential environmental impacts of activities associated with an organization adopting a life cycle perspective” (ISO, 2014). Similarly as in LCA (ISO, 2006a, 2006b), OLCA are interactive studies composed of four phases: (1) goal and scope definition; (2) life cycle inventory (LCI); (3) life cycle impact assessment (LCIA); and (4) interpretation. Table 1 summarizes the main definitions described in the upcoming topics.
Main Organizational Life Cycle Assessment Definitions
Goal and scope
The goal of the assessment was to evaluate the potential environmental impacts of a certified zero-waste vegan restaurant located in Florianópolis/Brazil in 2020. The organization bases its business models in the CE and waste hierarchy principles. Zero-waste certification was provided by the Brazilian Zero Waste Institute (Instituto Lixo Zero Brasil, 2018) according to its own methodology. The organization counts with one facility where the entire operations occur. The restaurant is also the destination of all transport quantified. Since the study was conducted for the year 2020, due to the COVID-19 pandemic, all meals were prepared and prepacked for delivery. Hence, meals were patronized to fit a 400 g recyclable and compostable packaging option.
The main zero-waste and circular practices applied by the company are as follows: (1) composting; (2) recycling; (3) reuse; (4) partnerships with waste-picker associations; (5) use compostable and recyclable packaging; (6) localism in their procurement processes; and (7) agroecological and plant-based menu. Other minor practices and activities are also in place and can be consulted at Casa Origem (2021).
The reporting unit was defined as: “Serving meals during one year of operation.” The reporting flow is therefore 18,000 meals, which is the approximated number of sold meals in 2020 (reference period). The consolidation method applied was of total control over operational and financial terms.
The study took a cradle-to-grave approach and the system was divided into four main processes for modeling purposes: Production and Procurement (P&P), Logistics and Transport (L&T), Operations, and End of life (EoL). P&P refers to the production and acquiring of all goods. L&T is related to the transport from the supplier to the reporting organization. Operations embrace cooking, preparation of meals, serving, cleaning, office and managerial activities, and related tasks. EoL refers to the final treatment provided to all solid waste generated (landfill, composting, and recycling). System boundaries are illustrated in Fig. 1.
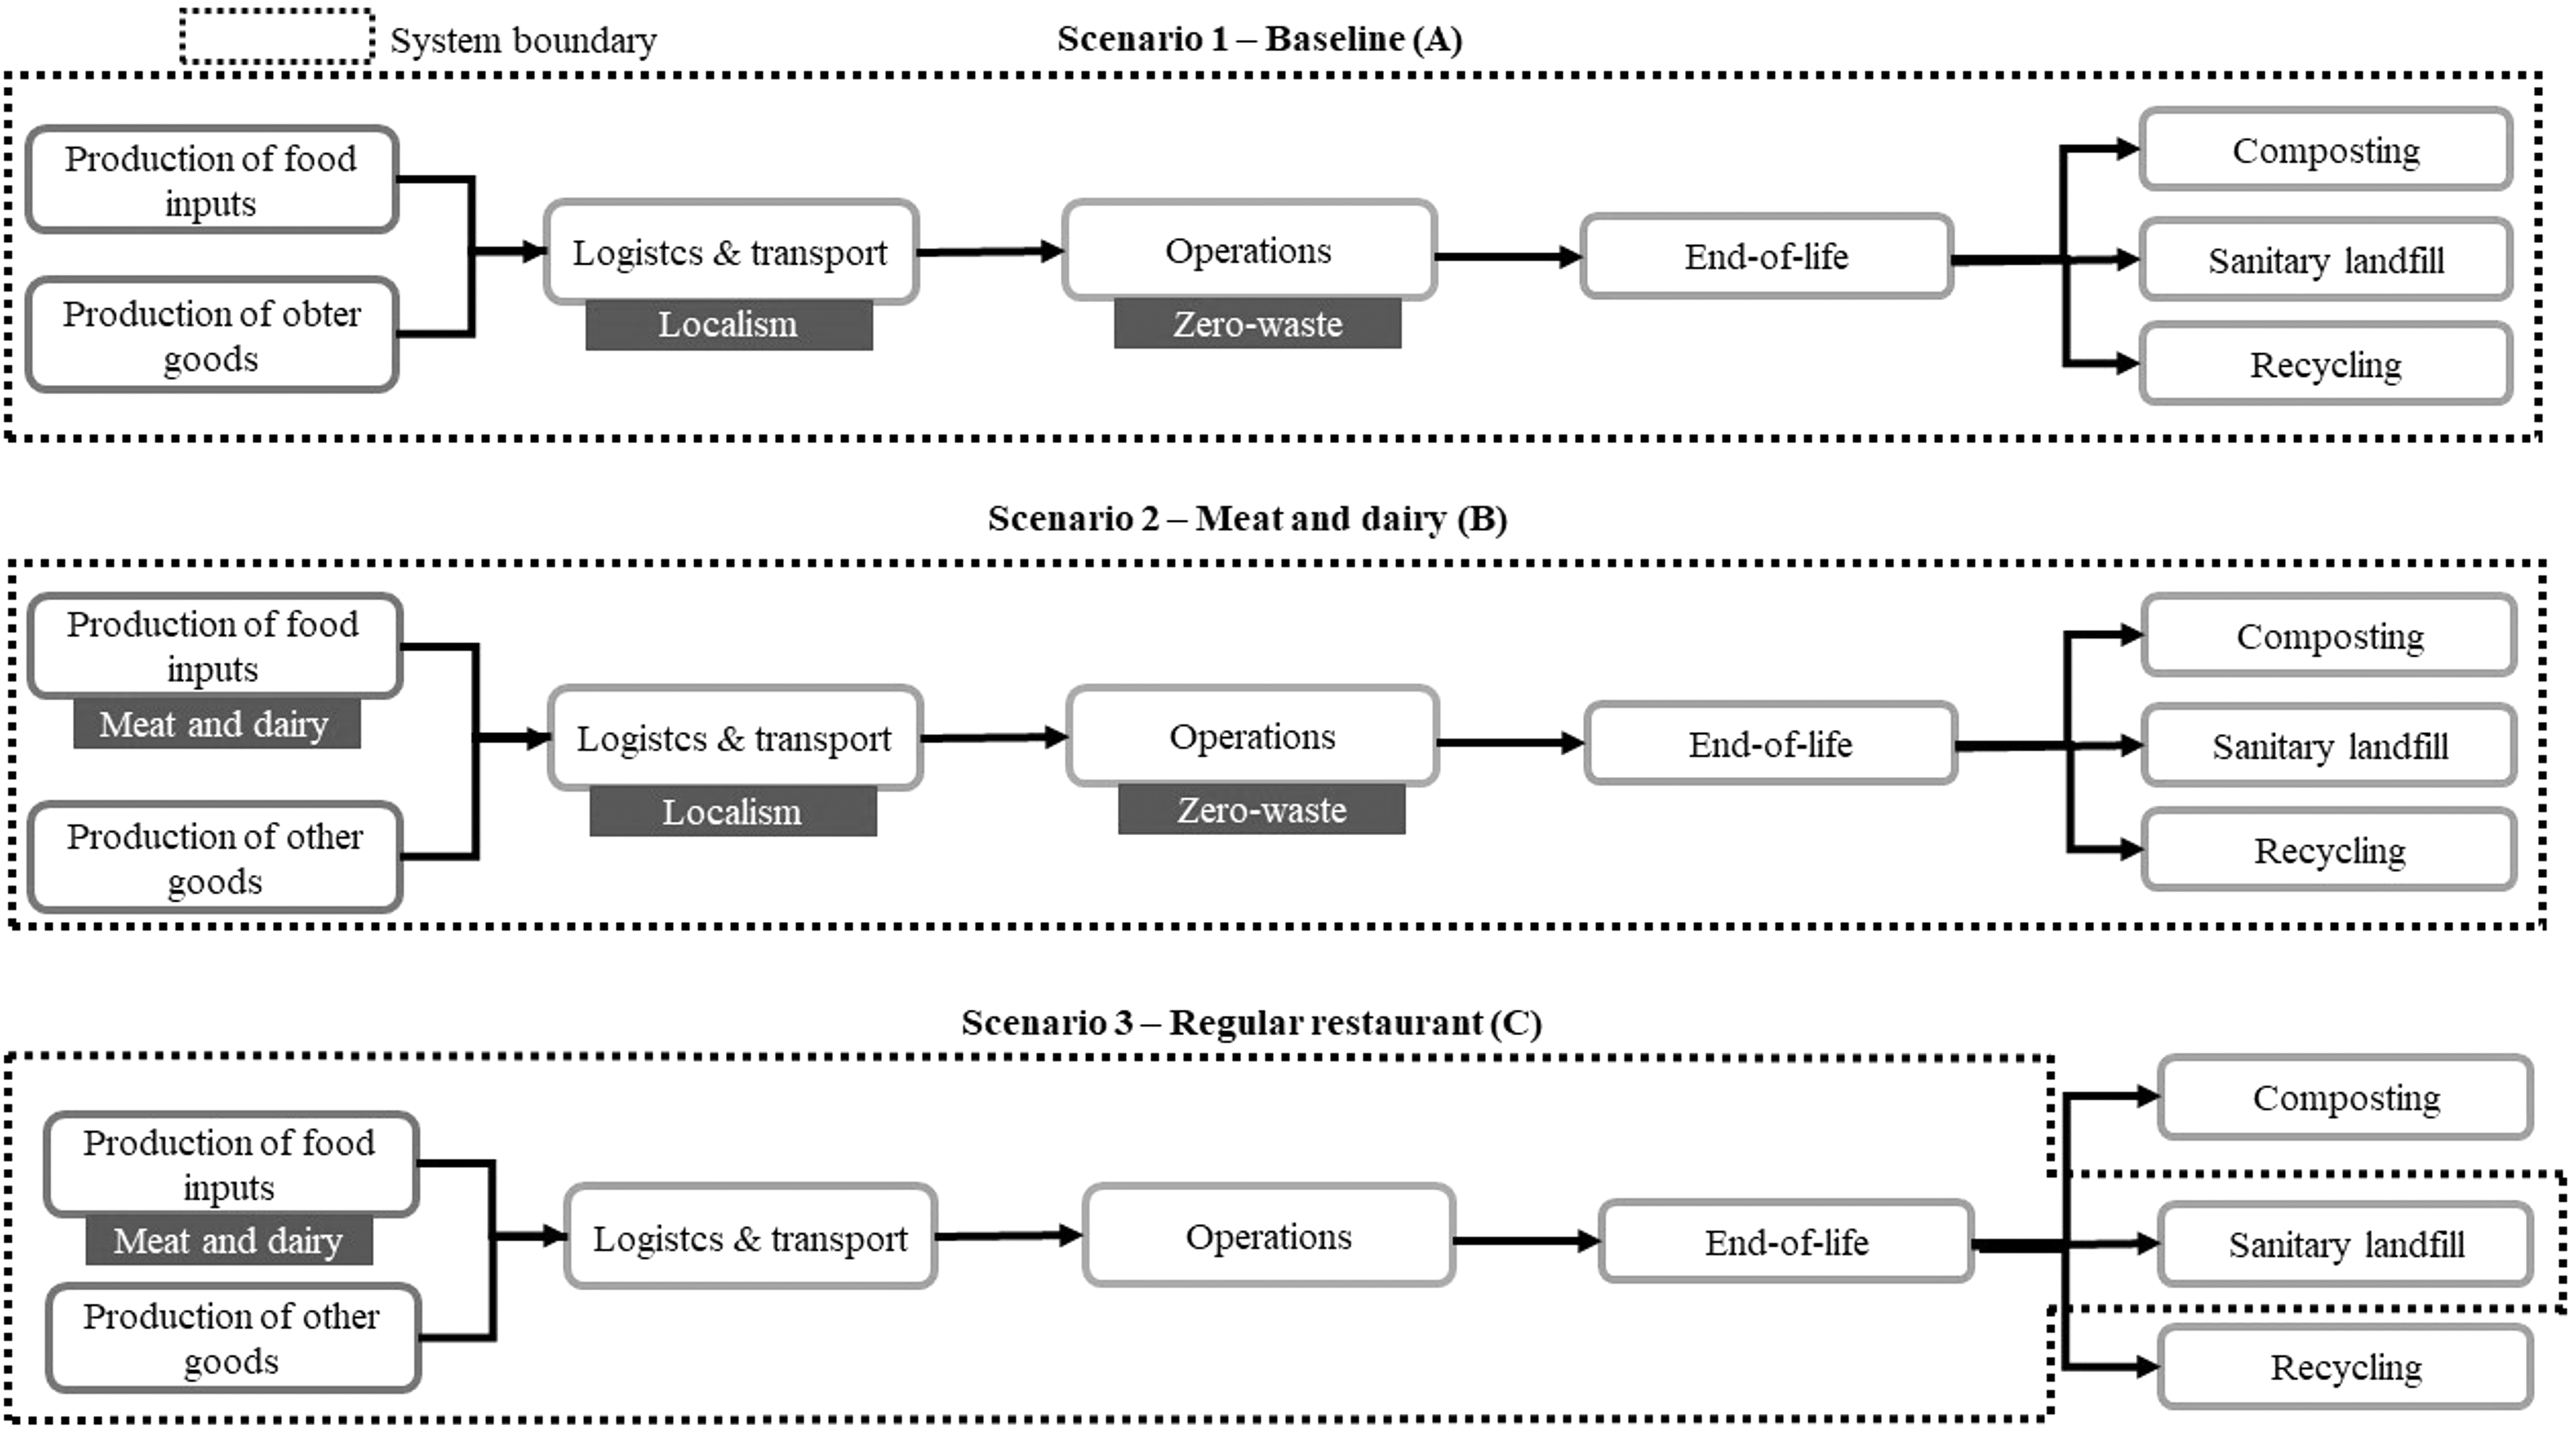
System processes and boundaries for the three scenarios analyzed.
Three scenarios were created to verify the influence of circular practices, veganism, and localism in the potential environmental impacts of the reporting organization:
Scenario 1 (baseline)—Casa Origem “as-is.” Includes zero-waste and circular practices (reduction, reuse, recycling, composting, etc.), localism, and plant-based options. Illustrated in Fig. 1A. Scenario 2 (meat and dairy). Substitution of vegetal protein options for meat and dairy products. The substitution was made following the experienced opinion of a third-party professional from the food sector. Includes circular practices and localism. Illustrated in Fig. 1B. Scenario 3 (regular restaurant). Follows the same substitutions as in Scenario 2. All solid waste is sent to a sanitary landfill. The P&P phase disregards localism. Illustrated in Fig. 1C.
According to the UNEP (2015), the system should include (if possible) all inputs and outputs from the direct and indirect activities. The former indicates activities owned or controlled by the reporting organization, the latter relates to the consequences of the reporting organization's activities that occur at sites owned or controlled by other members of the value chain. Figure 2 illustrates the relevant inputs, outputs, and direct and indirect activities analyzed in this project.
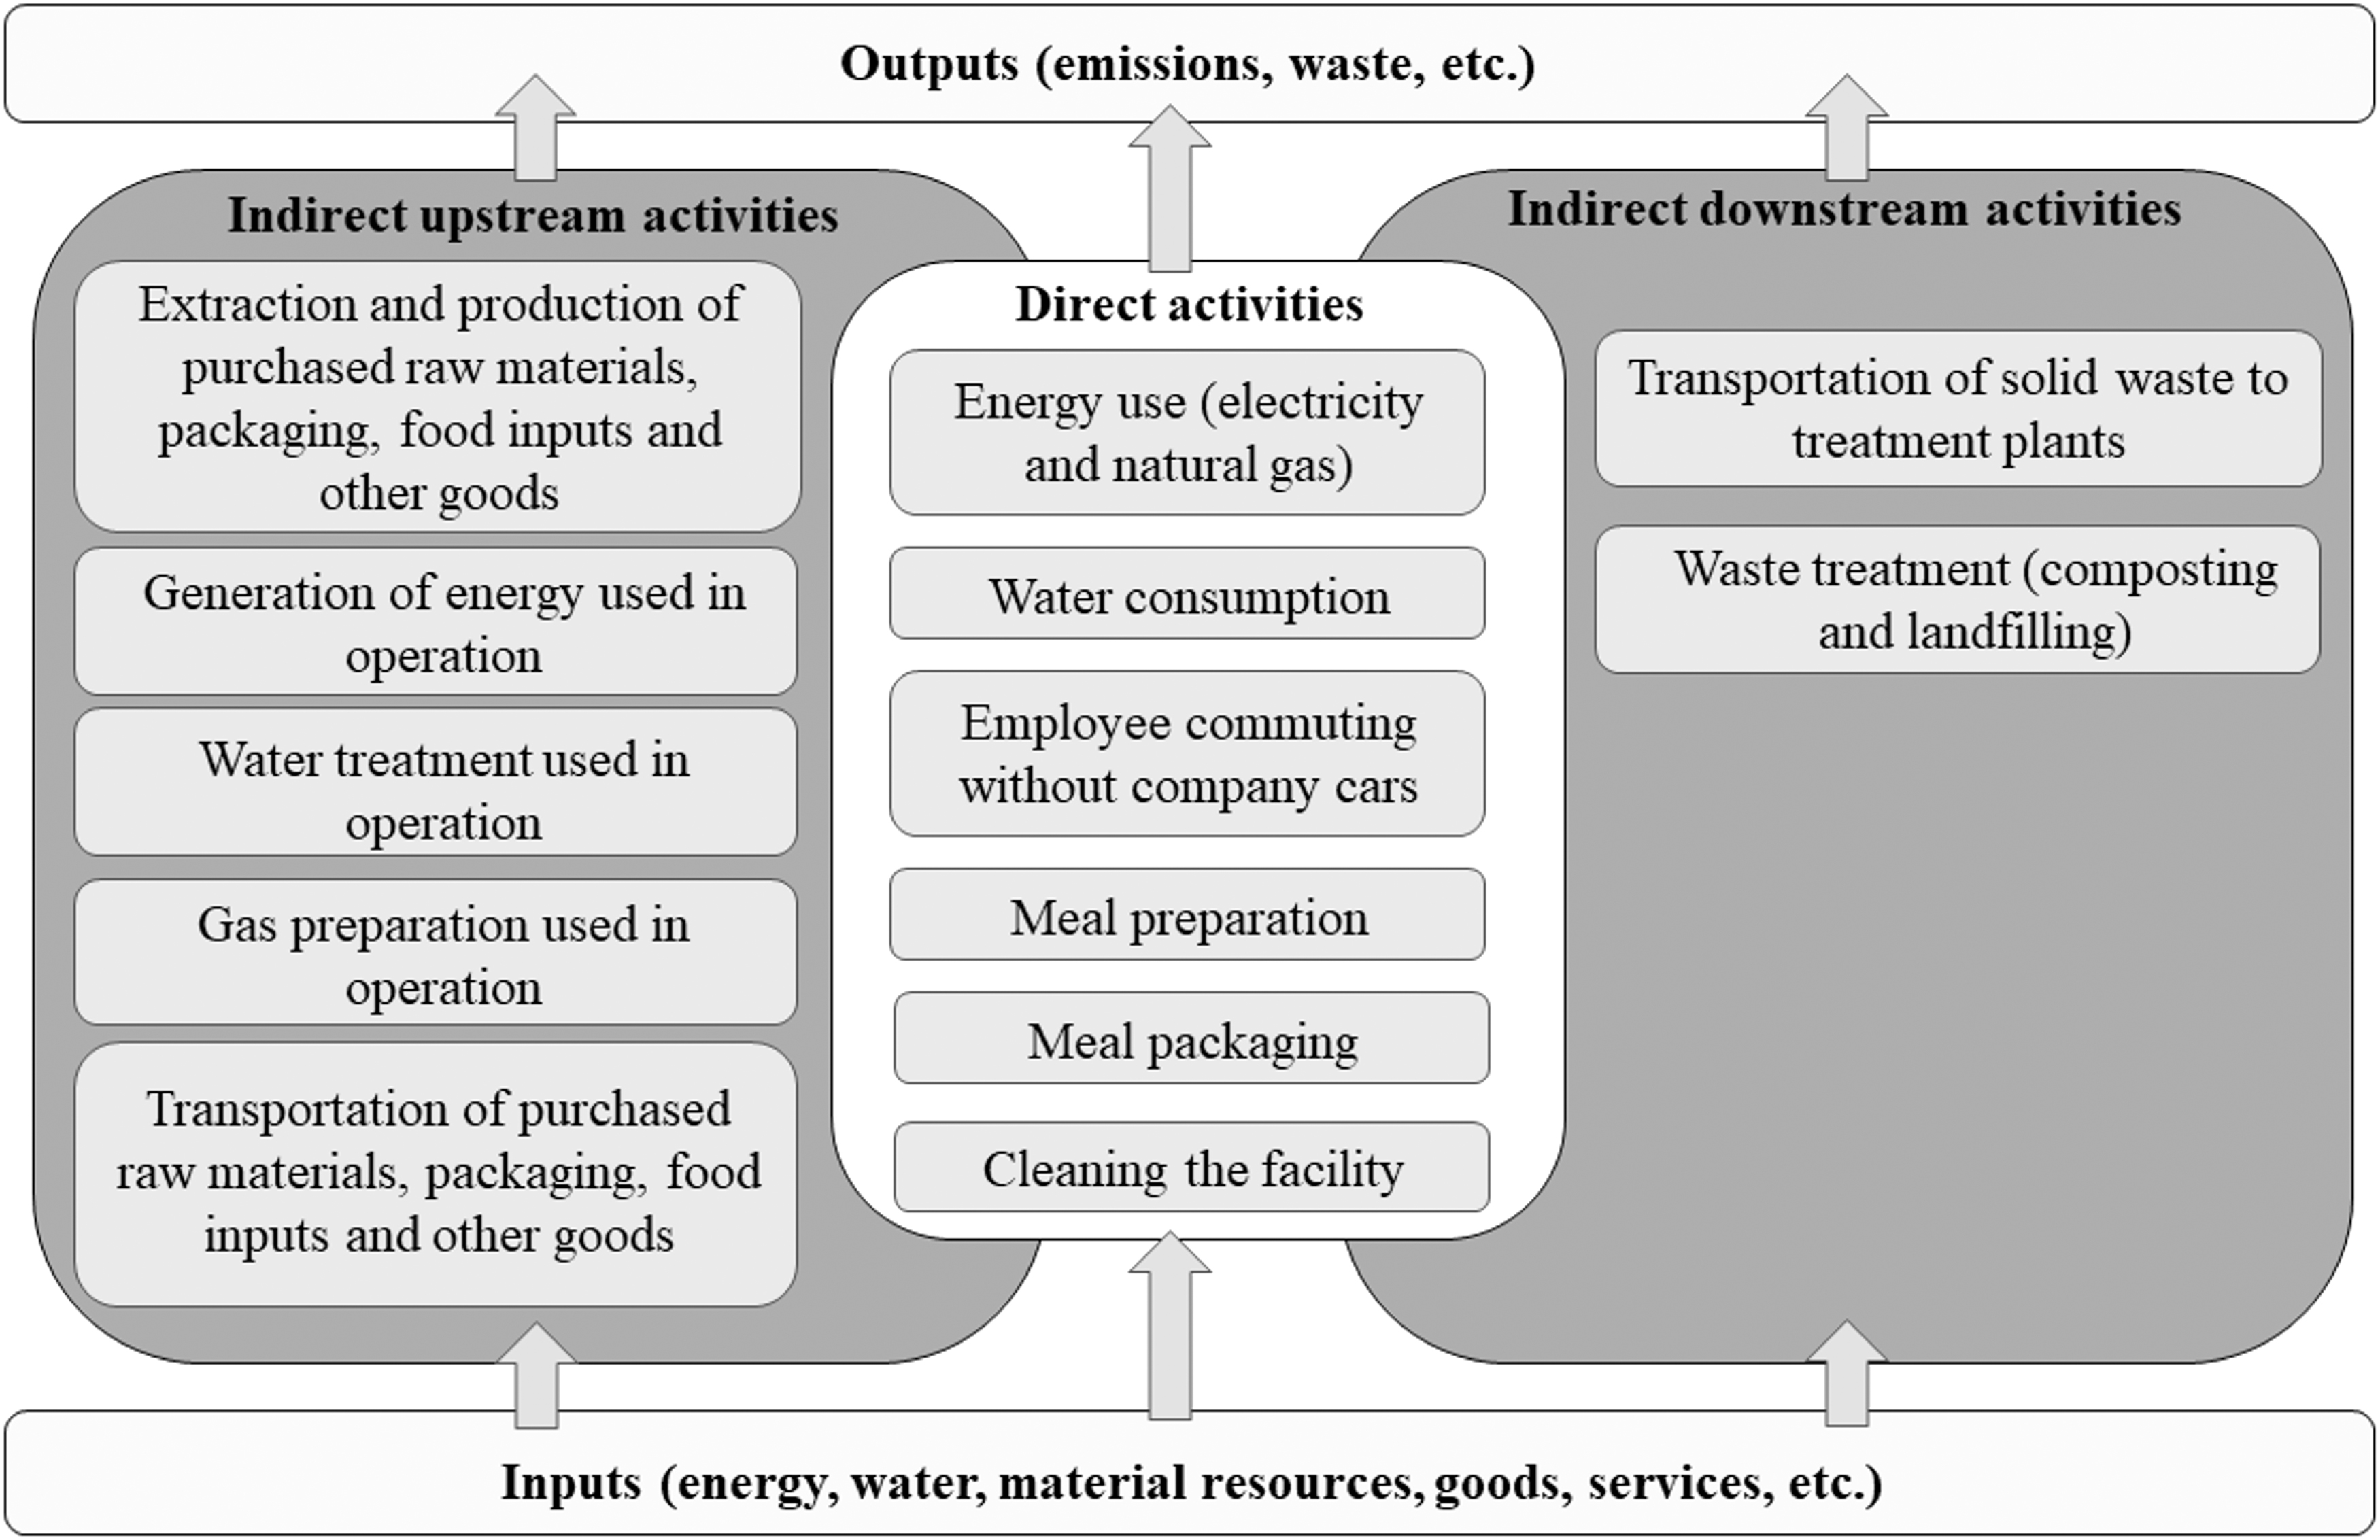
Inputs, outputs, and direct and indirect activities of the reporting organization.
Life cycle inventory
The UNEP report (2015) describes four “Experience-based Pathways” for the conduction of an OLCA. The reporting organization had never carried comprehensive environmental assessment projects before. Therefore, it fits the “Pathway 1: Limited initial environmental experience and information.” Data collection followed the approach applied by Jungbluth et al. (2016), along with the recommendations for OLCA in SMEs provided by UNEP (2015).
The data collection method is categorized as a top-down procedure, that is, company-wide (UNEP, 2015). Therefore, a detailed list of all purchases, including weight and costs was provided by the reporting organization. In addition, the researchers had access to the balance sheet for the reporting period. The balance sheet and purchasing list were first delivered with data separated by month, which was later aggregated per year for modeling reasons (Table SM 02). When needed, direct contact with suppliers was established to ask for procurement files.
Primary data were used for direct activities, and a combination of measured, estimated, and generic data was utilized for indirect activities. Direct activities include energy use and water consumption, employee commuting, meal preparation, and packaging. Indirect activities (upstream and downstream) are related to the extraction of raw materials, operations, transport, waste treatment, and office work from suppliers. Data regarding the indirect activities were shared by the suppliers through direct contact and aggregated alongside the LCI for the modeling stages. The complete LCI and list of assumptions of the project can be found in Table SM 08, located in the Supplementary Material.
Life cycle impact assessment
The use of databases followed a hybrid approach in the referred project. The system was mainly modeled using the ecoinvent 3.7.1 database, which was combined with the Agribalyse 3.0.1 database to complement information regarding the life cycle of food products. The system was modeled using the software OpenLCA v1.10.3. The LCIA method applied was ReCiPe 2016 at the midpoint level following a hierarchical perspective (Huijbregts et al., 2016). Nine impact categories were selected based on their alignment to the project's scope and validated along with the stakeholders involved. They are either related to global environmental issues or be linked to impact pathways that concern the agrifood sector. Table 2 summarizes the impact categories applied in the study.
Impact Categories Applied in the Study (Huijbregts Et Al., 2016)
Interpretation
Apart from the common LCA interpretation procedures and goals (analysis of significant LCI aspects, identification of environmental hotspots, main drivers baseline, and created scenarios), the results of this article were also analyzed and interpreted following the context given by each scenario. The influence of dietary changes (veganism), localism, and implementation of circular practices in the environmental profile of the reporting organization is given particular attention in our analysis. Results are also analyzed concerning this article's main goal, that is, the possibility of a combination between OLCA and circularity indicators. The following topics explore the methodology for each indicator implemented.
Circularity assessment
Saidani et al. (2019) define indicators as analytical tools used to simplify information in quantitative or qualitative assessments for tracking and measuring the performance of specific systems or processes. According to de Oliveira et al. (2021), circularity is the alignment of a material or energy flow, product, processes, or system to a set of CE strategies (redesign, composting, recycling, renewable energy, etc.) that meet the general CE goals. The same authors still define circularity indicators as analytical tools focused on measuring the degree of association of a system (or part of one) to practices and strategies applied to develop a CE further.
Two circularity indicators were applied: WHI and CTI. Figure 3 illustrates the methodological boundaries set for the circularity assessments using the OLCA baseline scenario. WHI is mainly directed to waste management practices and the EoL phase, while CTI applies a broader boundary to account for the circular inflows and outflows of the system. The choice for applying CTI and WHI was based on previous work conducted by the authors (de Oliveira et al., 2021).

Methodological boundaries of applied assessment methods illustrated for the baseline scenario.
The authors identified CTI as a flexible, yet, comprehensive indicator capable of delivering company-wide circularity results through a straightforward rationale and open methodology (WBCSD, 2019a). In addition, similarities were identified between CTI's processes and the four methodological steps of life cycle studies. As for the WHI, after the careful methodological analysis of its development and structure (Pires and Martinho, 2019), this indicator was judged to be applicable for the waste hierarchy analysis in business-level assessments. Detailed explanations of the methodological approach taken in either case are presented below.
Circularity transition indicators
The use of CTI in this work followed its methodological blueprint, the report “CTI 2.0—Metrics for business by business” (WBCSD, 2019a). CTI focuses on mass flows (linear or circular) that flow through the evaluated organization (WBCSD, 2019a). Contrary to LCA, this method does not provide insights regarding the environmental impacts of product systems. It calculates the overall circularity of a business based on the linear and circular flows of a system. CTI presents its own nomenclature for the different mass flows analyzed in its methodology. The definition of “inflow,” “outflow,” “recovery,” and other particular terms used in this indicator can be found in the Supplementary Material (refer to Table SM 10). CTI's rationale and the relationship between all flows accounted for are illustrated in Fig. 4.
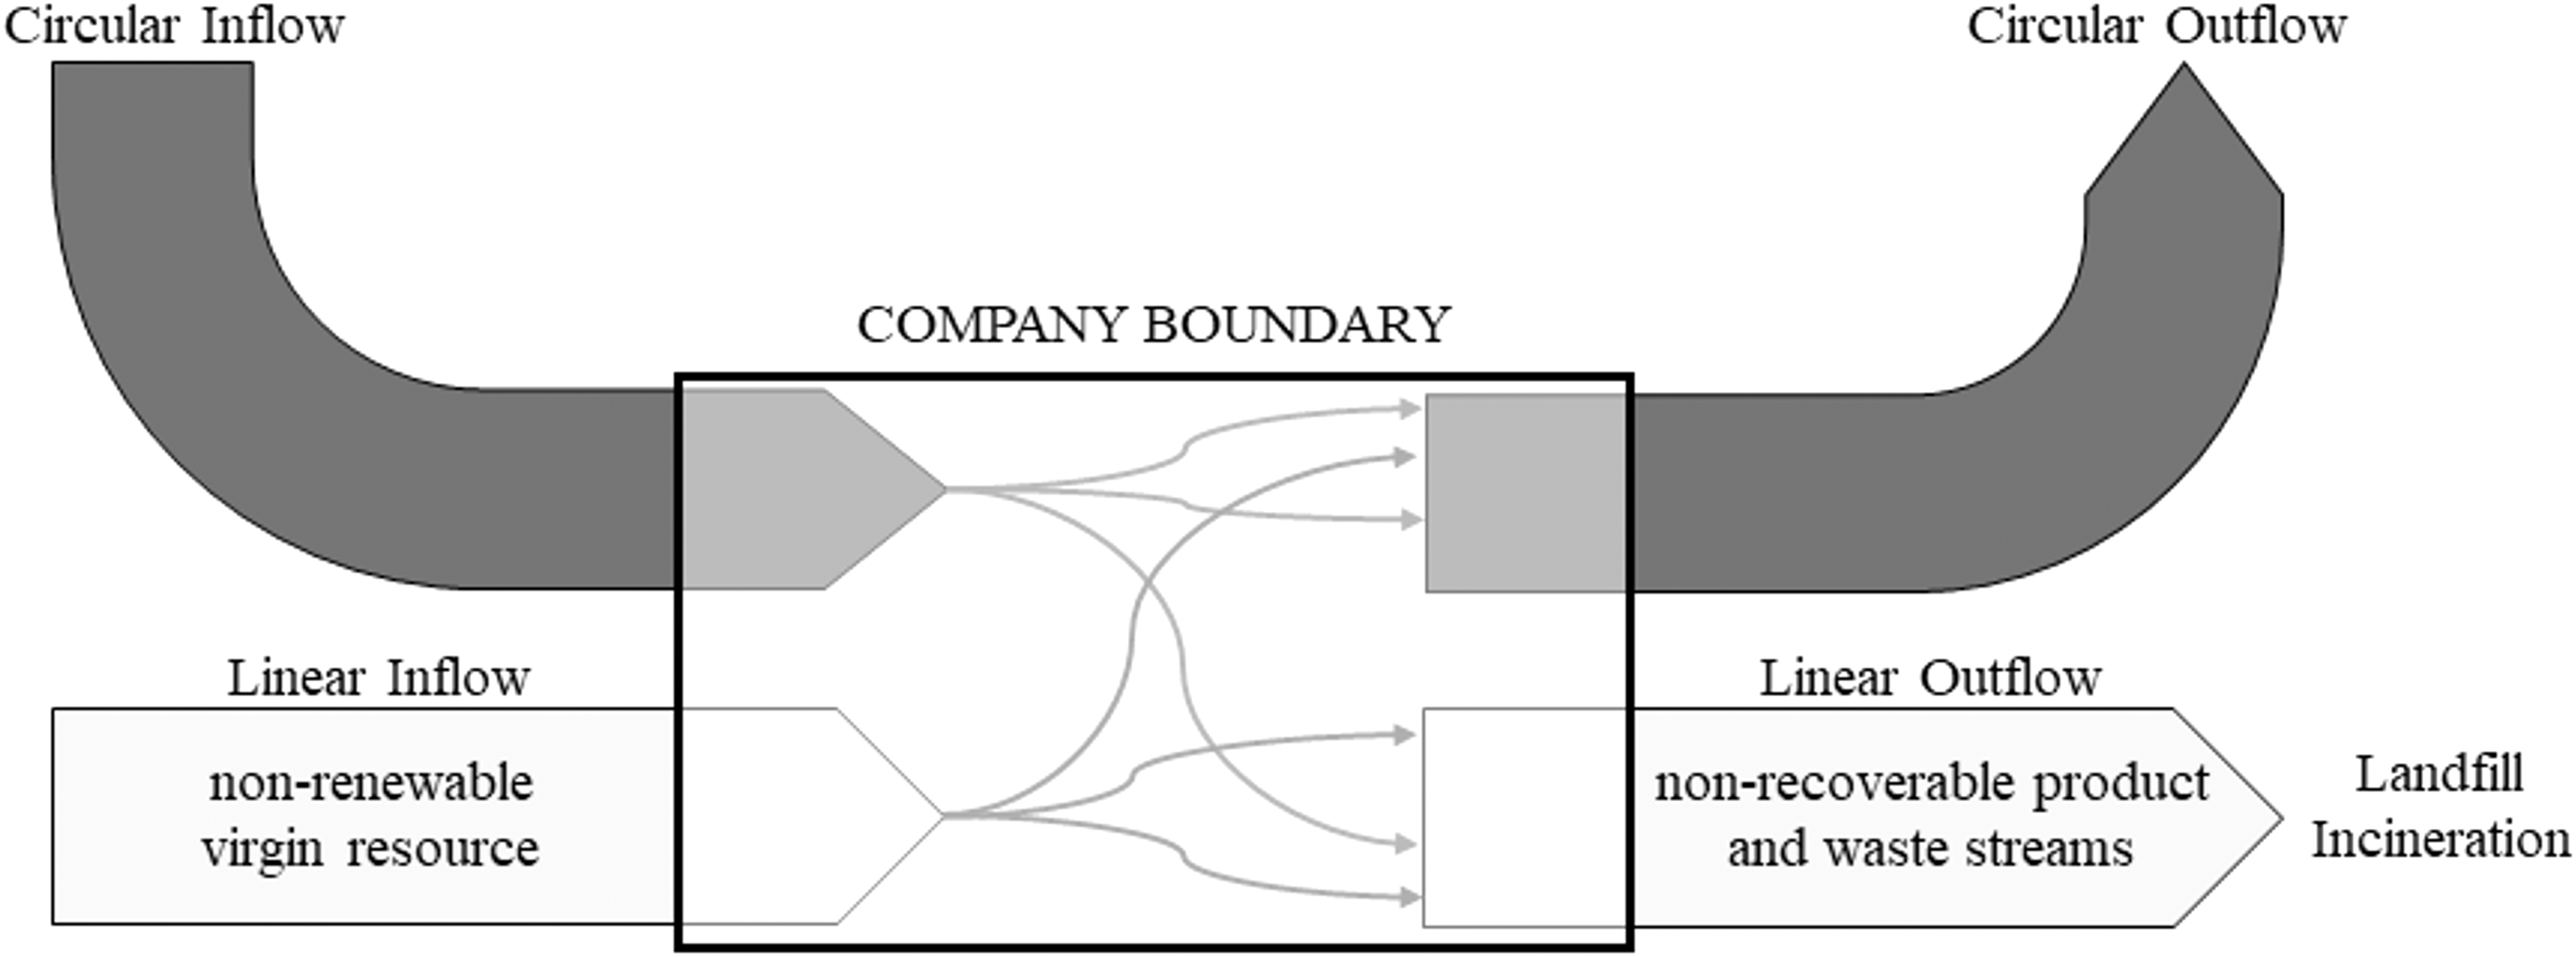
Material flows analyzed by circular transition indicators. Adapted from World Business Council for Sustainable Development (2019a).
CTIs are clustered into three groups: Close the loop, Optimize the loop, and Value the loop. The first focuses on the company's effectiveness in closing material loops. The second provides insights regarding resource-use efficiency. The third addressed how circularity can create value for a business. The first group of indicators is obligatory when applying CTI to a company, the other two sets of indicators are optional. CTI's methodology is based on the application of weighted averages between the mass flows described in Fig. 4 and Table SM 10. The indicators “% of inflow” and “% of outflow” are mandatory in CTI assessments since their values are used in the calculation of CTI's main indicator: “% Circularity.” This percentage is calculated through the weighted average between “% of circular inflow” and “% of circular outflow” (Table SM 10).
Due to this research's scope and the nature of the analyzed business, only the “% circular inflow,” “% circular outflow” indicators were assessed. Water-related indicators were excluded since the company currently does not apply in-site water reuse practices. The renewable energy indicator was also ruled out of our study since all power consumed by Casa Origem comes from the grid and there is no in-site generation (i.e., solar panels). The same is true for the “% of critical material,” “Recovery type” and “Value the loop” indicators. Table 3 summarizes all indicators part of this tool.
Circular Transition Indicators (World Business Council for Sustainable Development, 2019a)
CTI calculations were carried out automatically through its online portal (World Business Council for Sustainable Development, 2019b). The data were extracted from the reporting organization's LCI. Although CTI shows a larger boundary in comparison to the scenarios evaluated by OLCA, for this study, CTI was calculated for the same three scenarios shown in the Goal and Scope section. In addition, recycling rates used both in CTI and OLCA were extracted from a feature of the online toolbox, which offers access to the BOKU database (BOKU, 2019).
Waste hierarchy index
The application of WHI followed the methodological approach described by Pires and Martinho (2019). The goal of the WHI is to measure the waste hierarchy implementation level of a system. Figure 5 illustrates the waste hierarchy that WHI was built upon. The indicator considers different types of waste management treatment options and applies a weighting method to attribute value to practices that contribute to CE. WHI considers only the operations that occur after waste is generated, and it does not include prevention (Fig. 5). WHI was developed and previously used to fit the macro scale of CE, but due to its simple, yet, effective rationale, we argue that its approach can be extended to other scales of CE.
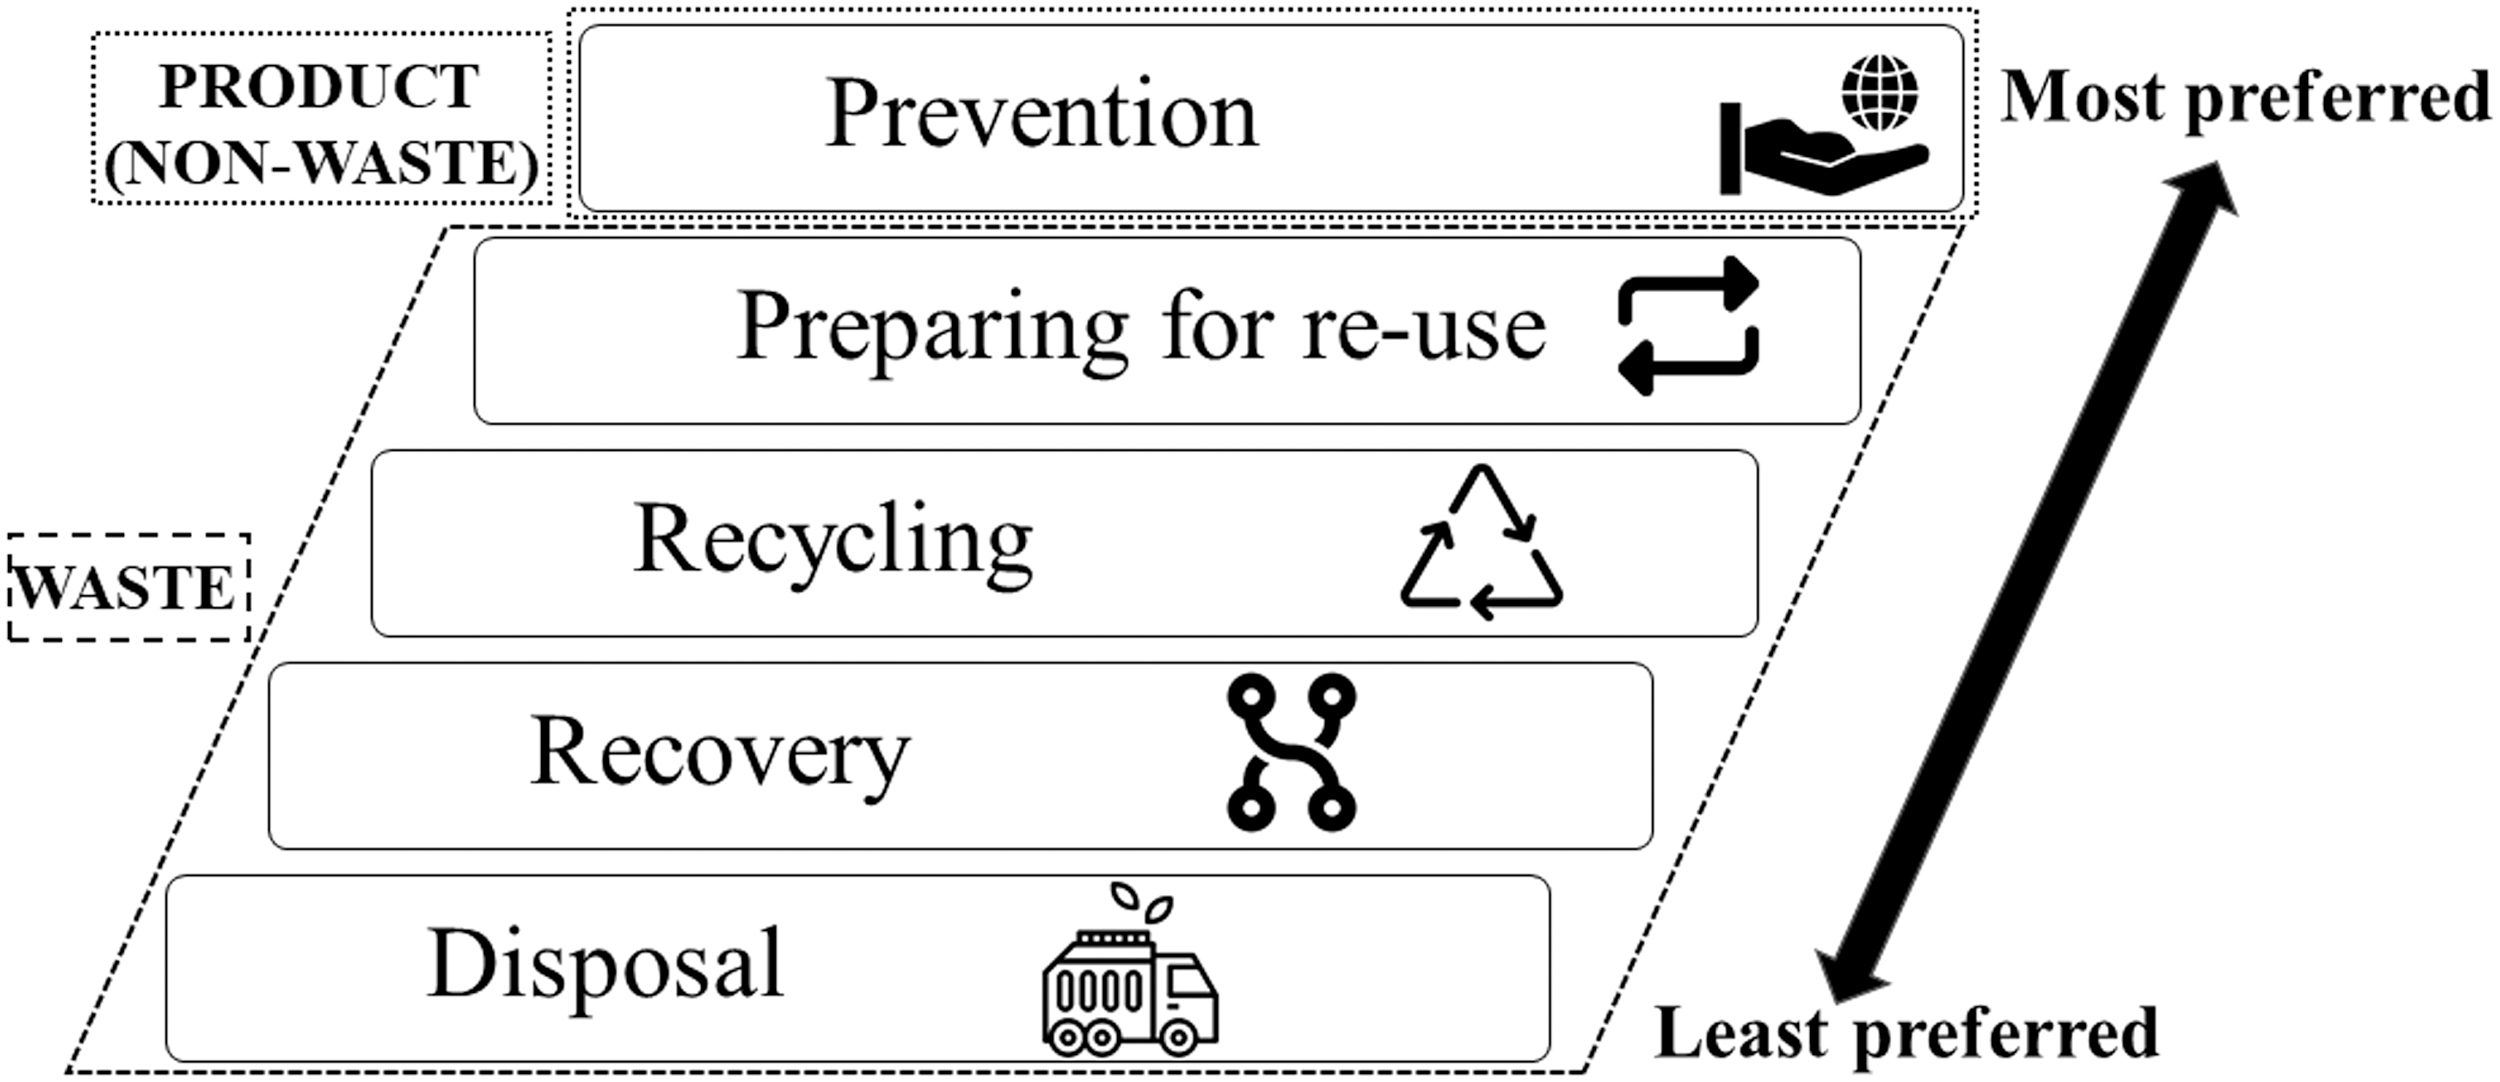
Waste hierarchy according to the Waste Framework Directive 2008/98/EC (European Parliament, 2008).
Therefore, we propose its use in the company-level scale through its application in the same system described in the Goal and Scope section. The streamlined version of WHI developed by Pires and Martinho (2019) was applied to this project, which was calculated according to the following formula:
where Mpr stands for the total mass of waste being prepared for reuse (cleaning or repairing recovery operations for waste that can be reused without reprocessing). Mr and Mc regard the total mass of waste sent to recycling and composting, respectively. Mi concerns the total mass of waste treated via incineration and Ml is the sum of all waste sent to sanitary landfills. Finally, Mt is the total mass of waste generated by the system during the reference period and sent to treatment options. Waste mass (wet basis) data in kilograms are inserted into the equation. WHI results range between −100% and 100%. A WHI of −100% describes a system, in which waste hierarchy principles are not implemented in a way that could contribute to CE. On the contrary, a system that shows a WHI of 100% reflects that all solid waste is correctly sent to CE-linked operations exclusively.
WHI was applied to the three scenarios described in the Goal and Scope section to provide decision-makers with information regarding the possible changes in waste hierarchy implementation potentials between the scenarios analyzed. Data used for the calculation were extracted from the reporting organization's LCI. WHI's use in the study is justified by the possible beneficial combination between OLCA and WHI for the hereby described case study. This strategy provides decision-makers with information and results concerning a comprehensive methodological boundary for waste management practices following waste hierarchy principles.
Results
This section presents the main LCIA and circularity assessment results for the reporting organization. The inventory common to all approaches is presented in Table SM 08. The presentation order follows the same sequence as the Methodology section. To avoid overextending this section, the authors placed all marginal results in the Supplementary Material (Tables SM 01–07).
Organizational life cycle assessment
LCIA results for each of the scenarios analyzed are presented in Table 4.
Life Cycle Impact Assessment Results
As illustrated in Fig. 6, the baseline scenario has a better environmental performance in eight out of the nine impact categories, the only exception is the water depletion (WDP) category, which Scenario 2 presented a slight advantage. Scenario 3 ranked as the highest in terms of potential environmental impacts between the three scenarios in seven categories (climate change [GWP], fossil depletion [FDP], freshwater eutrophication [FEP], human toxicity [HTP], marine eutrophication [MEP], natural land transformation [NLTP], and terrestrial acidification [TAP]). The only two exceptions were agricultural land occupation (ALOP) and water depletion (WDP), in which Scenario 2 took the lead. In fact, Scenario 2 presented close results in the categories GWP, TAP, and NLTP to the aforementioned scenario. The latter is the only category, in which the impacts of all three scenarios showed close results.

Impact assessment of the reporting organization's organizational life cycle assessment.
As shown in Fig. 7, the P&P phase is the main driver between the four processes. Operations follow as the second most impactful process in the majority of categories analyzed. L&T showed minimal contributions in all scenarios and categories. Although the recycling process contributed to higher results in Scenario 1 and 2 in the impact category WDP, overall EoL results also did not show high relevance. For the detailed contribution of these four processes in terms of environmental burdens, please refer to Tables SM 01–03, located in the Supplementary Material.
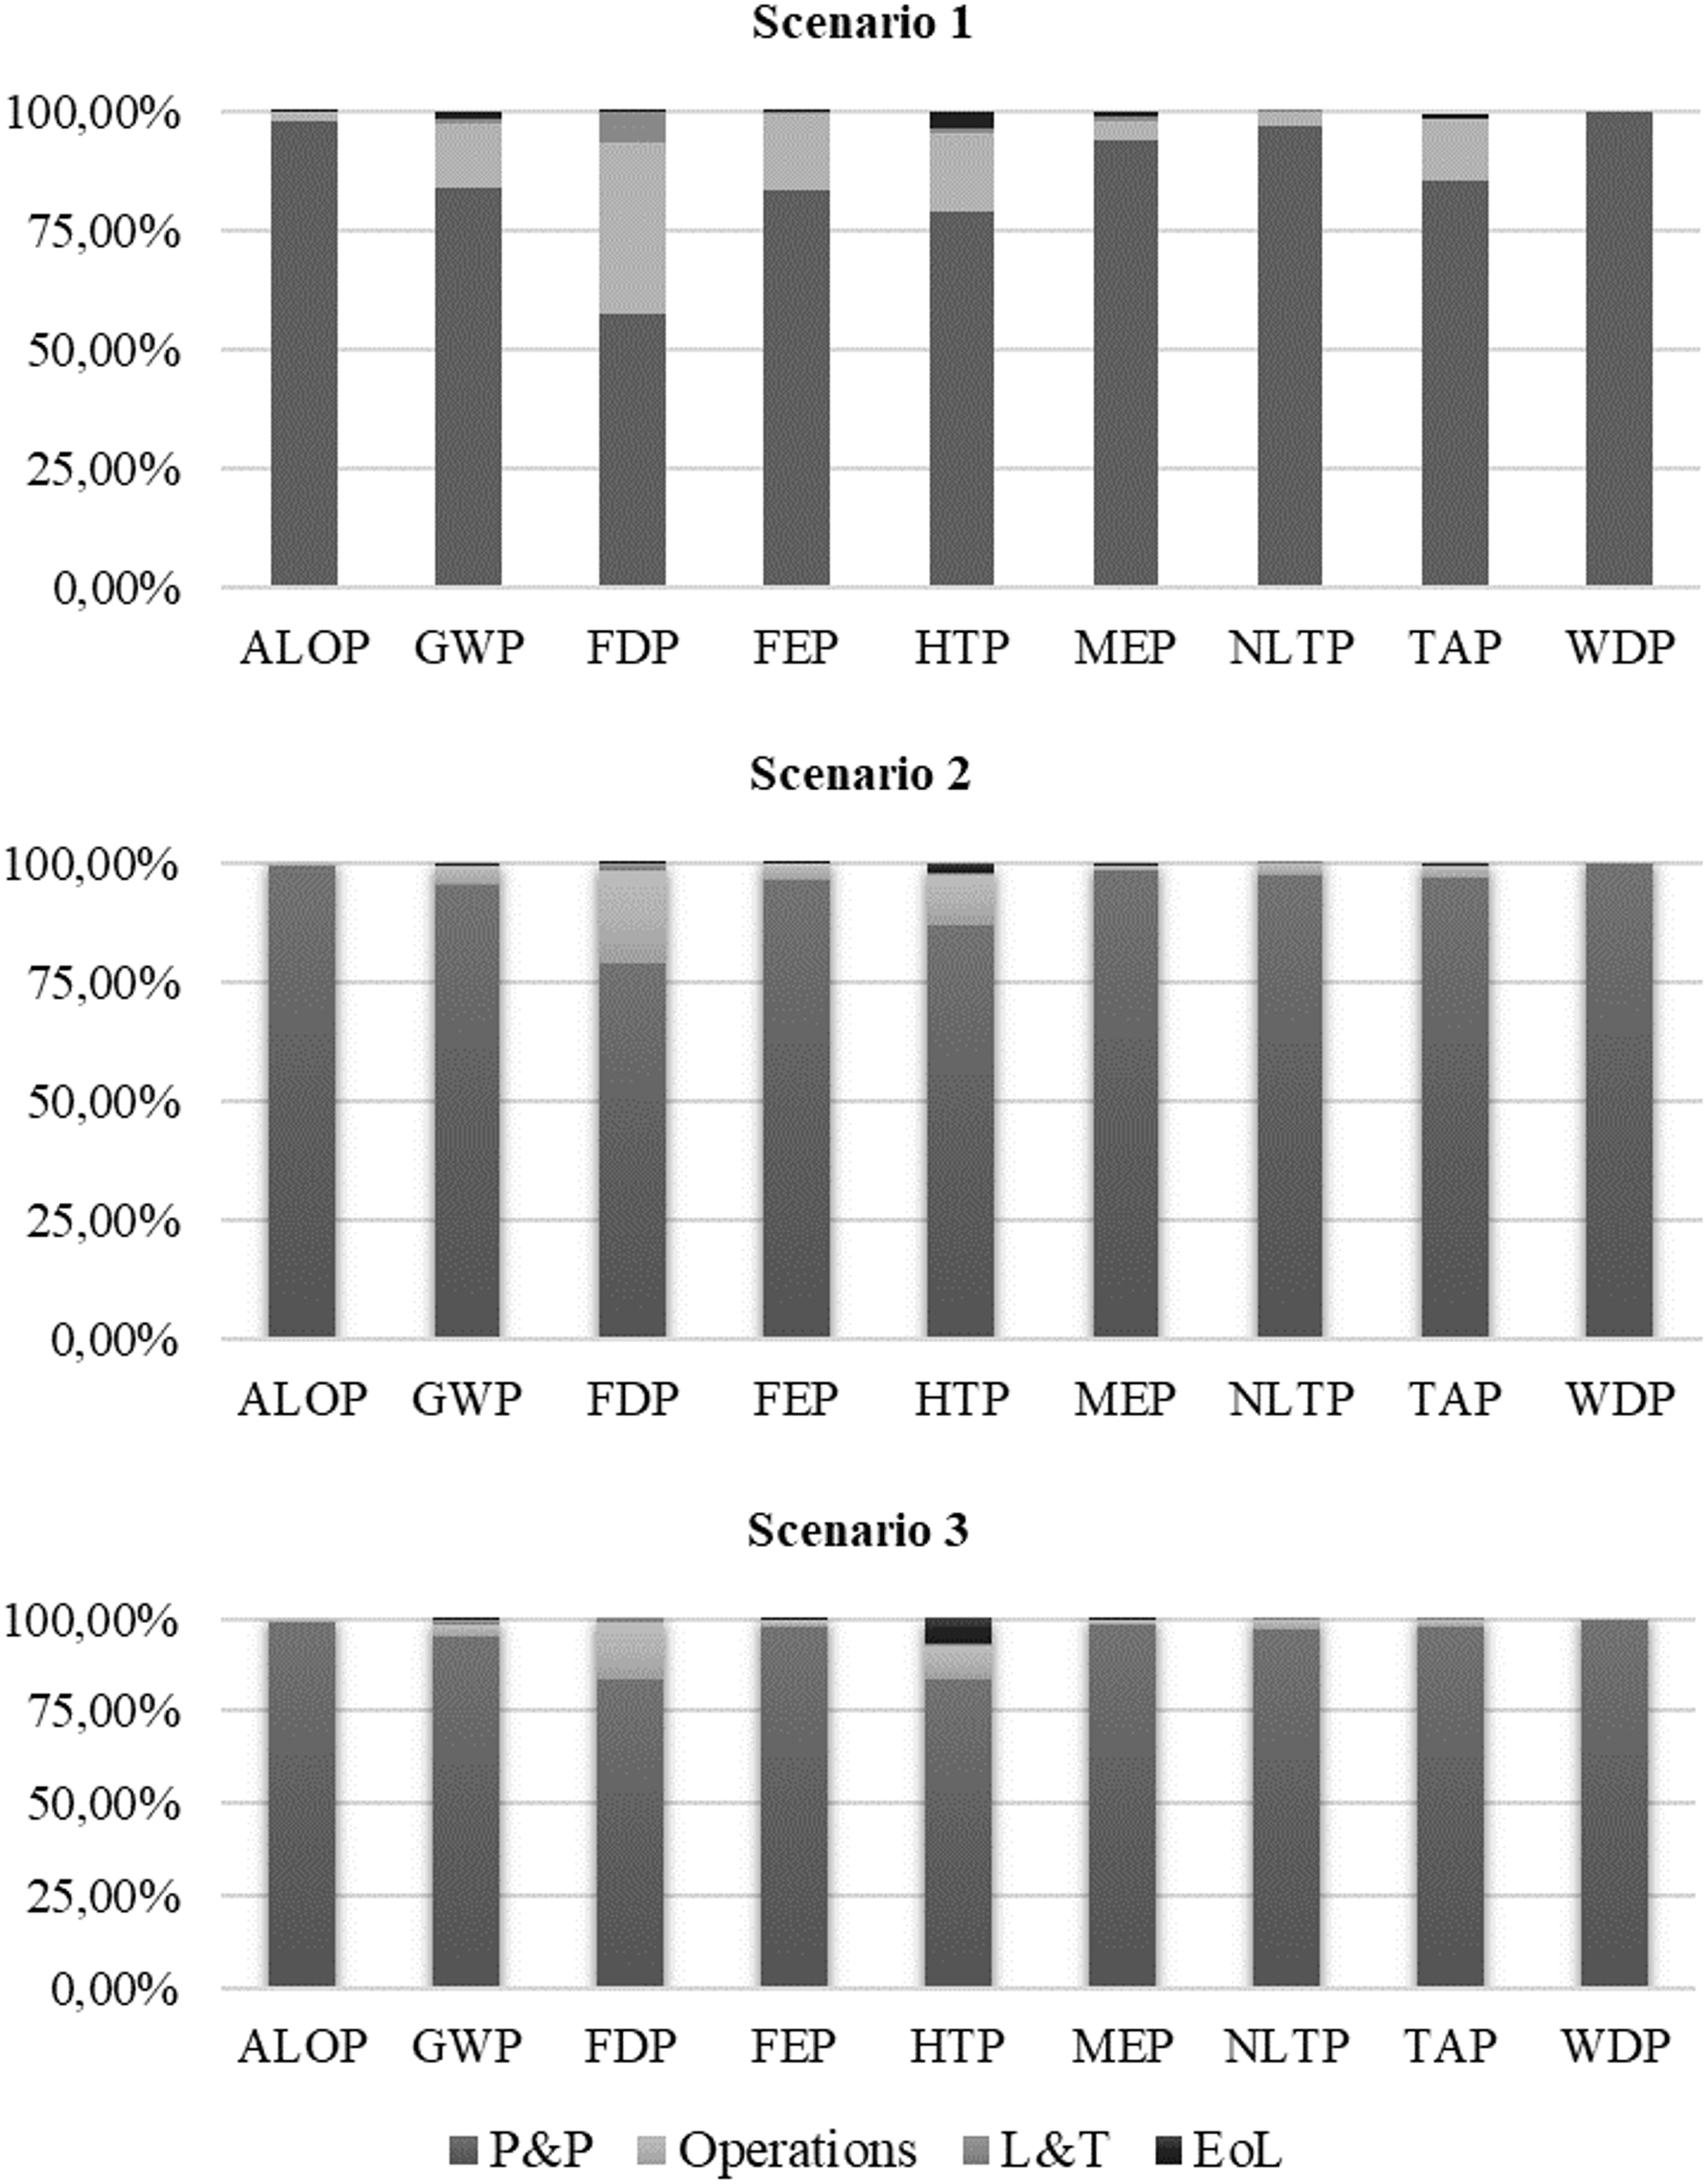
Life cycle impact assessment main drivers.
More than 83% of the environmental burdens in seven out of nine categories accessed for Scenario 1 are placed in the P&P phase (Tables SM 01–03). FDP and HTP are the only ones that destone, but still manage to have P&P as their main driver (Fig. 7). As shown by Table SM 04, the environmental burdens of Scenario 1 are closely linked to the production of diverse food items, such as chickpea, chocolate, rice, and many more. In this scenario, Operations are responsible for 36.1% of the impact related to FDP and 16.5% for HTP. Although relatively low compared to P&P, these impacts are mainly derived from emissions related to the use of cooking gas and electricity. L&T and EoL have minimal contributions.
According to Tables SM 01–03, in the majority of categories, these two processes are responsible for no more than 1% of the impact. The only two exceptions are again for the FDP and HTP categories, in which L&T contributed with 6.21%, and EoL contributed with 3.36%, respectively.
The production of meat and dairy present in Scenarios 2 and 3 strongly influenced the results in all categories (Table SM 05 and 06). The products with higher environmental burden in these two scenarios are different variations of meat production. Beef production is the main driver in the ALOP, GWP, TAP, and WDP categories in Scenarios 2 and 3. Fish production ranks as the highest impact for FDP, FEP, HTP, and MEP for the same scenarios. Pork or chicken production follows as the secondary drivers in the majority of categories in these two scenarios. These results, highlighted by Tables SM 04–06, point to the environmental benefit of the dietary choice that the studied restaurant is built upon.
Results show that the implementation of zero waste and circular practices, localism, and a plant-based diet deliver considerable improvements in the system's environmental performance. That can be justified by the difference of results between Scenario 2 and 3, especially regarding the impact categories FDP, FEP, HTP, and MEP, but also present in the categories GWP and NLTP (Fig. 6). The most determinant aspects are the reduction in plastic packaging and composting. In Scenario 1 and 2, the vast majority of products are packed using paper-based compostable and recyclable options. Conversely, all products in Scenario 3 are packed using plastic packaging. In addition, recycling impacts did not drastically affect the results, which were mainly directed to the P&P phase.
Another relatively significant difference relates to the implementation of composting in Scenarios 1 and 2. Since all waste is directed to the sanitary landfill without prior screening in Scenario 3 (a common practice in Brazil, as the majority of the cities still do not have specific organic waste collection and treatment systems; Alfaia et al., 2017), its higher impact concerning the other two scenarios can be linked to the increase in emissions coming from waste transport and emissions linked to landfilling practices. The implementation of company-wide composting and circular practices are then proved to be beneficial to the studied system.
Circularity assessment
Circularity transition indicators
CTI results are shown in Table 5. For the detailed results of marginal indicators related to the “Close the loop” indicator group, please refer to Table SM 09, located in the Supplementary Material.
Circular Transition Indicators Results
Scenario 1 presents a much higher value for the “% of circular inflow” indicators than the other two scenarios. This difference is linked to how CTI handles food inputs in its methodology. Agricultural products are mainly modeled as being part of a regenerative system, in which the production process is linked to the cycling of nutrients and promotion of soil maintenance and health. Since the analyzed systems use mainly agroecological food inputs, that reasoning fits the described results. Such logic explains the high value found for Scenario 1, in which the majority of items are agricultural products.
According to the CTI guidelines (WBCSD, 2019a), meat and dairy production cannot be categorized as regenerative or renewable inflows (Table SM 10), ultimately not accounting for them as “circular inflows.” In this case, the inputs were categorized as “linear inflows,” resulting in a drastic variation between the baseline scenarios, and the other two is directly related to dietary changes. Regarding Scenario 3, the rise of 2% in this indicator relates to the use of single-use packaging and containers and the exclusion of internal reuse practices applied in Scenario 3.
The circular outflow indicator is mainly directed to the EoL phase. Due to the identical waste management practices applied to Scenarios 1 and 2, the same results were found for these two cases. The lower results found for Scenario 3 are caused by the exclusion of composting, reuse, and recycling. Still, this scenario showed a substantially high result for this indicator. That occurred because CTI recognizes food consumption as part of the biological cycle of CE since the nutrients are being retained by the client, and therefore labels it as circular outputs. Thus, Scenario 3 results are driven by the consumption of meals by clients and not the implementation of linear waste treatment practices (landfilling).
The baseline scenario showed the best circularity performance between the three scenarios, followed by Scenario 2 and 3. Since circularity is calculated through the weighted average between the last two discussed CTIs, results are closely linked to the reasoning previously presented. CTI's outcomes show high percentages for all scenarios since the system is almost entirely based on inputs coming from the biological cycle of CE. However, the assessment also proves that the implementation of zero-waste practices by the organization results in higher circularity.
The substantial difference between Scenario 1 and 2 also shows the influence of plant-based diets in the system's overall circularity, as clearly expressed by the decrease of 24% in this indicator. Furthermore, the regular restaurant scenario is circa 30% less circular than the baseline scenario, stressing the negative implications of linear waste treatment strategies under the CE rationale.
Waste hierarchy index
Table 6 shows the results encountered for WHI for each of the Scenarios. Since the same inputs and treatment practices are applied for Scenario 1 and 2, results are the same for this indicator for these two cases (51%). Since the WHI formula penalizes the implementation of linear waste treatment options and all waste is directed to the landfill in Scenario 3, it resulted in a worse outcome in comparison to the other scenarios. Results show that the waste management practices applied to Scenario 1 deliver a better performance concerning the system waste hierarchy. On the opposite side, with outcomes relatively close to the negative maximum accepted by WHI, Scenario 3 represents the technical gap between linear and circular practices when it comes to waste hierarchy.
Waste Hierarchy Index Results
Discussion
Organizational life cycle assessment
Results show that the main environmental hotspot is the input of meat and dairy into the system (Scenarios 2 and 3). These findings are in line with other LCA studies that analyzed dietary choices in different contexts and argued that the plant-based diets present higher environmental benefit (Bruno et al., 2019). In fact, these outcomes echo the conclusions drawn by the work of Chai et al. (2019), which indicates that there is a wealth of evidence supporting a transition to a more sustainable food system, in which plant-based diets substantially contribute to the reduction of impacts related to agrifood system and further strengthens the implementation of circular and bioeconomy strategies.
Figure 6 illustrates the difference that such dietary change causes in the environmental impacts of the foodservice business. Scenario 3 opposes the environmental profile of the plant-based restaurant described by the baseline scenario. Therefore, we argue that the rise in consumer perception regarding sustainability-related topics sets the ideal platform for the development of circular business models in the agrifood system (Naspetti et al., 2021). However, as pointed out by Chai et al. (2019), for a plant-based diet to deliver its full benefits, local products that minimize the environmental impact of transport should be preferred.
The influence of localism is also highlighted in the results of this study. As illustrated by Fig. 6, the main driver of all scenarios is the P&P phase. Although separated for methodological reasons in this study, P&P and L&T are strongly intertwined in the day-to-day activities of the agrifood sector. Consequently, based on the discrepancies found between the results encounter for Scenario 2 and 3, we reaffirm the benefits of local food production as a means to lower the environmental impact of value-chains. By applying localism to their sourcing practices, businesses may reduce their environmental footprint by reducing transport emission, shortening of value-chains, and ultimately contributing to the development of local communities.
Scenario 3 outranked the other two in seven out of nine impact categories. These findings imply that the foodservice sector can be a platform for the implementation and spreading of CE principles. We highlight the positive impacts of the CE practices applied by the baseline scenario. This case study evidences that movement to a CE-based rationale in the foodservice can steer the transition from the entire value-chain toward CE, as the operationalization of its practices like large-scale composting, recycling, and changes in packaging options are innately collaborative between many stakeholders. Therefore, if upscaled to larger systems, the practices implemented in Scenario 1 could further contribute to tackling climate issues and contributing to CE.
On the methodological aspect of OLCA, we reaffirm that one of the main challenges of OLCA in the foodservice sector is linked to data collection procedures, already evidenced by Jungbluth et al. (2016). Data collection is a common limitation in OLCA projects, especially regarding the invariability of primary data and information regarding supporting activities (Martínez-Blanco et al., 2020).
Since catering facilities frequently rely on an enormous number of supplies, data collection may become exhaustive and time-consuming. The authors found it to be helpful to follow an often disregarded procedure described in UNEP (2015)—the identification of indirect and direct activities (Fig. 2). This approach allows the user to not only identify points of improvement that can be carried out directly and indirectly by the organization but also clearly determine which data to pursue during the LCI development phase.
Circularity assessment
The circularity indicators applied have different methodological features, and therefore present distinct system boundaries and calculation procedures. However, Tables 5 and 6 show that they pointed in the same direction in the presented project.
CTI results indicate that the use of this method is expected to deliver high circularity scores when applied to any other system, in which food plays a major role as the final destination of inputs. That happens because food consumption is held as a preferable option in CTI's hierarchy (WBCSD, 2019a), translating into the full recovery of the nutrients and components linked to the agrifood system. Therefore, we argue that careful understating of the cascading hierarchy and recovery levels (Table SM 10) presented in CTI's methodology is of ultimate importance to avoid misconceptions and overestimations of the results encountered.
WHI delivers straightforward results that can be used by decision-makers to steer a system's waste management strategies toward a more favorable context in light of the waste hierarchy principles. However, it is important to stress that WHI's methodology only accounts for the outflows of the system. Authors believe that WHI results can provide stakeholders with an initial understanding of how circular the waste management practices or their business is (or can be), which could be further explored in depth through the combination with other methodologies to deliver optimal outcomes.
Finally, circularity indicators point at how aligned a product/system is concerning the CE through by analyzing its material and energy flows, and therefore commonly lack information regarding a system's environmental performance (Harris et al., 2021). In addition, neither CTI nor WHI were able to deliver useful information on the effects of localism, one of the main traits of CE. Hence, the authors maintain that a combined approach using OLCA in parallel with the aforementioned circularity indicators delivers a comprehensive understanding of the system's circularity and environmental burdens.
Combined assessment of circularity and environmental impacts
To provide a clear understanding of how the methodological tools applied in this study can contribute to the CE context, Table 7 was developed to summarize the main strengths and weaknesses of each method applied.
Strengths and Weaknesses of the Applied Methodologies
CE, circular economy; EoL, end of life.
The main limitations of this integrated approach come from the intrinsically different boundaries of the methodologies. However, we would like to stress that OLCA and CTI are both capable of covering cradle-to-grave assessments, capturing the impact and influence in the circularity and environmental burdens from the value-to-chain to the EoL phase. Given the availability of data regarding value chain actors, both methodologies enable the extension of the analysis to the supplier network of the analyzed companies. This methodological alignment between OLCA and CTI can be seen as one of the greatest strengths of this approach, which is capable of enabling an integrated circularity and environmental impact assessment.
On the contrary, WHI is only directed to the EoL phase, this difference might be seen as an unresolvable limitation. Even though the concepts share similarities, it is also important that the highlight of the WHI is built upon the concept of waste hierarchy, not circularity. Therefore, future applications of the approach here presented might choose to leave this indicator out of the combined assessment. This adjustment would not hinder the intention of implementing a combined life cycle and circularity assessment at the organizational level but provide a more straightforward strategy. Nonetheless, we highlight that the synergy between circularity and waste hierarchy discussions demonstrates that additional information about waste hierarchy of businesses might be a relevant input to decision-makers in the building of circularity practices and goals.
Through the integrated implementation of OLCA and company-level indicators, decision-makers can make assertive and strategical resolutions based on the comprehensive analysis of their business circularity and environmental profile. To better guide future studies, Fig. 8 illustrates the methodological pathway followed by this research. The procedures illustrated are interlinked by one principal factor: data availability. The data gathered for the LCI phase of OLCA was used for the calculation of CTI and WHI. Since OLCA takes a broad approach in identifying all direct and indirect activities of an organization (Fig. 2), all the information needed for the circularity indicators was already available before the circularity assessment.
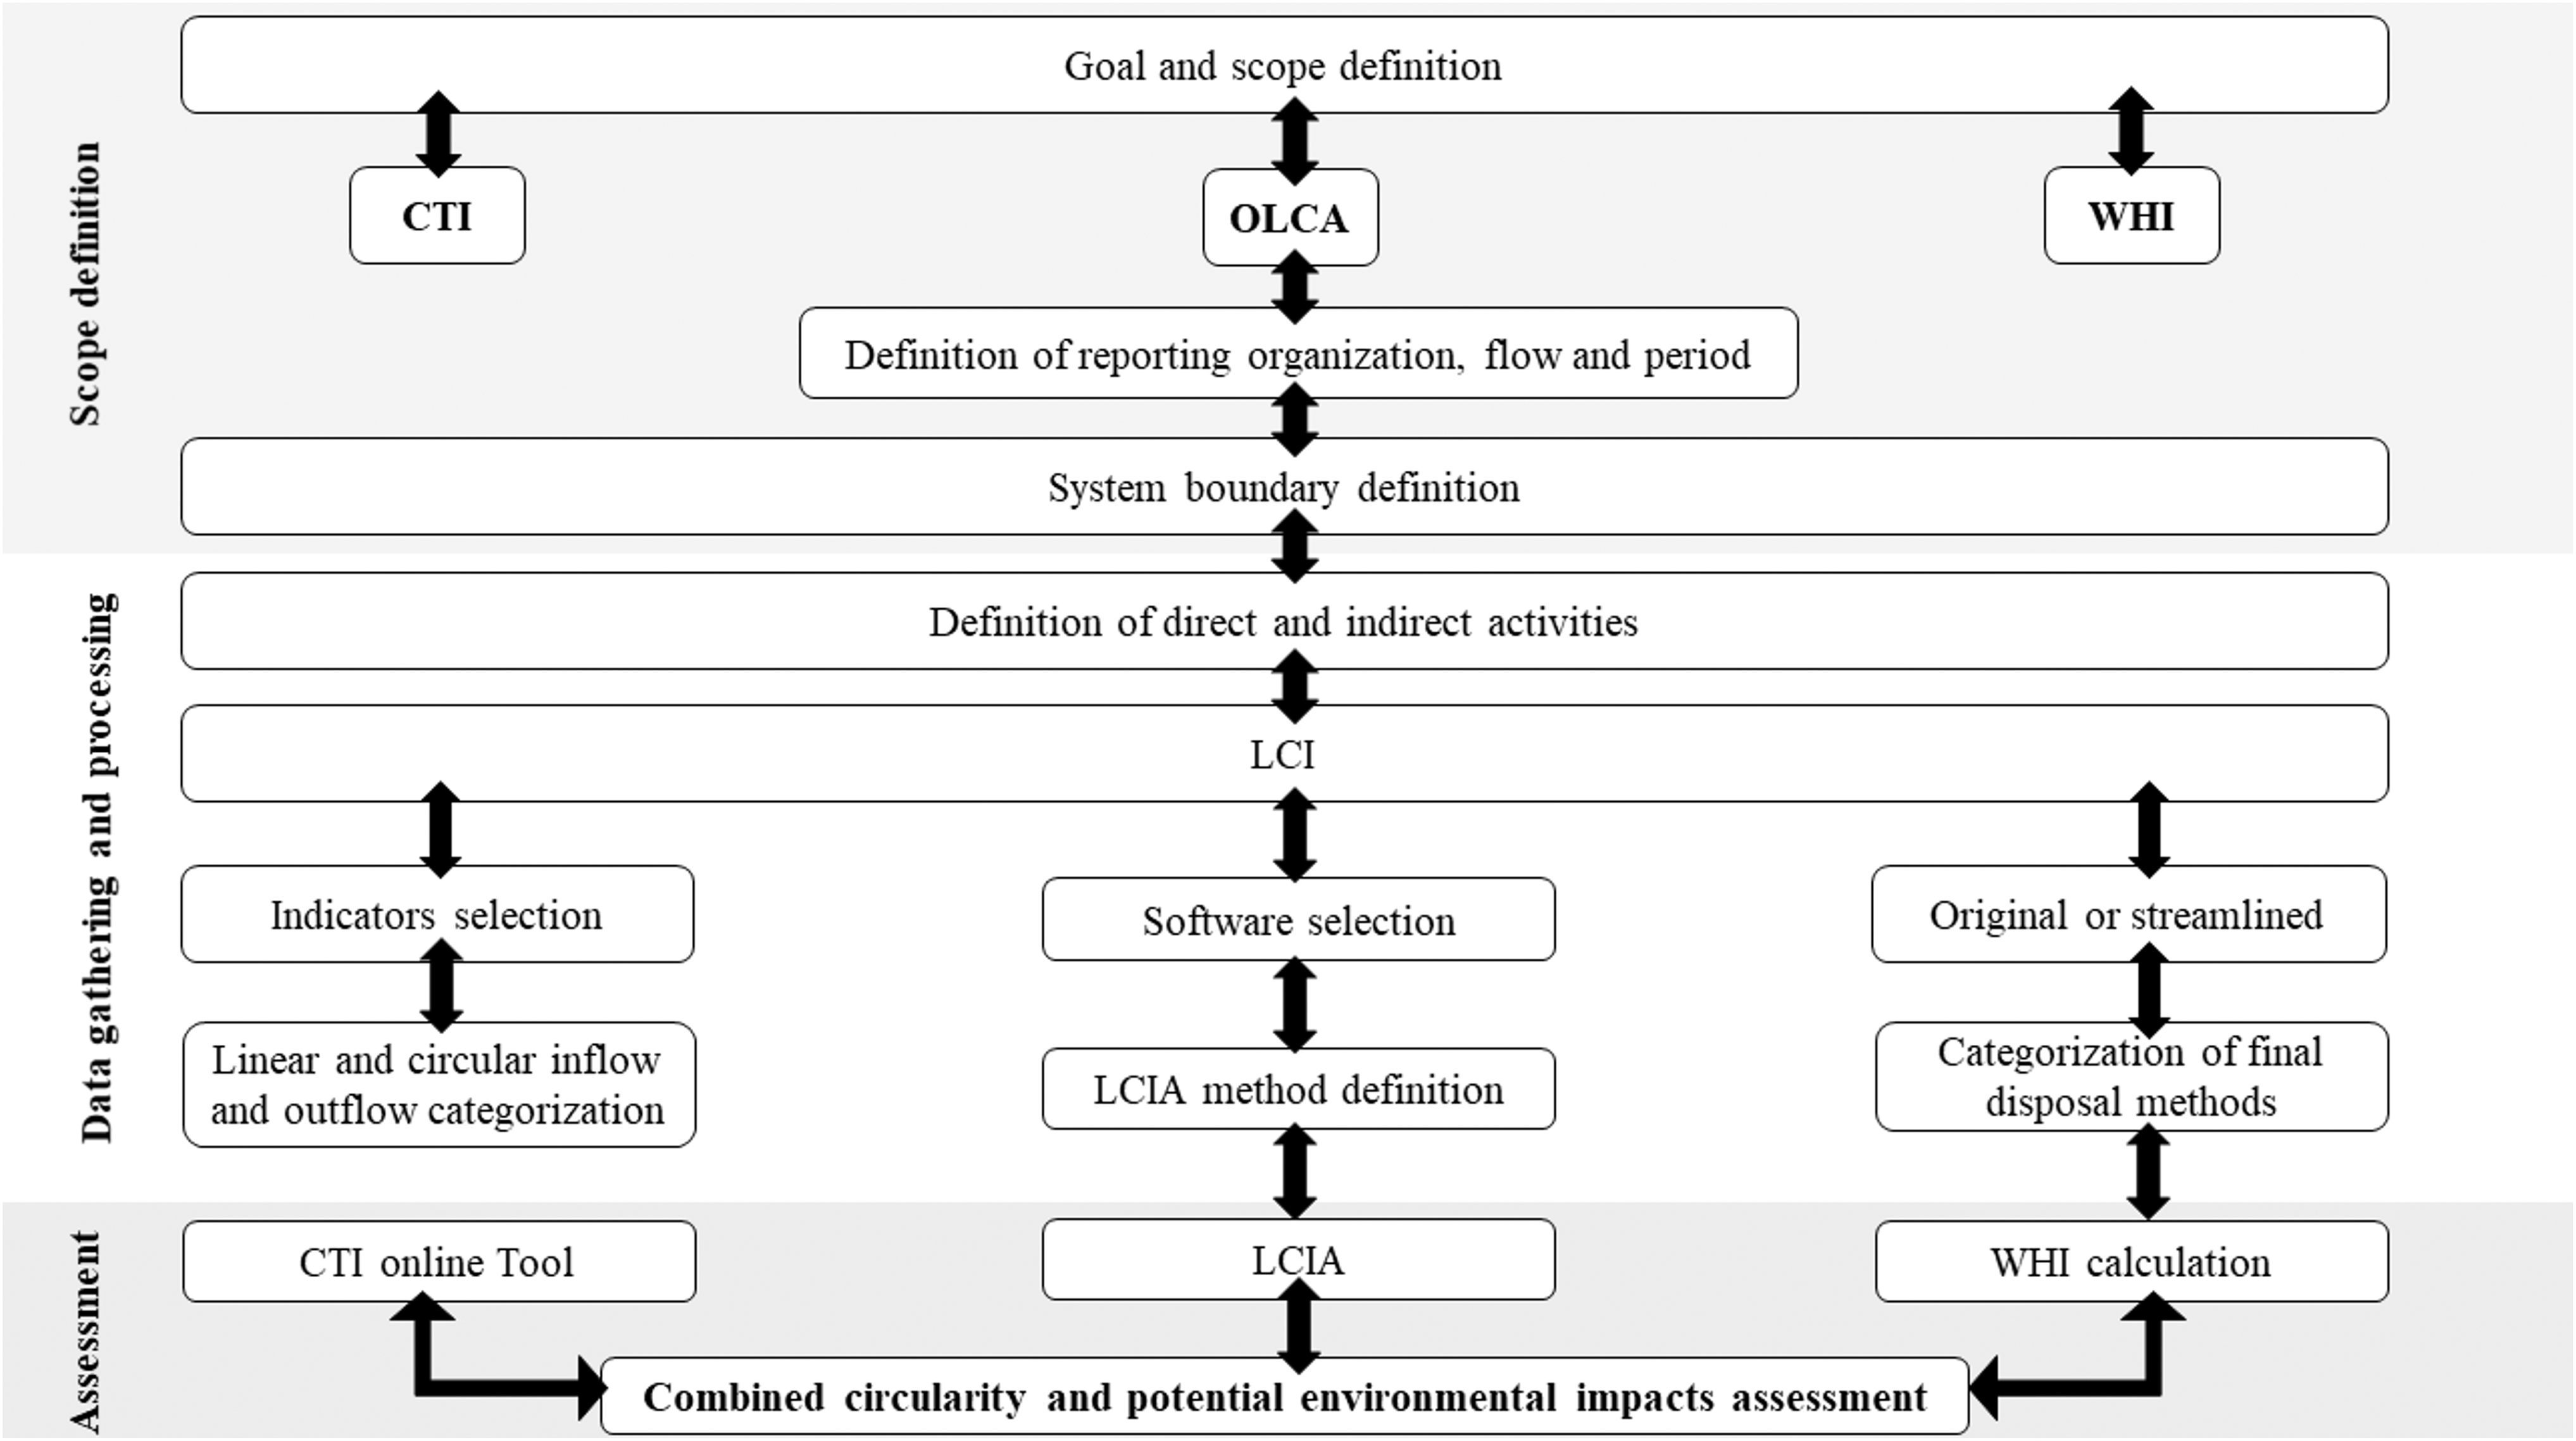
Methodological pathway for the combined circularity and environmental impact assessment.
Due to this central feature, the authors found the triple assessment provided to run efficiently effort- and timewise. In addition, even though this work focused on the foodservice sector, due to the holistic nature of each method applied, this approach can be replicated in companies and sectors from different backgrounds.
Conclusions
The benefits of moving toward a system more closely aligned to the CE and the opportunity of SMEs to contribute to this transition have been extensively discussed in the recent literature. This research adds to this scientific niche by providing a combined life cycle and circularity assessment of a vegan zero-waste restaurant in Brazil. As the current literature mainly focuses on the alignment between LCA and circularity indicators at the product level, our study innovates by providing a methodological pathway for this dual analysis at the organizational level.
This approach is capable of not only identifying the environmental hotspots related to a companies’ business but also provides insights regarding its circularity and waste hierarchy. Since such quantitative assessments are often resource- and time-consuming, practitioners may profit from this strategy due to similarities in the processes carried during the analysis. Furthermore, we argue that this combined approach based on the simultaneous applications of OLCA and company-level circularity indicators better equips decision-makers to understand the circularity, waste hierarchy, and potential environmental impacts of their business through a comprehensive and science-based methodology.
The baseline scenario performed better in eight impact of nine categories assessed (ex: carbon footprint of a regular restaurant was 26% higher than the reported organization), the only exception being the WDP category. CTI characterized the three scenarios as being 91%, 67%, and 62% circular, respectively. WHI results were 51% for Scenarios 1 and 2, and −83% for Scenario 3. Meat and dairy production was the main hotspot in the outcomes of all three methods applied. Moreover, the P&P phase was appointed as the main driver, responsible for more than 83% of the impacts in all scenarios.
The main limitation of this study was related to extensive data collection process and the level of preparedness of value-chain members, who commonly lacked the environmental awareness and/or internal data gathering processes critical to this work. Future studies could apply the same approach to organizations part of other sectors, potentially testing our approach to larger business. In addition, future research could study the alignment of company-level circularity indicators and Life Cycle Sustainability Assessments to provide a comprehensive and combined circularity and sustainability assessment of organizations.
Footnotes
Acknowledgment
The authors acknowledge and thank Casa Origem for providing all data necessary for the development of this study.
Authors’ Contributions
T.E.T.D.: Conceptualization, methodology, software, data curation, writing—original draft, writing—review and editing. L.F.S.A.: Conceptualization, writing—review and editing. S.R.S.: Validation, supervision.
Author Disclosure Statement
No competing financial interests exist.
Funding Information
This work was supported by the Brazilian Coordination for the Improvement of Higher Education Personnel (CAPES).
References
Supplementary Material
Please find the following supplemental material available below.
For Open Access articles published under a Creative Commons License, all supplemental material carries the same license as the article it is associated with.
For non-Open Access articles published, all supplemental material carries a non-exclusive license, and permission requests for re-use of supplemental material or any part of supplemental material shall be sent directly to the copyright owner as specified in the copyright notice associated with the article.