




Abstract
The effectiveness of formic acid on partial nitrification in sequence batch reactor (SBR) is studied. In addition, the mechanism for achieving and maintaining stable partial nitrification by formic acid is also analyzed. The results of the long-term effect of formic acid on partial nitrification showed that when formic acid was not added, the effluent was primarily nitrate. After adding formic acid for 1 week, the partial nitrification operated stably, and the average ammonia conversion rate and nitrite accumulation rates were 99.25% and 89.41%, respectively, while the yield of nitrite was only 46.22%. After stopping formic acid dosing, the partial nitrification was maintained for ∼20 days, and during this period, the nitrite yield increased to 85.89%. The high-throughput analysis of the activated sludge samples showed that the ammonia oxidizing bacteria (AOB) Nitrosomonas and Sphingomonas only presented in the formic acid system. The denitrifiers Acidovorax, Bacillus, Comamonas, Flavobacterium, Lactococcus, Paracoccus, Terrimonas, and Thauera enriched when the formic acid was added. The long-term effect of formic acid on partial nitrification was consistent with the results of the molecular operating environment simulation analysis and the high-throughput sequencing analysis. Therefore, formic acid was considered to be responsible for the partial nitrification process in this study. By measuring the oxygen uptake rate, the activities of AOB and nitrite oxidizing bacteria (NOB) were analyzed, and the results indicated that formic acid dosing promoted AOB activity more than inhibiting NOB.
Introduction
Nitrogen pollution in an aquatic body causes great harm to the human living environment. Ammonia is the most common cause of nitrogen pollution in an aquatic body. Excessively high ammonia in an aquatic body of water causes the vicious reproduction of certain algae, and this leads to the eutrophication of the waterbody and destroys the aquatic ecological balance (Zhang et al., 2019a, 2019b, 2019c; Chen et al., 2020a, 2020b). A high concentration of ammonia into a receiving waterbody will consume the dissolved oxygen (DO) in the waterbody, causing the waterbody to become hypoxic, black, and stink, and this will reduce the esthetic value of a waterbody. A high concentration of ammonia is toxic to aquatic animals, and damages the growth and reproduction of aquatic animals and also causes more serious harm to human health.
Currently, biological nitrogen removal is the primary method of nitrogen treatment in wastewater (Wang and Chu, 2016; Chen et al., 2017; Liu et al., 2018; Xia et al., 2020; Pang and Wang, 2021), but conventional biological nitrogen removal technologies consume large amounts of oxygen, carbon sources, and alkaline. In addition, the complex technological process of wastewater treatment has a high chemical oxygen demand (COD), high ammonia, high suspended sediment (SS), and a low carbon-to-nitrogen (C/N) ratio (Chen et al., 2015, 2020; Deng et al., 2020; Huang et al., 2020; Pelaz et al., 2018). Therefore, in recent years, the development of new nitrogen removal processes with high efficiencies and low consumptions has become a research hotspot (Chen et al., 2020b).
Partial nitrification is considered to be an effective method to treat wastewater with high ammonia and a low C/N ratio (Li et al., 2020). Partial nitrification can reduce ∼25% of the oxygen demand and 40% of the organic carbon source. This shortens the hydraulic retention time of the system, is simple to operate and manage, produces less sludge, and is compact, efficient, and produces energy savings (Li et al., 2018). Since partial nitrification is also a rate-limiting step of anaerobic ammonium oxidation (ANAMMOX), oxygen-limited autotrophic nitrification–denitrification (OLAND), single reactor for high activity ammonia removal over nitrite (SHARON), and completely autotrophic nitrogen removal over nitrite (CANON), the start-up and maintenance of the stable operation of partial nitrification play a very important role in the operation of these processes (Wang et al., 2020a).
The key to achieving partial nitrification is to weed out nitrite oxidizing bacteria (NOB) and retain ammonia oxidizing bacteria (AOB) (Wei et al., 2018; Cui et al., 2019), so as to control the nitrification process in the NO2−-N stage and inhibit the transformation process from NO2− to NO3− (Ma et al., 2015; Bao et al., 2017). The factors that affect the activity of AOB and NOB are DO, pH, the C/N ratio of the influent water, free ammonia, temperature, the sludge retention time (SRT), the inhibitor, and other factors (Dong et al., 2017; Huang et al., 2019; Jianlong and Ning, 2004).
During the actual wastewater treatment process, owing to the complex composition of wastewater and many influencing factors, the control of a single influencing factor is difficult to achieve to realize and maintain the stability of partial nitrification and denitrification, and the addition of chemical inhibitors can achieve the rapid accumulation of nitrite.
Formic acid is an environmentally friendly organic compound that is widely used in various manufacturing industries (Wang et al., 2020a). Previous studies, as well as our own research, reported that the presence of formic acid in wastewater could hinder full nitrification (Eilersen et al., 1994; Delgado et al., 2004; Elefsiniotis and Li, 2006; Li et al., 2017; Wang et al., 2020a). Nevertheless, limited research has been performed regarding the mechanism of this process.
Therefore, the primary objectives and innovations of this study were to (1) investigate the effects of formic acid on nitritation to partial nitrification; (2) determine the sludge characteristics under formic acid; and (3) explore the impact mechanism of formic acid effects on partial nitrification.
Materials and Methods
Configuration of the sequencing batch reactor and operation
The experiments were conducted in two identical pilot-scale sequence batch reactors (SBRs), reactor a and reactor b (shown in Fig. 1: effective volume 14 L). The effect of formic acid on partial nitrification was studied in reactor a, and the comparative experiment without formic acid was carried out in reactor b. Every operational cycle consisted of 5 min of feeding, 420 min of aeration and stirring, 30 min of settling, and 5 min of draining, and these were controlled using time switches. The experiment was conducted at ambient temperature (22–26°C), the pH was 7.5–8.0, the DO concentration was maintained above 2.0 mg/L, and the SRT was 10 days.
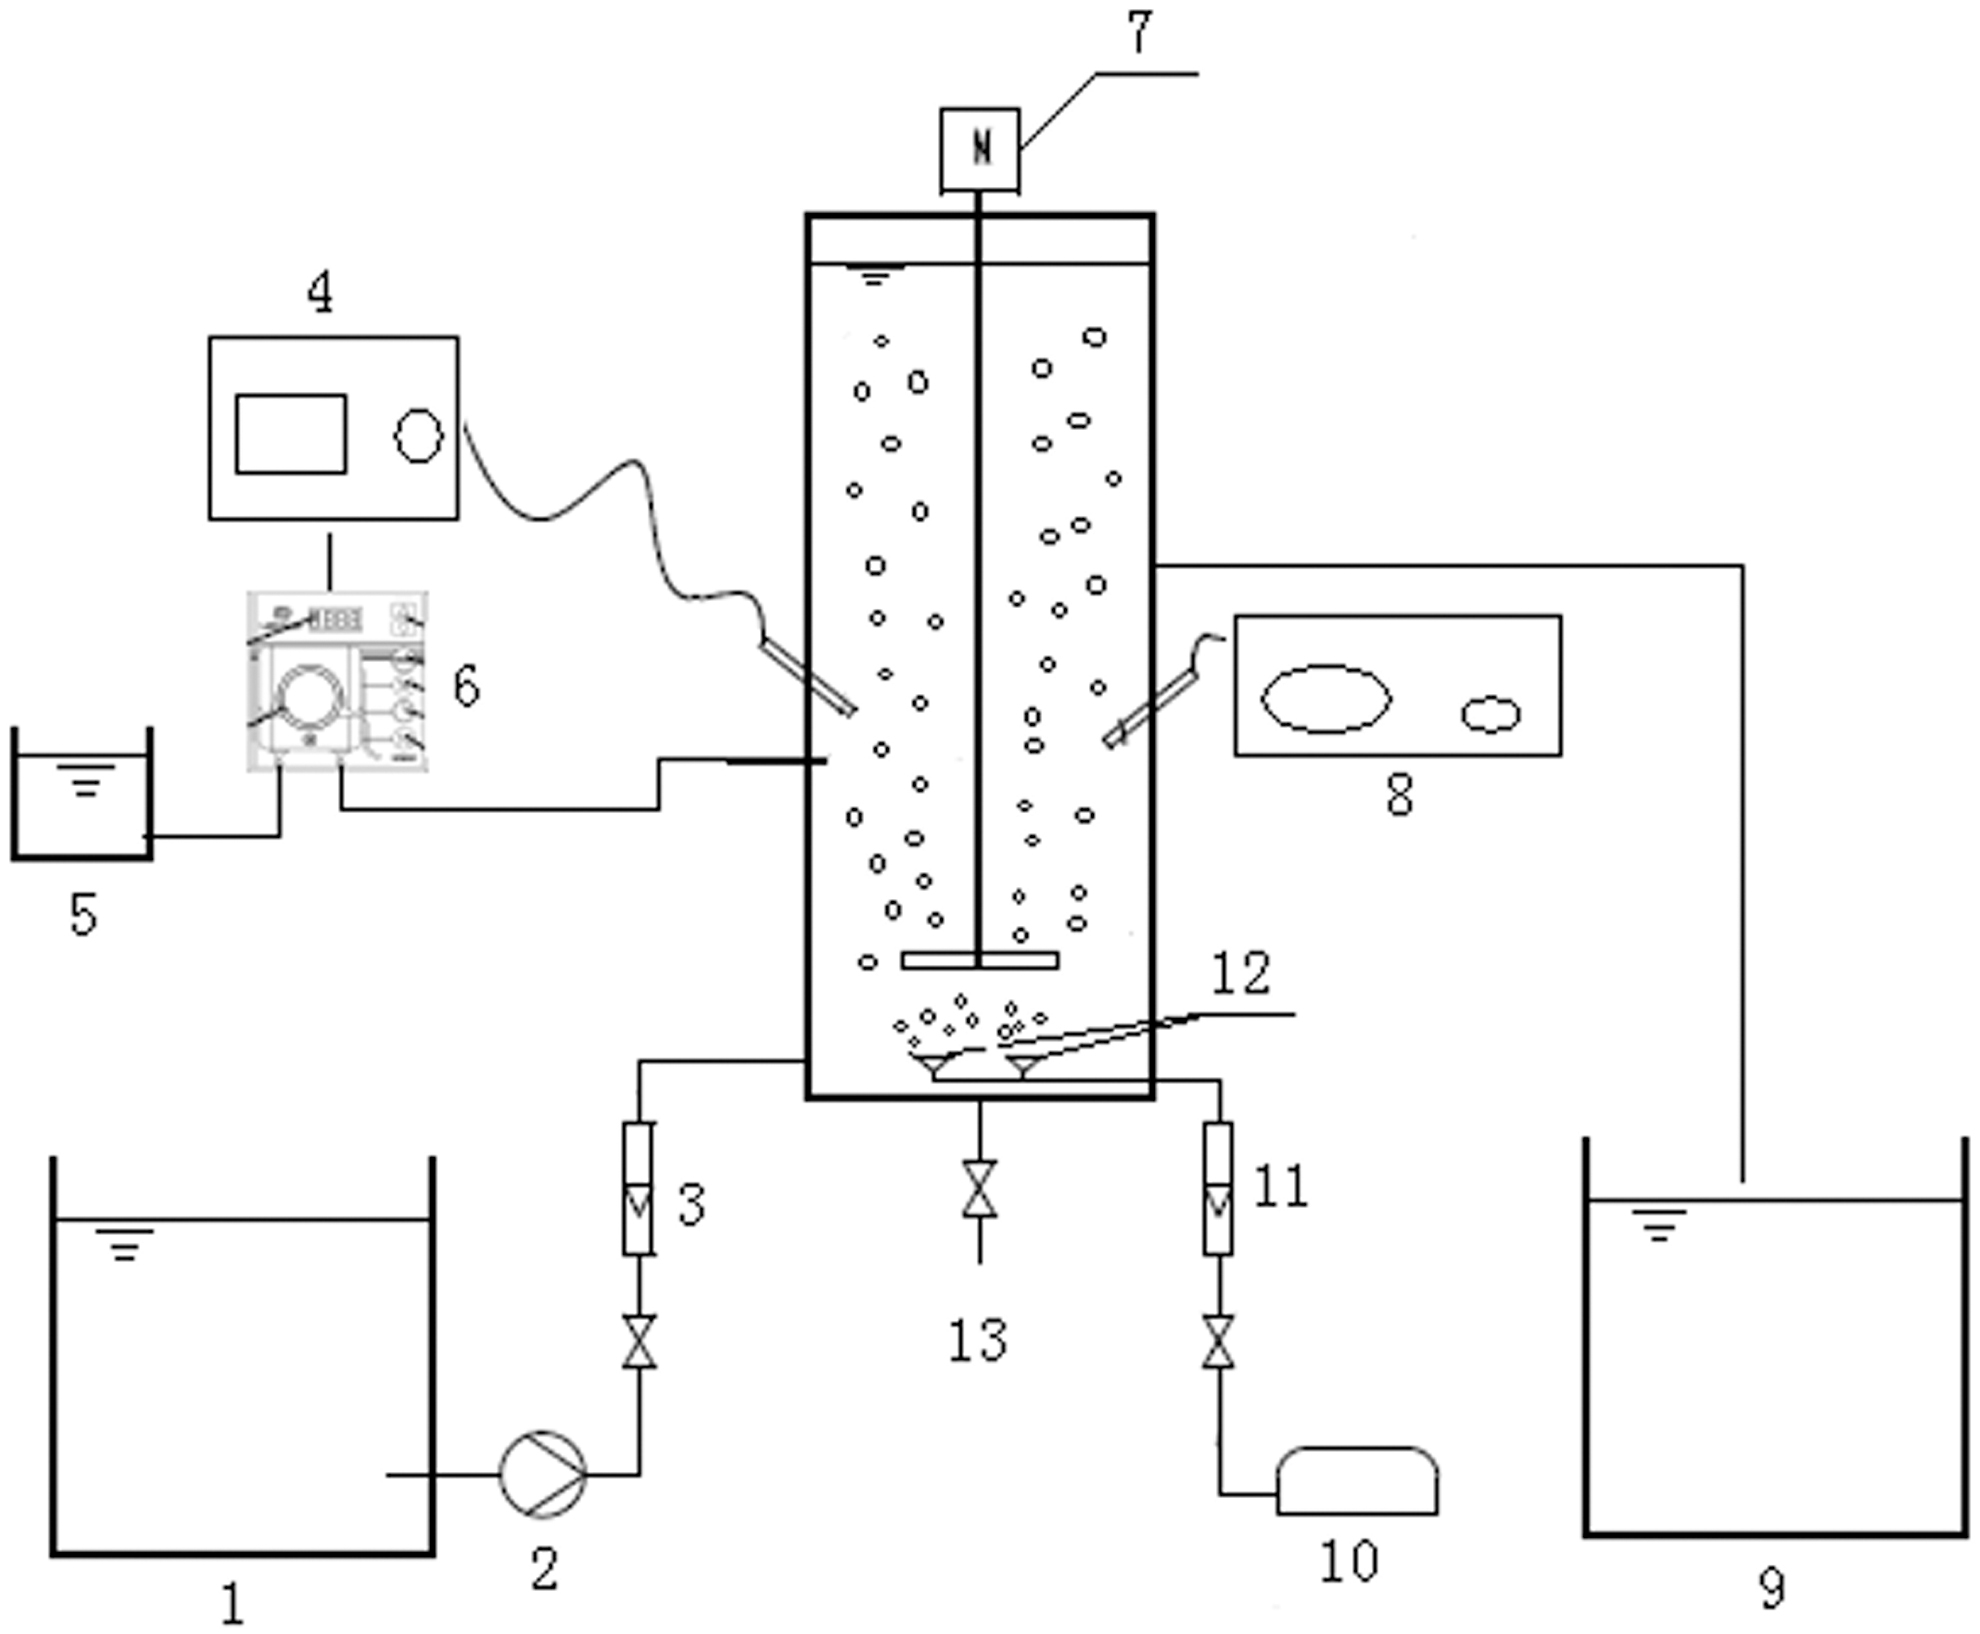
Schematic diagram of SBR (1, influent tank; 2, influent pump; 3, liquid flow meter; 4, pH online monitor; 5, dosing box; 6, dosing peristaltic pump; 7, stirrer; 8, temperature controller; 9, effluent tank; 10, blower pump; 11, air flow meter; 12, aeration diffuser; 13, discharge valve). SBR, sequencing batch reactor.
The inoculation sludge was collected from the Shenyang Southern Sewage Treatment Plant. The influent of the SBR was synthetic wastewater, in which 100 mg/L of ammonium chloride and 450 mg/L of glucose were used as the nitrogen and carbon sources, respectively. A total of 400 mg/L of NaHCO3, 4 mg/L of CaCl2, 40 mg/L of KH2PO4, 40 mg/L of MgSO4·7H2O, and 10 mL of a trace element solution were the composition of the synthetic wastewater. The composition of the trace element solution was as follows: 375 mg/L of FeCl3, 37.5 mg/L of H3BO3, 7.5 mg/L of CuSO4·5H2O, 45 mg/L of KI, 25.69 mg/L of MnSO4·H2O, 30 mg/L of ZnSO4·7H2O, 2,500 mg/L of EDTA, 50 mg/L of CoCl2·6H2O, and 20 mg/L of Na2MoO4·2H2O (Wei et al., 2014).
Analytical methods
The COD was detected using a DR3900 COD meter (HACH Company). The pH was monitored using a pH meter-FE20 (China). DO was monitored using a HACH HQ30d portable meter. The mixed liquor suspended solids (MLSS), mixed liquor volatile suspended solids (MLVSS), and NH4+–N, NO2−–N, and NO3−–N in the influent and effluent were analyzed according to the standard methods of the State Environmental Protection Administration of China (S.E.P.A., 2002).
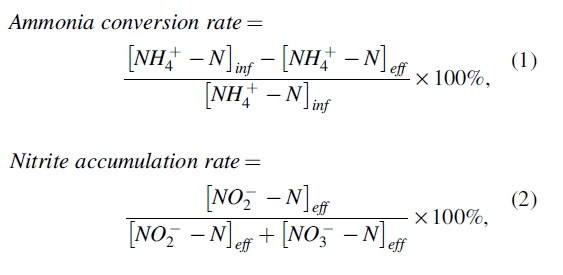
The ammonia conversion rate and nitrite accumulation rate were calculated using Equations (1) and (2), respectively.
High-throughput sequencing analysis
To determine the effects of formic acid on the microbial community structure evolution in the SBR, sludge samples were collected from the SBR for a high-throughput sequencing analysis. DNA extraction, polymerase chain reaction amplifications, and amplicon purification were conducted according to Cheng et al. (2017) and Li et al. (2017), and sequenced using the Illumina-MiSeq platform (Shanghai Majorbio BioPharm Technology).
Molecular operating environment molecular simulation
The interaction between proteins and small molecules can be intuitively understood by using a molecular operating environment (MOE) for molecular docking. Ammonia monooxygenase (AMO) and hydroxylamine oxidoreductase (HAO) are the key enzymes of all AOB that dominate the entire bacterial metabolic process. Nir–Cu and NXR are the key enzymes of denitrifying bacteria and NOB that dominate the metabolism process of denitrifying bacteria and NOB, respectively.
The two-dimensional (2D) molecular structure of formic acid was obtained using ChemDraw 2004 (CS ChemOffice, 2004) and then imported into the MOE software to obtain the three-dimensional (3D) structure of formic acid. The X-ray crystal structures of AOB AMO (protein data bank [PDB] ID: 4O65), AOB HAO (PDB ID: 4N4N), and nitrite reductase of denitrifying bacteria (Nir–Cu; PDB ID: 1sjm) were obtained from the PDB database of the Research Collaboratory for Structural Bioinformatics (RCSB) (Tocheva, 2004; Maalcke et al., 2013; Lawton et al., 2014). The 3D model of NOB oxidoreductase (NXRβ) was simulated using the Swiss-model (Guex et al., 2009; Biasini et al., 2014).
The molecular docking between protein and formic acid was conducted on the MOE platform. The docking of protein and small-molecule organic matter will produce a variety of binding methods. Generally, the tightness of the binding is comprehensively evaluated by examining the number, distance, and energy of the binding bonds between protein and small-molecule organics.
Results and Discussion
MOE molecular simulation
Molecular docking is a technique that simulates the interaction between small molecule ligands and receptors of biological macromolecules based on the "lock & key principle" of ligand-receptor interaction. The interaction between ligands and receptors is a process of molecular recognition. Through calculation, the binding modes and affinity between ligands and receptors can be predicted, and the specific mode of action and binding configuration of small molecule and macromolecular receptors can be explored. Molecular docking in our study was performed with Molecular Operating Environment (MOE) to reveal the interaction of formic acid with AMO, HAO, NXR and Nir.
The 2D and 3D diagrams of formic acid binding with AMO, HAO, NXR, and Nir (Fig. 2) showed that the number of bonding bonds between formic acid and AMO, HAO, and Nir was greater than that of NXR, which indicated that the stability of formic acid binding with AMO, HAO, and Nir was higher than that of NXR. The strongest binding bonds (the closest binding distance and the largest absolute value of binding energy) that formic acid docked with these four enzymes were selected for comparison (Fig. 3).
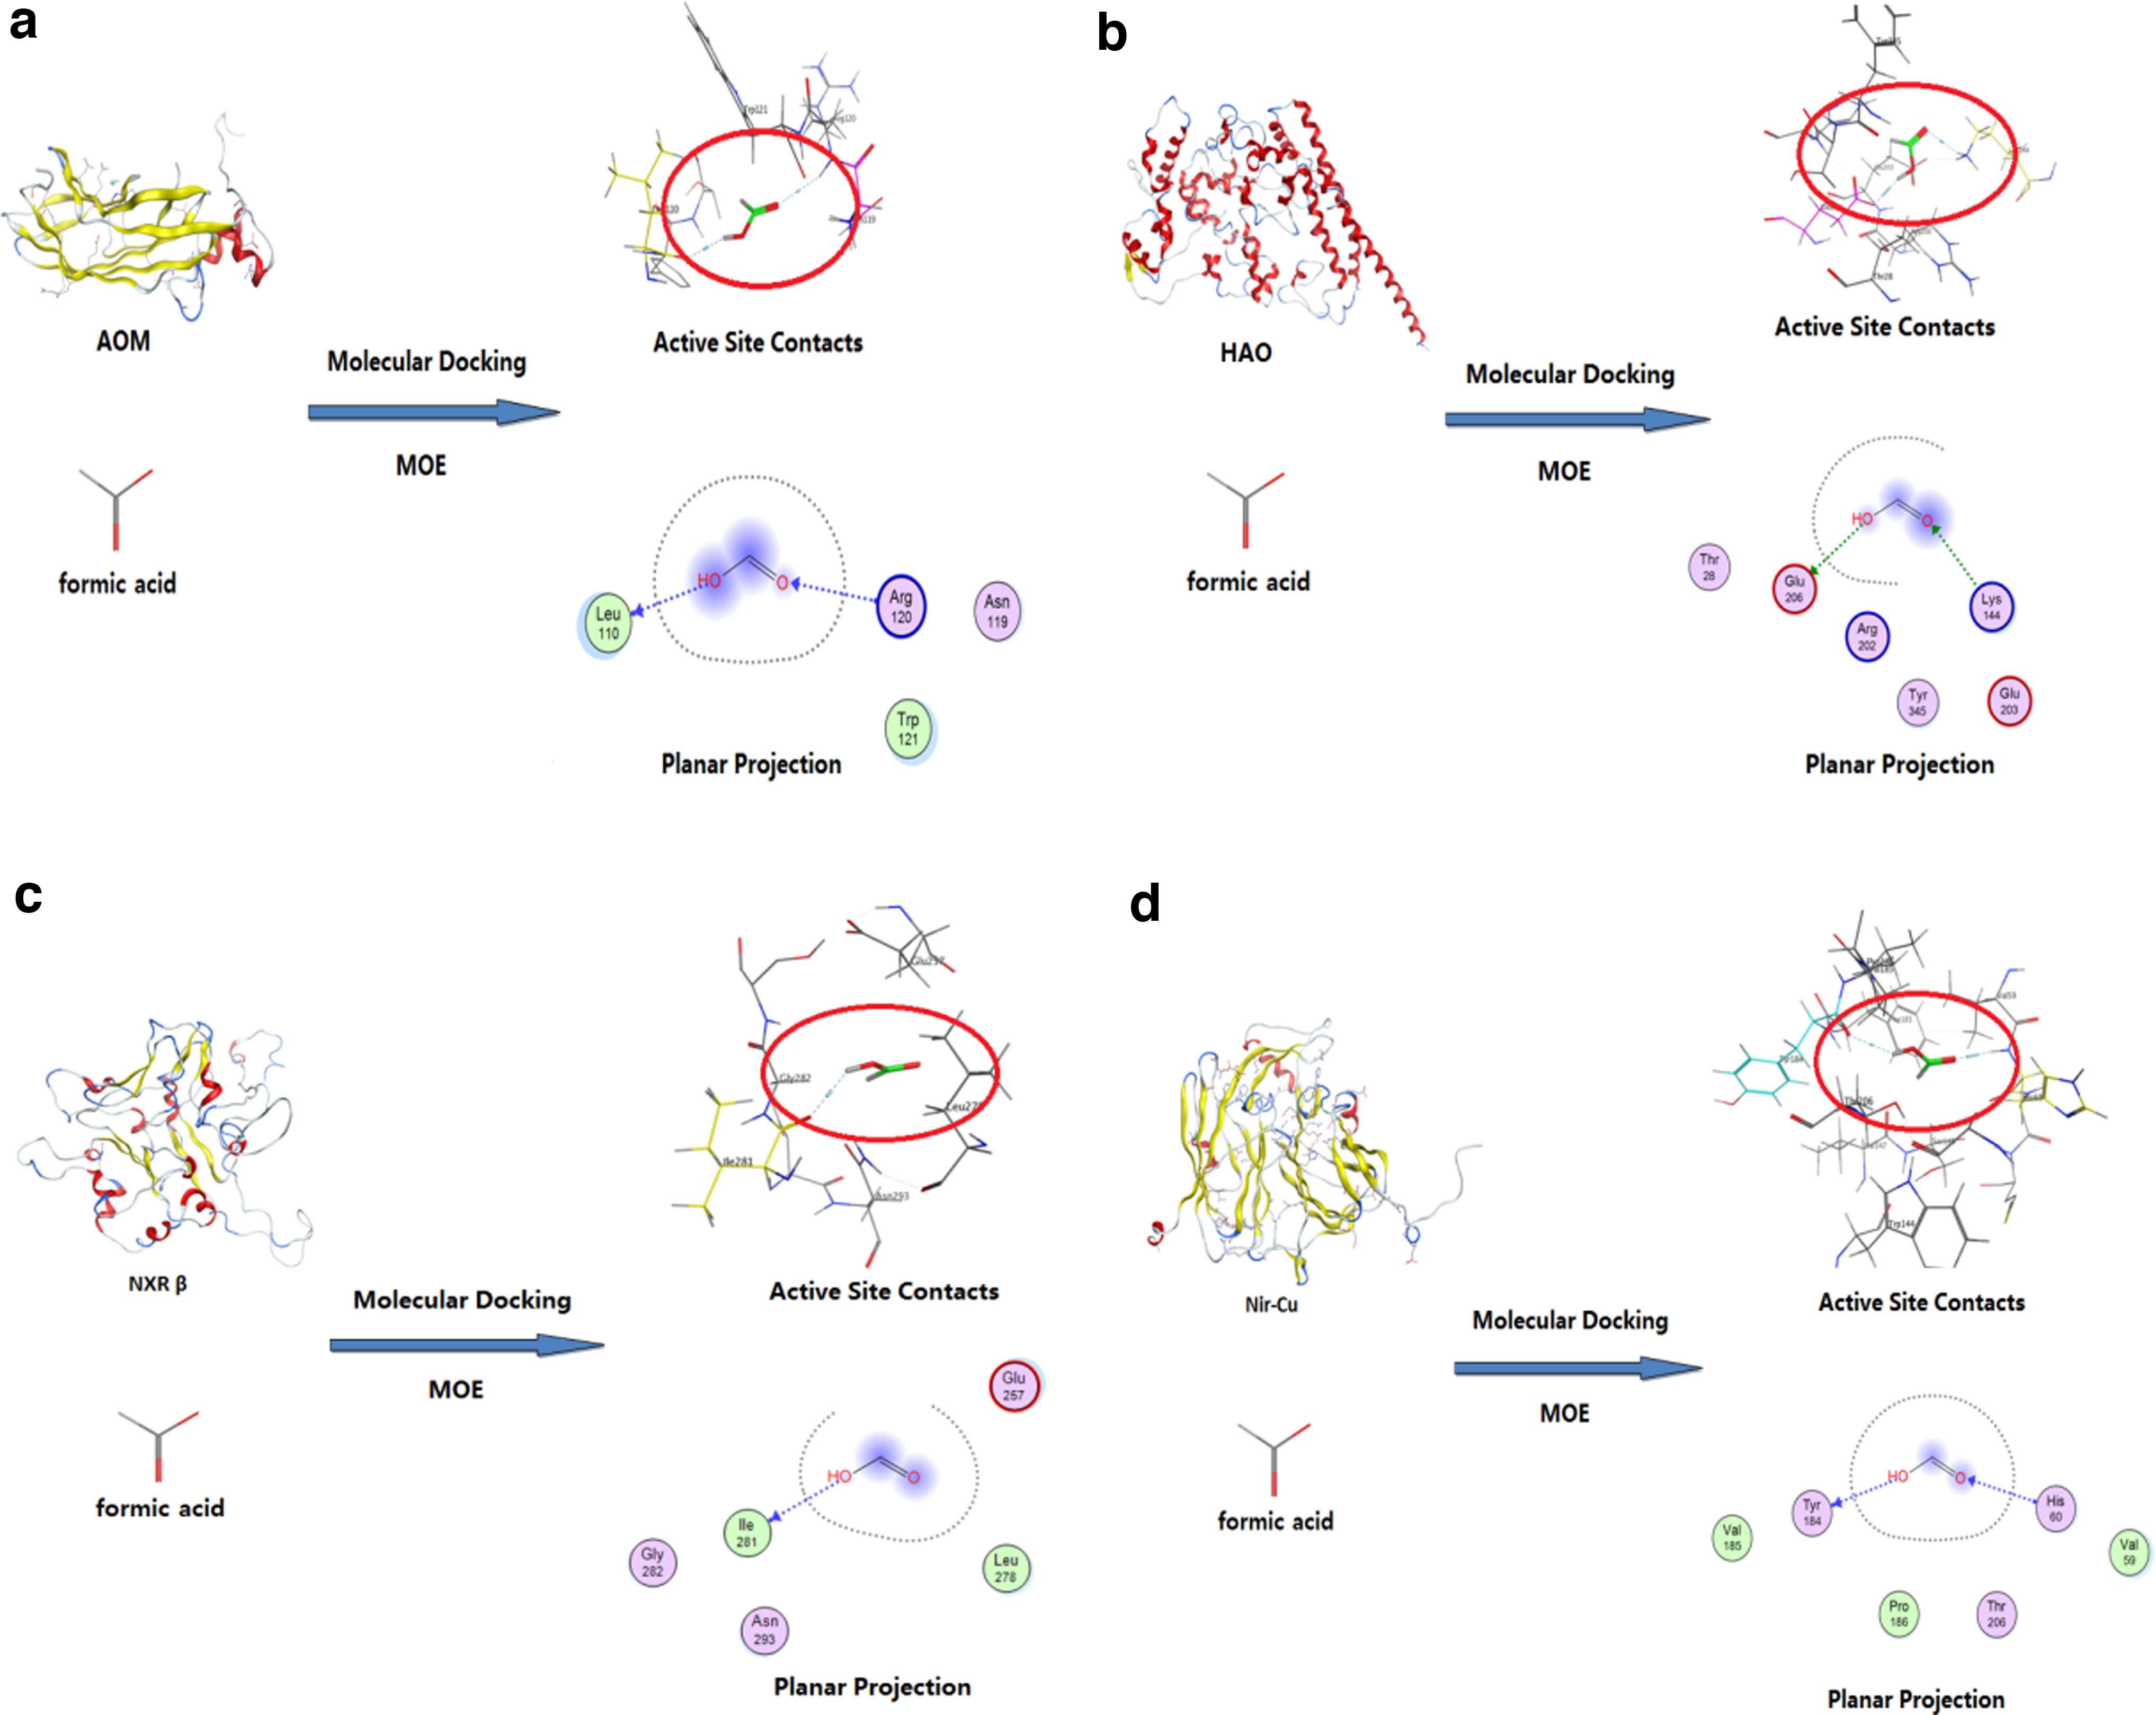
Docking conformer of formic acid and the key enzymes.
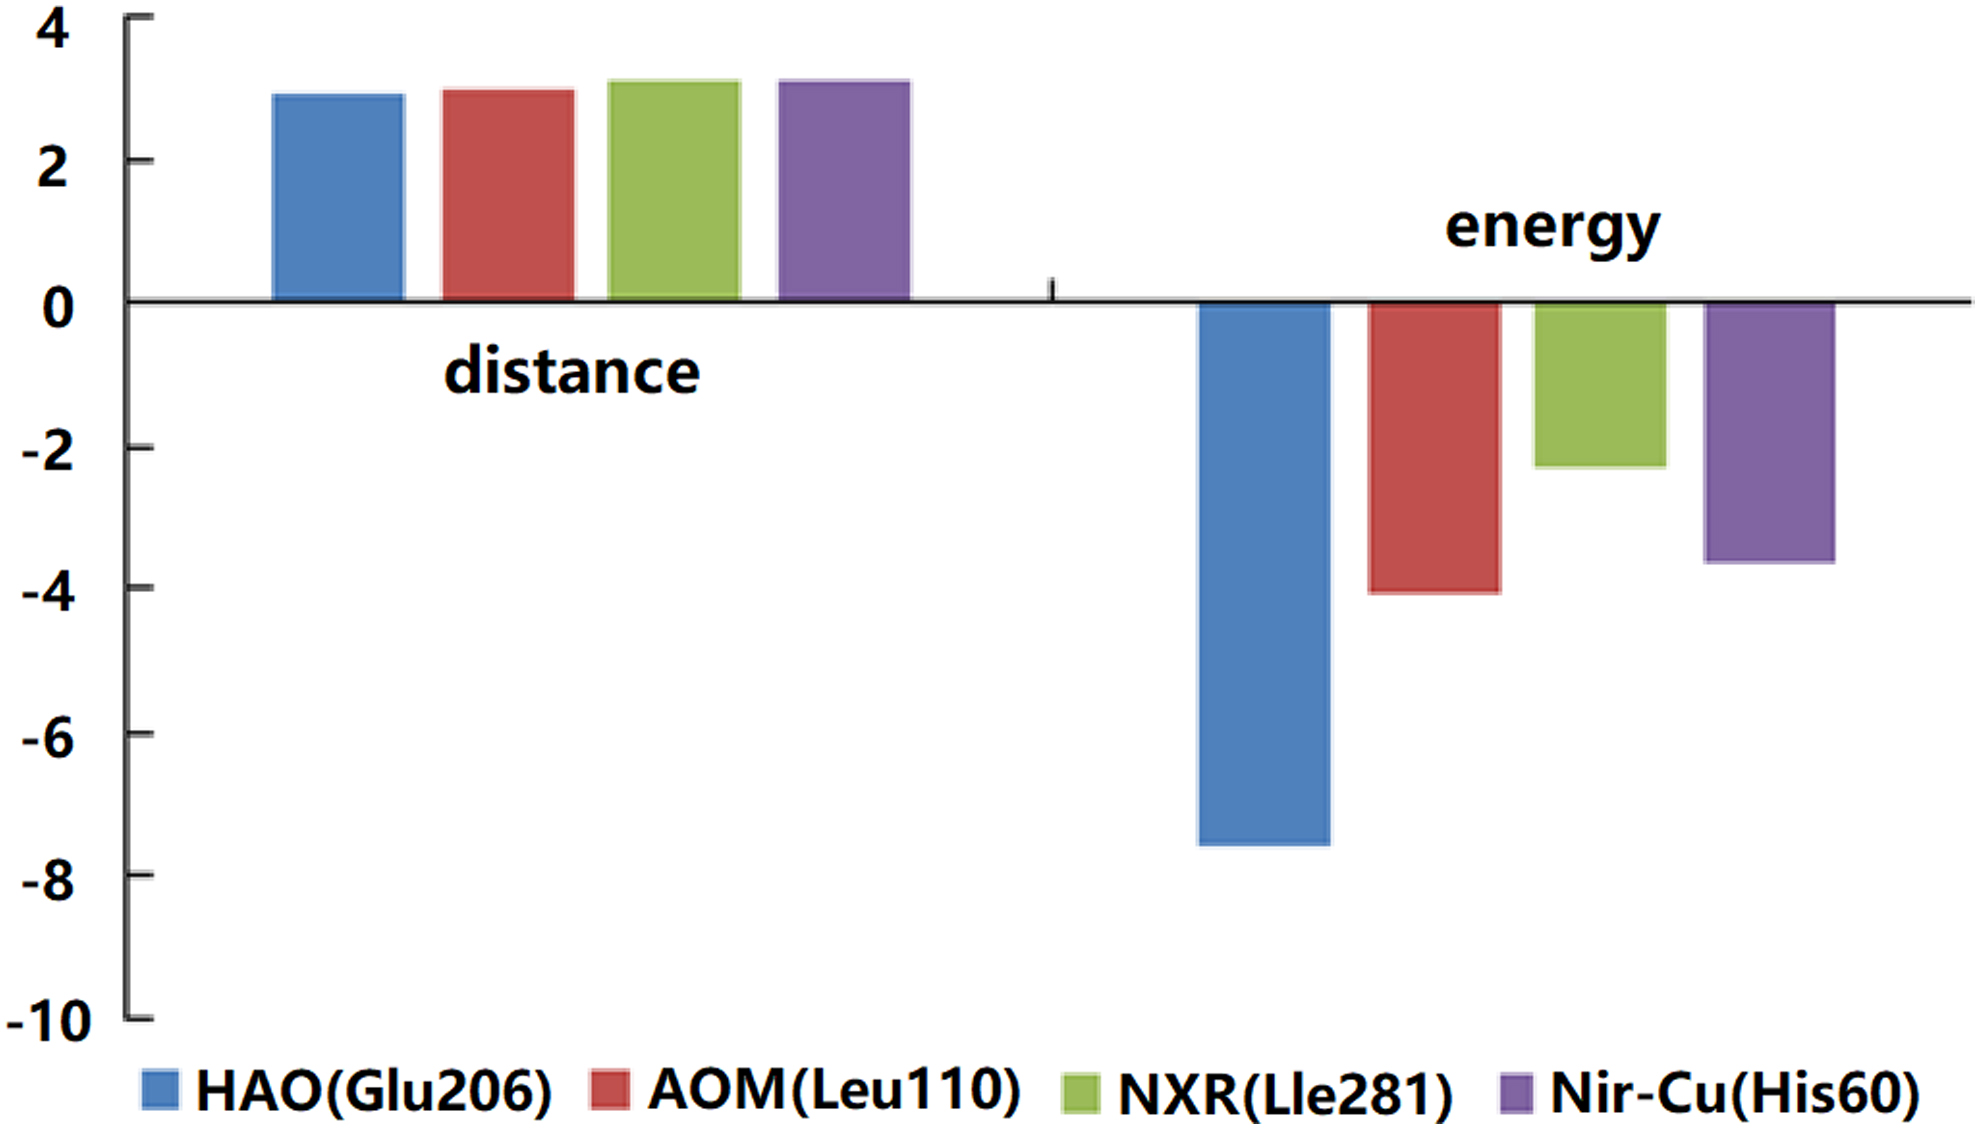
Binding comparison of formic acid and key enzymes.
The results showed that formic acid bound to the key enzyme HAO of the AOB on Glu206 (glutamic acid), with the shortest distance of 2.92 Å and the maximum binding energy of −7.6 kcal/mol. In addition, formic acid bound to AMO on Leu110 (leucine) with 2.95 Å, with a maximum binding energy of −4.1 kcal/mol. It also bound to the key enzyme NXR of NOB on Lle281 (isoleucine) at 3.09 Å, −2.3 kcal/mol. It bound to the key enzyme of denitrifying bacteria Nir–Cu at 3.1 Å, −3.7 kcal/mol on his60 (histidine). Therefore, the binding strengths of each enzyme to formic acid were in the order of: HAO > AMO > Nir > NXR.
According to an analysis of the MOE molecular simulation results of formic acid and the four enzymes, formic acid is a small organic compound that can be used as a carbon source for microbial growth. The hydroxyl groups on formic acid belonged to active groups and easily combined with a variety of amino acid residues. Therefore, formic acid easily docked with enzymes to be decomposed, providing energy for cell activities and promoting bacterial growth.
The MOE molecular simulations indicate that in the presence of formic acid, AOB and denitrifiers will gradually grow and become the dominant species. Thus, this calls for further experiments and more detailed analysis of microbial community structure.
The influence of formic acid on nitritation
In the previous study, using a batch experiment and the continuous effect of formic acid on nitritation, we determined the optimal dosage and mode of formic acid for controlling partial nitrification to be 0.3 g/L, and this was administered once every other day dosed in the reactor (Li et al., 2017). To determine the lasting impact of formic acid on partial nitrification and study the influence mechanism, the experiment was conducted in two identical reactors (reactor a and reactor b) under the same conditions. As shown in Fig. 4a, the average ammonia conversion rate, nitrite accumulation rate, and average nitrate yield (accumulated nitrate/consumed ammonia) were 99.79%, 0.50%, and 94.59%, respectively, in reactor a (stage I days 1–20). After formic acid was dosed in reactor a (stage II days 21–110) for 1 week, the reactor operated stably, and then, the ammonia conversion rate was >98% throughout stage II.
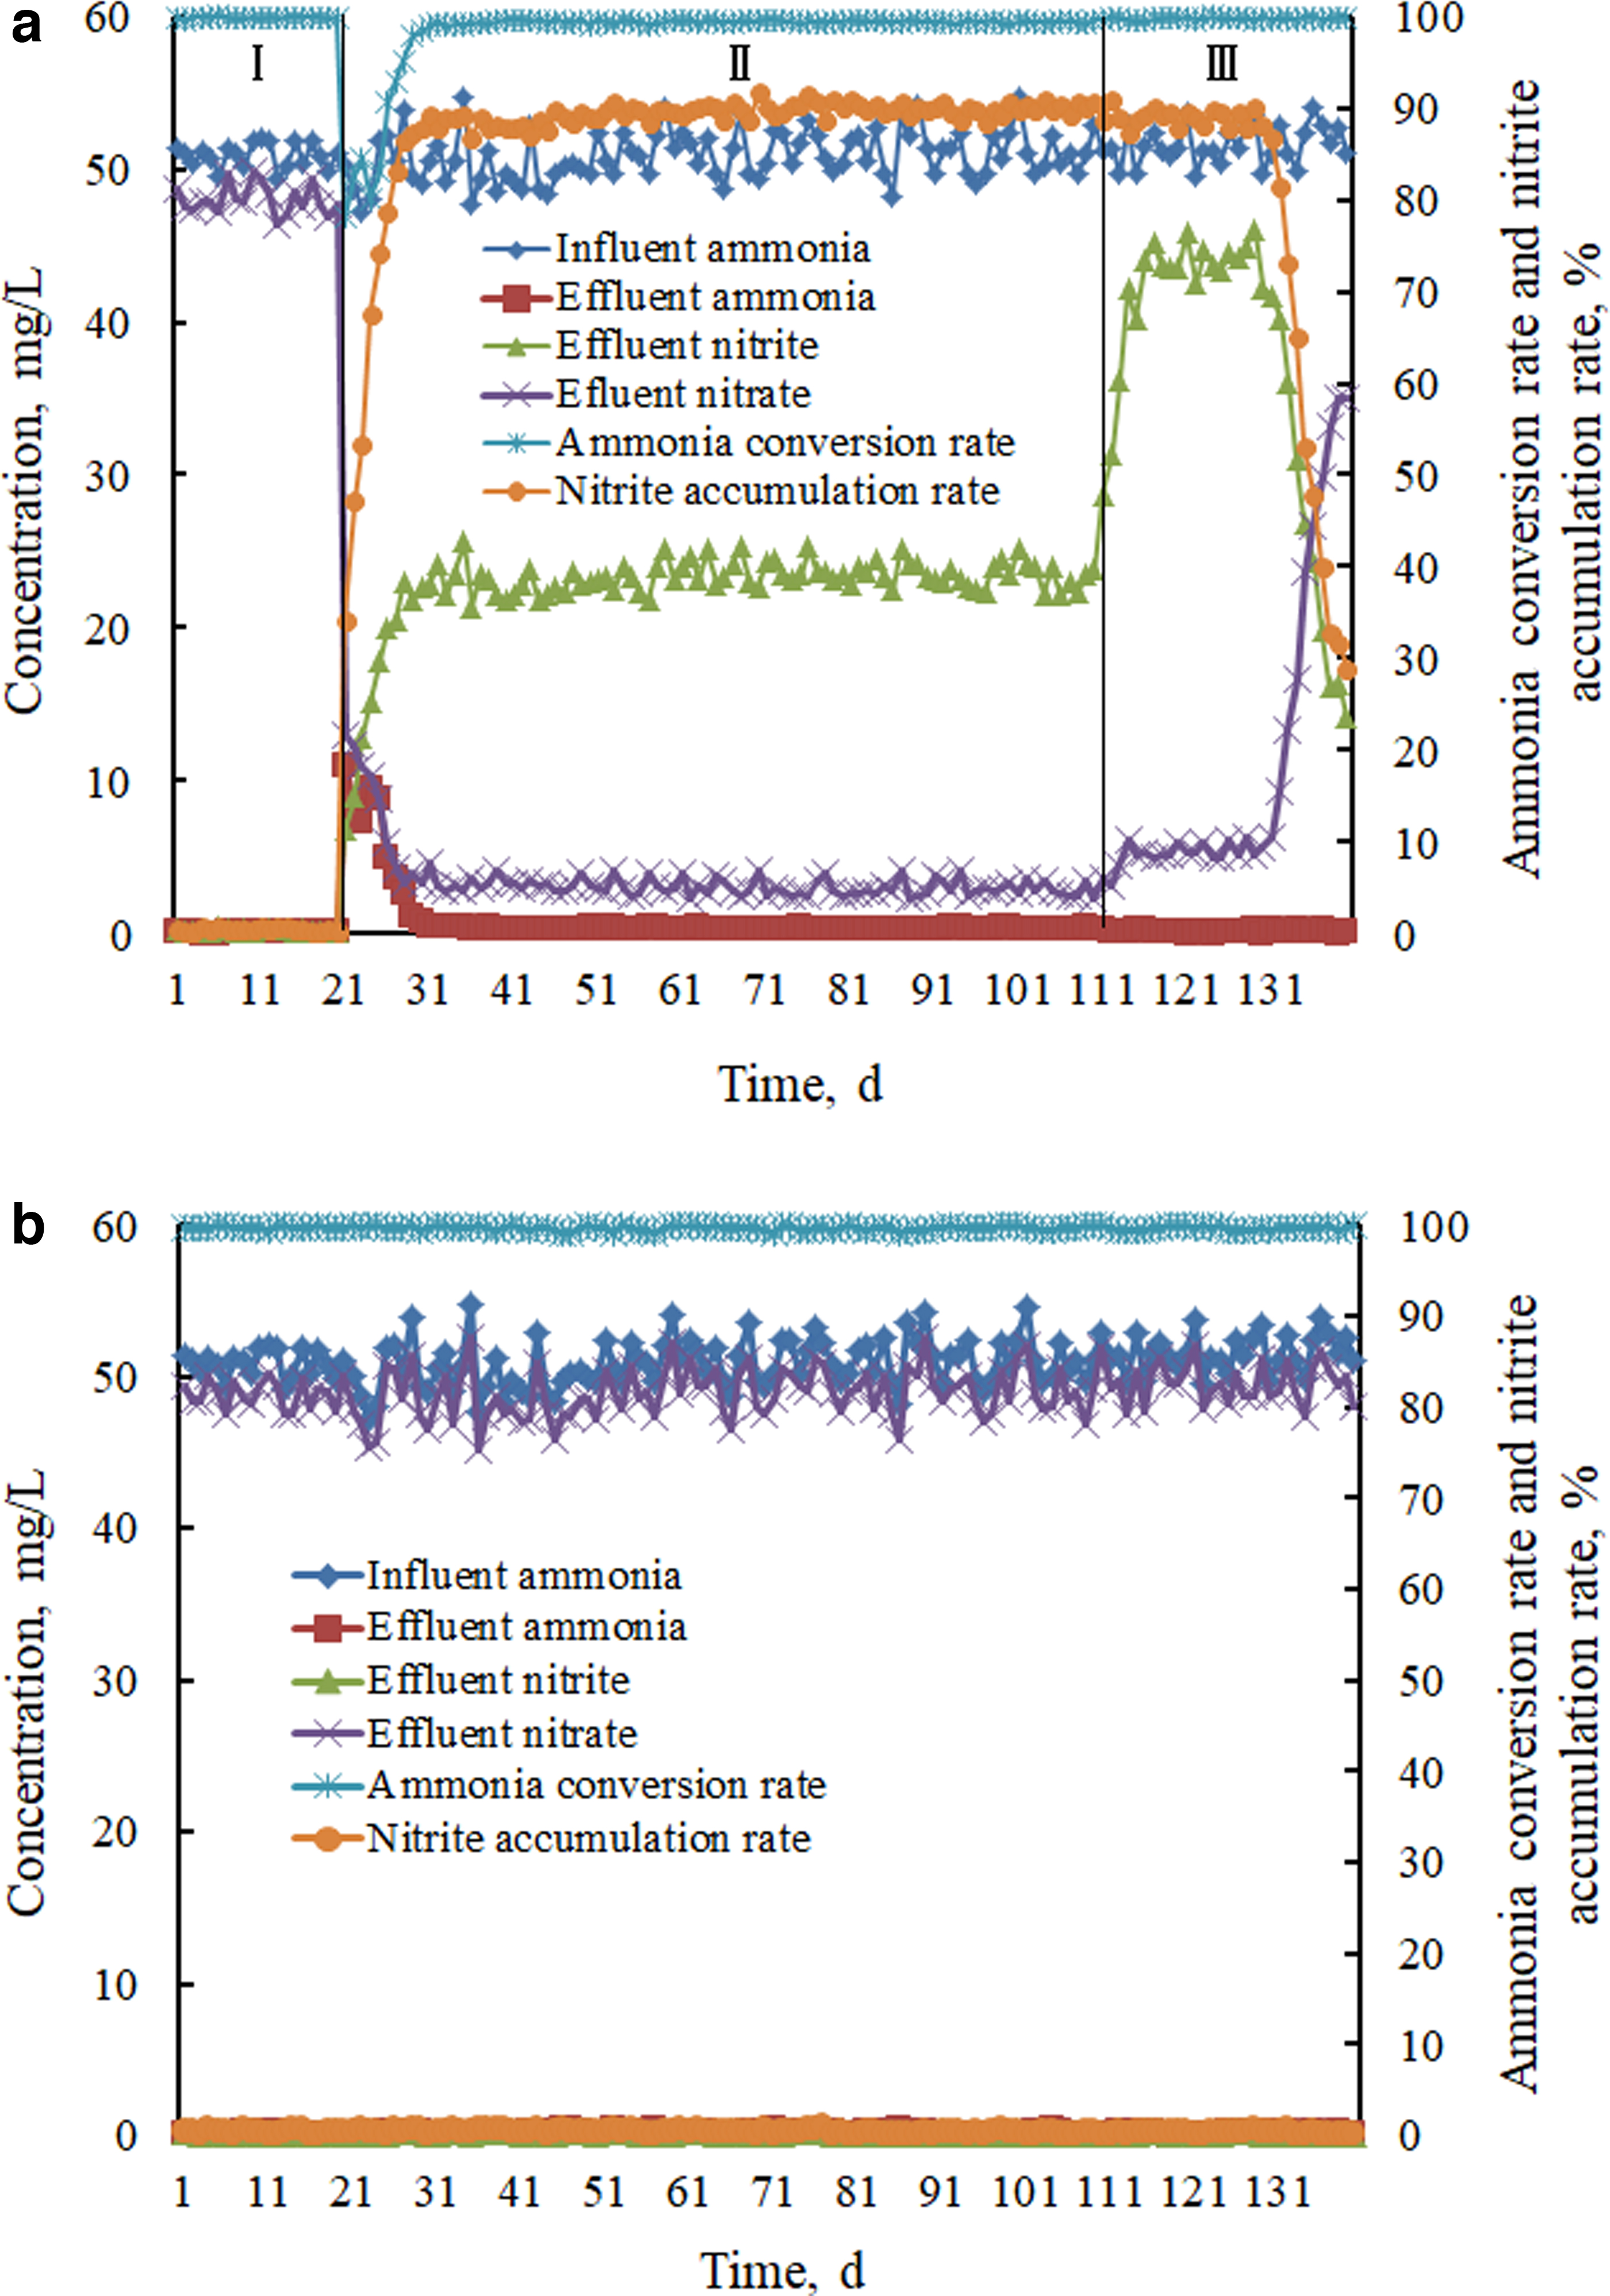
Nitrogen compounds changed with time with and without formic acid.
In addition, the nitrite accumulation rate increased gradually, and the average value was near 90%. Nevertheless, the average nitrite yield (accumulated nitrite/consumed ammonia) was only 46.22%, and the average effluent nitrate was 3.1 mg/L.
In addition, the pH of the effluent was slightly higher than that of the influent, which indicated that denitrification might have been involved during stage II (Wang et al., 2010, 2020a). According to nitrogen conservation, ∼46.93% of nitrogen was removed during stage II in reactor a. When the formic acid dosing was stopped in reactor a (stage III days 111–140), the ammonia conversion rate changed a little, and the average ammonia conversion rate was 99.67%. However, although the average nitrite accumulation rate was 88.89% after stopping the formic acid addition, the average nitrite yield increased to >85%, the average effluent nitrate increased to 5.26 mg/L, and the effluent pH decreased.
After stopping formic acid dosing for ∼20 days, the effluent nitrite concentration decreased gradually, and the effluent nitrate concentration increased. This indicated the shortcut nitrification transform to full nitrification. Compared with reactor a, in reactor b without formic acid, the average effluent nitrite was only 0.19 mg/L, and nearly all of the ammonia was transformed to nitrate. In addition, the nitrate yield was >95% (Fig. 4b). It can be seen from the experimental results that the rapid start-up and stable operation of partial nitrification were realized by formic acid dosing. However, although partial nitrification was maintained for a period of time after stopping the formic acid dosing, it could not be maintained for a long period of time. The above experimental results were consistent with the MOE simulation. Here, the positive effects of formic acid on nitritation by promoting the growth of ammonia oxidizing bacteria and denitrifiers were proven. Next, the microbial community structure will be analyzed in detail.
Microbial diversity of activated sludge
Sludge samples collected, respectively, from the reactor a and reactor b on the 10th (stage I—10), 60th (stage II—60), 100th (stage II—100), and 135th (stage III—135) days were probed using 16S ribosomal RNA (rRNA) high-throughput gene sequencing. Microbial community shift in terms of relative abundances (genus level) was evaluated and is presented in Fig. 5. At the genus level, it was found that the microbial community structure within the sludge samples of reactor a varied from that observed in the sludge samples of reactor b.
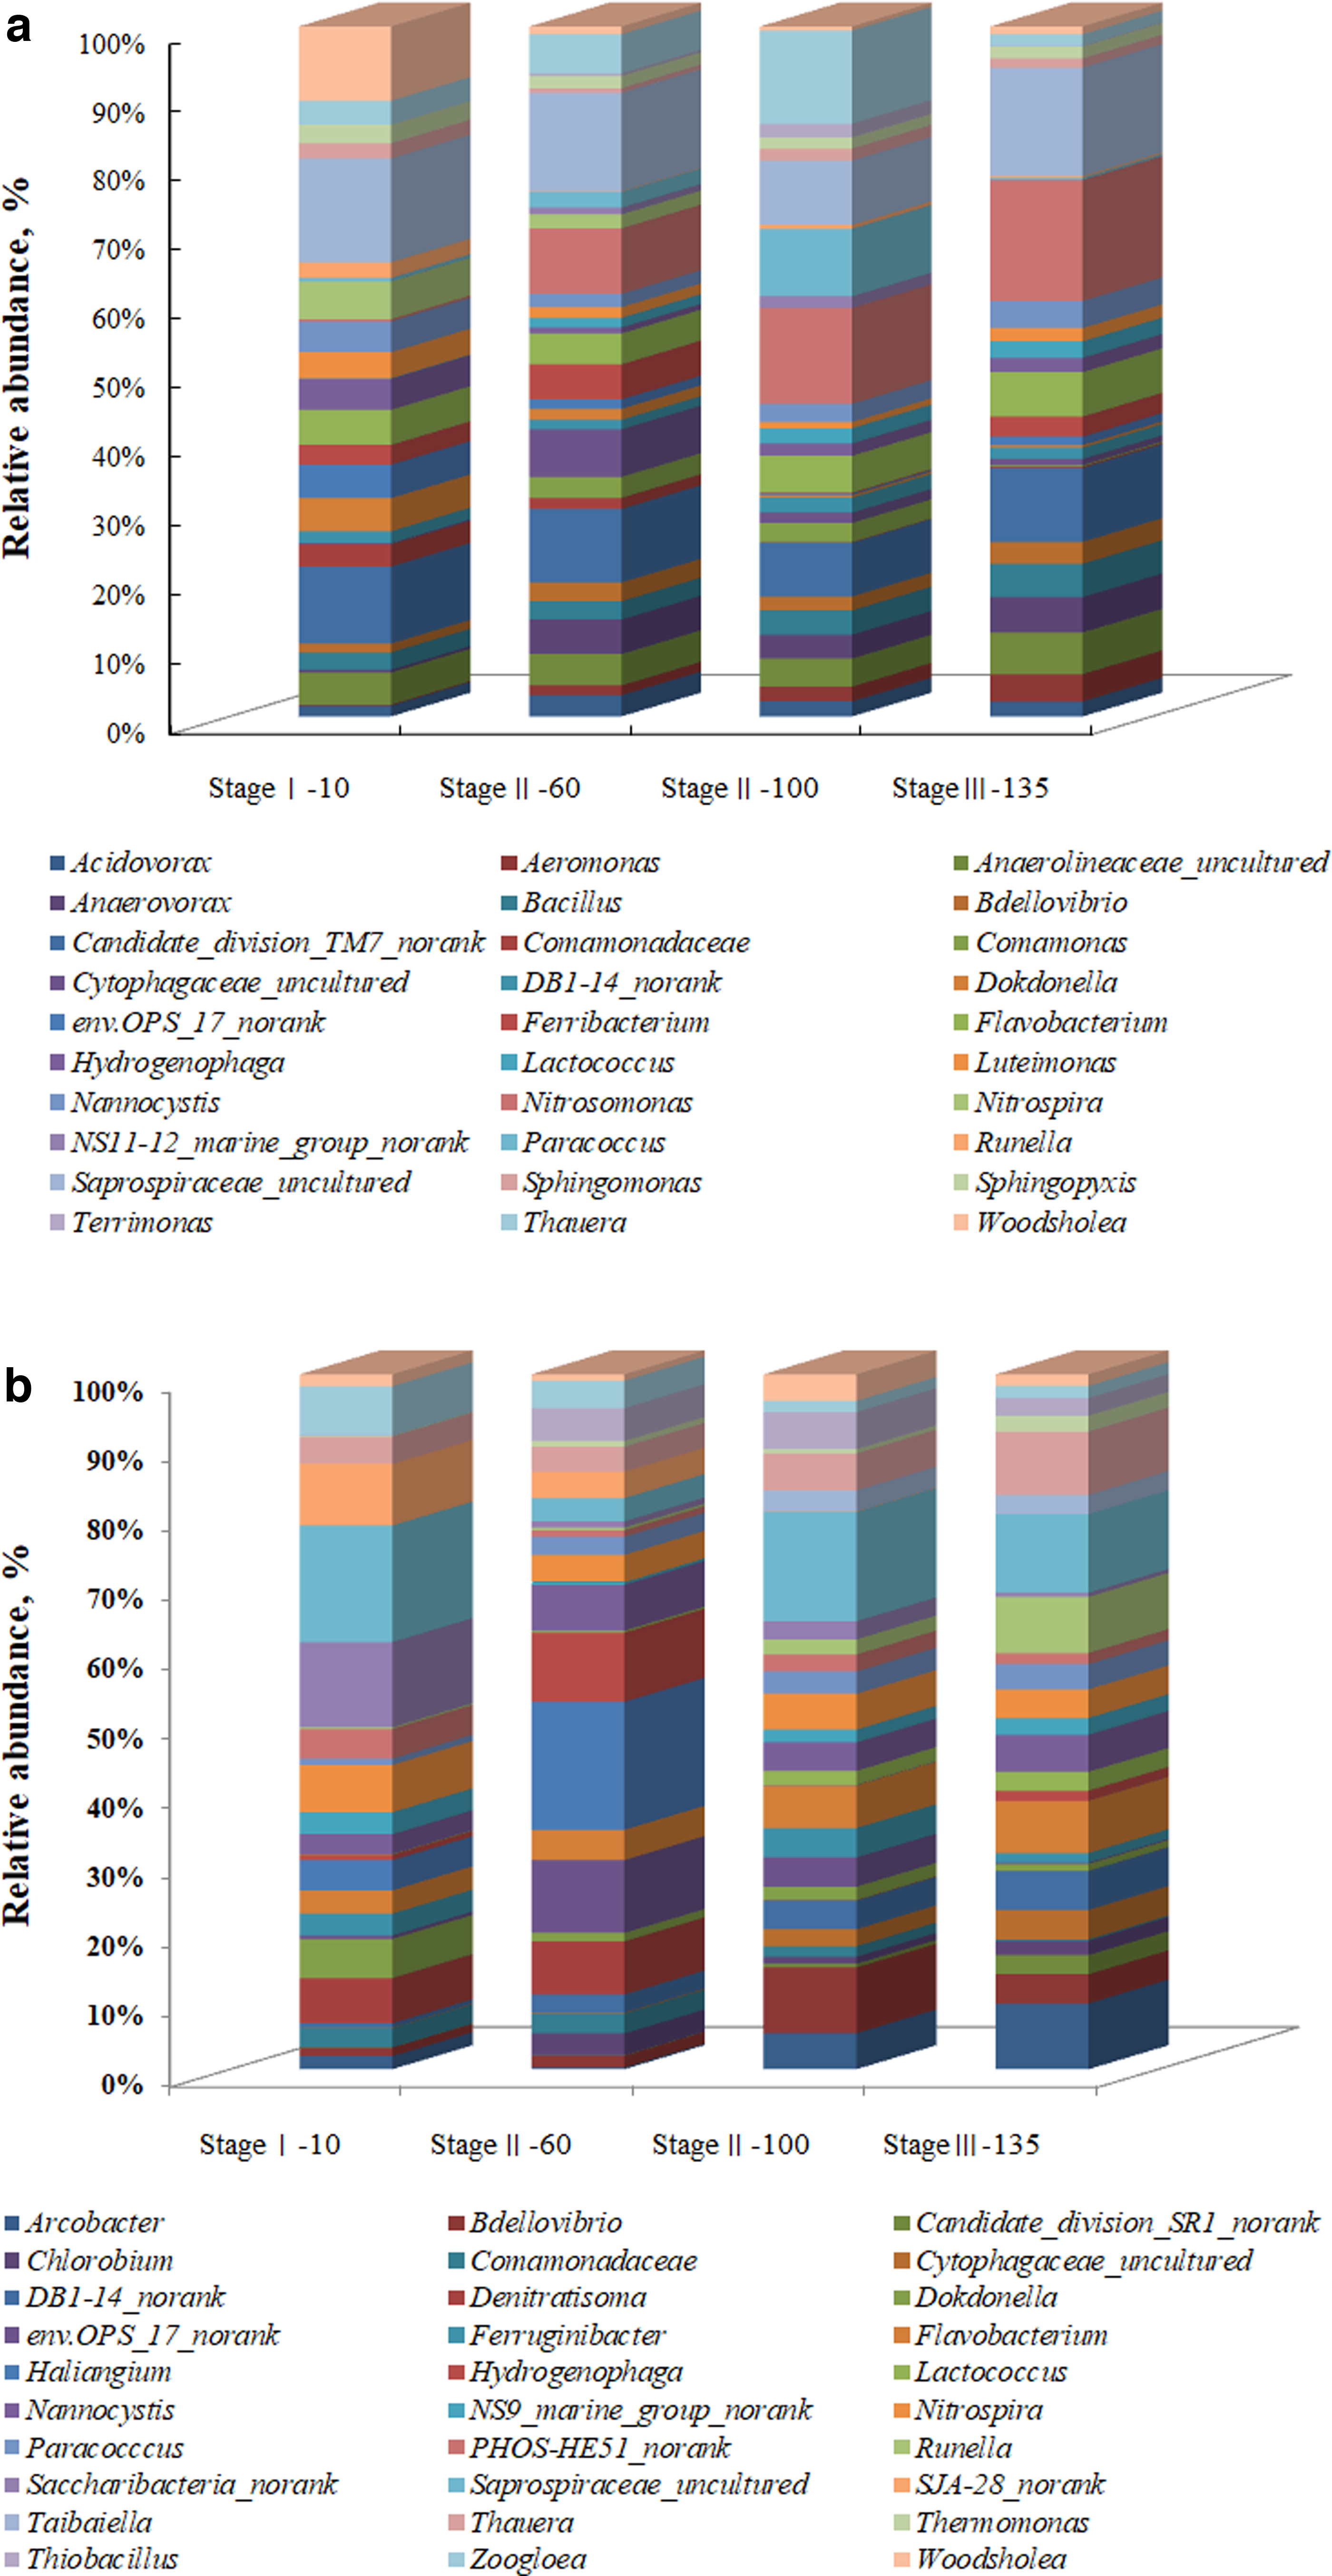
Analysis of the microorganism community structure.
The illustration in Fig. 5a revealed that from the perspective of the primary microbial population and abundance of sludge after formic acid dosing, the bacteria related to nitrogen removal in the system included Acidovorax, Aeromonas, Bacillus, Bdellovibrio, Comamonadaceae, Comamonas, Flavobacterium, Lactococcus, Nannocystis, Nitrosomonas, Nitrospira, Paracoccus, Saprospiraceae_uncultured, Sphingomonas, Sphingopyxis, Terrimonas, and Thauera.
In addition, results from the high-throughput sequencing analysis of sludge samples from reactor b (Fig. 5b) revealed that without formic acid addition the dominant bacteria related to nitrogen removal included Bdellovibrio, Comamonadaceae_unclassified, Denitratisoma, Flavobacterium, Lactococcus, Nannocystis, Nitrospira, Paracoccus, Saprospiraceae_uncultured, Thauera, Thermomonas and Zoogloea (Harker et al., 1998; Calvó et al., 2004; Minana-Galbis, 2004; Young et al., 2008; Kumar et al., 2010; VandeWalle et al., 2012; González et al., 2014; Spanning et al., 2015; Willems and Gillis, 2015; Cheng et al., 2018; Feng et al., 2019).
Nitrosomonas and Sphingomonas were the AOB genera (Antwi et al., 2020) only observed within the sludge samples obtained from reactor a. The abundance of Nitrosomonas in the system increased from 0.152% (stage I—10) to 12.509% (stage II—100). However, when dosing with formic acid stopped, the abundance of Nitrosomonas decreased to 11.609% (stage III–135). Sphingomonas showed a similar variation tendency with Nitrosomonas, with the proportions of 0.389%, 0.991%, 1.544%, and 0.887% in stage I—10, stage II—60, stage II—100, and stage III—135, respectively. Previous studies have confirmed that Nitrosomonas was a functional genus for partial nitrification in the reactors (Liu et al., 2016). The abundance changes of Nitrosomonas and Sphingomonas demonstrated that formic acid dosing was conducive to the enrichment of AOB.
Nitrospira was the primary NOB (Huang et al., 2019; Antwi et al., 2020) both in reactor a and reactor b, but the variation trend of abundance in the two reactors was different. In reactor a (Fig. 5a), Nitrospira decreased from 2.473% (stage I—10) to 0.005% (stage II—100), and it changed little (0.011%) when formic acid dosing was discontinued (stage III—135). In reactor b (Fig. 5b), the abundances of Nitrospira decreased first and then increased during the experiment, and the abundances were 2.712% (stage I—10), 1.190% (stage II—60), 2.567% (stage II—100), and 3.047% (stage III—135), respectively. The abundance variation of Nitrospira in the two reactors indicated that the advantages of NOB were gradually weakened when dosing with formic acid.
It has been previously reported that the Nitrospira-rich and less diverse NOB community was vulnerable under conditions with sulfide and hydroxylamine addition in the activated sludge system (Delgado Vela et al., 2018; Li et al., 2019).
This was similar as shown in Fig. 5 that a small proportion of Nitrospira appeared in reactor a, along with the addition of formic acid continuously.
Among these genera observed in reactor a and reactor b, Acidovorax, Bacillus, Comamonadaceae, Comamonas, Denitratisoma, Flavobacterium, Lactococcus, Paracoccus, Terrimonas, Thauera, Thermomonas, and Zoogloea have been reported for denitrification metabolisms (Liu et al., 2016; Gonzalez-Martinez et al., 2018; Huang et al., 2019; Wang et al., 2020b, 2021; Yang et al., 2020; Chen et al., 2021; Tan et al., 2021). Comamonadaceae, Flavobacterium, Lactococcus, Paracoccus, and Thauera were observed both in reactor a and reactor b. The abundance of Comamonadaceae in both reactors showed a downward trend.
The variation tendency of Flavobacterium, Lactococcus, Paracoccus, and Thauera in reactor a was alike, with the proportions of 2.312%, 0.035%, 0.236%, and 1.583% (stage I—10), 2.524%, 0.794%, 1.277%, and 3.206% (stage II—60), 4.815%, 1.999%, 8.821%, and 12.154% (stage II—100), and 4.272%, 1.588%, 0.197%, and 1.131% (stage III—135), respectively. In reactor b, the abundances of Flavobacterium, Lactococcus, Paracoccus, and Thauera showed an upward trend, with the proportions of 1.332%, 0.033%, 0.362%, and 1.557% (stage I—10), 1.309%, 0.086%, 0.785%, and 1.072% (stage II—60), 3.052%, 1.004%, 1.601%, and 2.642% (stage II—100), and 2.721%, 1.343%, 1.799%, and 4.508% (stage III—135), respectively.
It can be seen that although the abundance of these denitrifying bacteria present in both reactors increases in reactor b, their abundance was lower than that in reactor a when formic acid was dosed.
Acidovorax, Bacillus, Comamonas, and Terrimonas only existed in reactor a, with the proportions of 0.714%, 1.148%, 0.005%, and 0.00% (stage I—10), 1.735%, 1.492%, 1.715%, and 0.201% (stage II—60), 1.967%, 3.17%, 2.493%, and 1.797% (stage II—100), and 1.438%, 3.201%, 0.136%, and 0.045% (stage III—135). Denitratisoma, Thermomonas, and Zoogloea were only observed in reactor b, with the proportions of 2.585%, 0.046%, and 2.827% (stage I—10), 2.305%, 0.252%, and 1.192% (stage II—60), 0.0316%, 0.311%, and 0.809% (stage II—100), and 0.008%, 1.139%, and 0.872% (stage III—135), respectively. The abundance of these denitrifiers indicates that dosing with formic acid was conducive to the enrichment of denitrifiers.
Through the analysis of microbial community structure, it can be seen that the results from sequencing analysis are consistent with experimental aspects and molecular simulations. All three indicated that dosing formic acid was beneficial to the enrichment of ammonia oxidizing bacteria and denitrifiers.
The mechanism of formic acid on partial nitrification
The oxygen uptake rate (OUR) was calculated according to the following equation:
where OUR is the oxygen utilization per unit of mass sludge in unit time; DO is the dissolved oxygen concentration; t is the measurement time; and X is the concentration of biosolids in the measuring device.
The OUR tested at time t when the substrate and the DO are unrestricted [OUR (t)] can be expressed as follows (Wu et al., 2016):
where OUR0 is the initial OUR. Assuming that the decay rate b is 5% of μ, μ can be estimated through curve fitting the tested OUR.
The OUR was measured to calculate the maximum specific growth rate for AOB and NOB (μAOB and μNOB, day−1). The OUR measured at time t under ammonium and DO nonlimiting condition [OURNH(t)] can be expressed by Equation (4). OURNH(t) is expressed by the exponential function of OUR0NH (the initial OUR after ammonium addition). By curve fitting the measured OUR to the simulated OUR and assuming the decay rate bAOB to be 5% of μAOB, μAOB can be estimated. Similarly, the μNOB can be estimated.
Activated sludge was collected from the reactor of a 0.3 g/L formic acid system, and the OUR was calculated using Equation (3). The OUR was tested in an unrestricted substrate and a high ratio of food-to-mass (F/M) circumstances, and this result was used to examine the maximum specific increment rates of AOB (μAOB) and NOB (μNOB), shown in Fig. 6.

OUR changed with time;
Figure 6a shows the OUR used to measure μAOB under unrestricted DO and NH4+ circumstances and is expressed as OURNH. Figure 6b shows the OUR used to measure μNOB under unrestricted DO and NO2− circumstances and is expressed as OURNO2. After curve fitting the OUR data to Equation (4), the μAOB and μNOB values were estimated to be 0.91 and 0.56 day−1, respectively.
The activated sludge model (ASM) type of model was included to simulate the reactor (Henze et al., 2000). The model had four particulate components, including AOB (XAOB), NOB (XNOB), heterotrophic bacteria (XH), and inert material (XI); and five soluble components including DO (SO), NH4+ (SNH), NO2− (SNO2), NO3− (SNO3), and soluble COD (Ss). The complete model stoichiometric matrix and kinetic rate expressions are shown in Table 1. The maximum specific growth rates for AOB and NOB have been determined. The formic acid inhibition constant for NOB (KHCOOH) was determined from model calibration. Other parameter values were taken from the literature, and are shown in Table 2.
Kinetic Model of Nitrification

NH is the oxidation process of NH4+ to NO2− under AOB; NO2 is the oxidation of NO2− to NO3− under the action of NOB.
AOB, ammonia oxidizing bacteria; NOB, nitrite oxidizing bacteria.
Source
Kinetic Parameters for the Model Simulation
COD, chemical oxygen demand.
The rates of the AOB or NOB rise were expressed using the “Monod” model as follows:
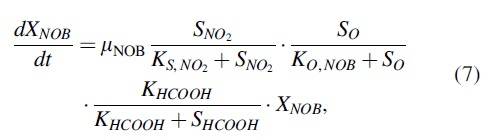
Equation (6) does not include the formic acid inhibition of NOB, and Equation (7) is the model of formic acid inhibition of NOB. The formic inhibition constant for NOB (KHCOOH) was 1.36 mg/L, which was determined from the model calibration. XAOB and XNOB were estimated using the method shown by Bergmann et al. (2011).
To quantify the effects of formic acid on NOB washout, the models of Equations (5)–(7) were fitted under the different SRT and DO concentrations, as shown in Fig. 7. The three curves divided the graph into four areas: A, B, C, and D. A is the NOB proliferation area; B is the NOB washout area with formic acid inhibition and the partial nitrification area with formic acid inhibition; C and D are the NOB washout regions without formic acid inhibition; C is also the partial nitrification region without formic acid inhibition; and D is also the AOB-deficient area. A, B, and C are all AOB abundance areas.
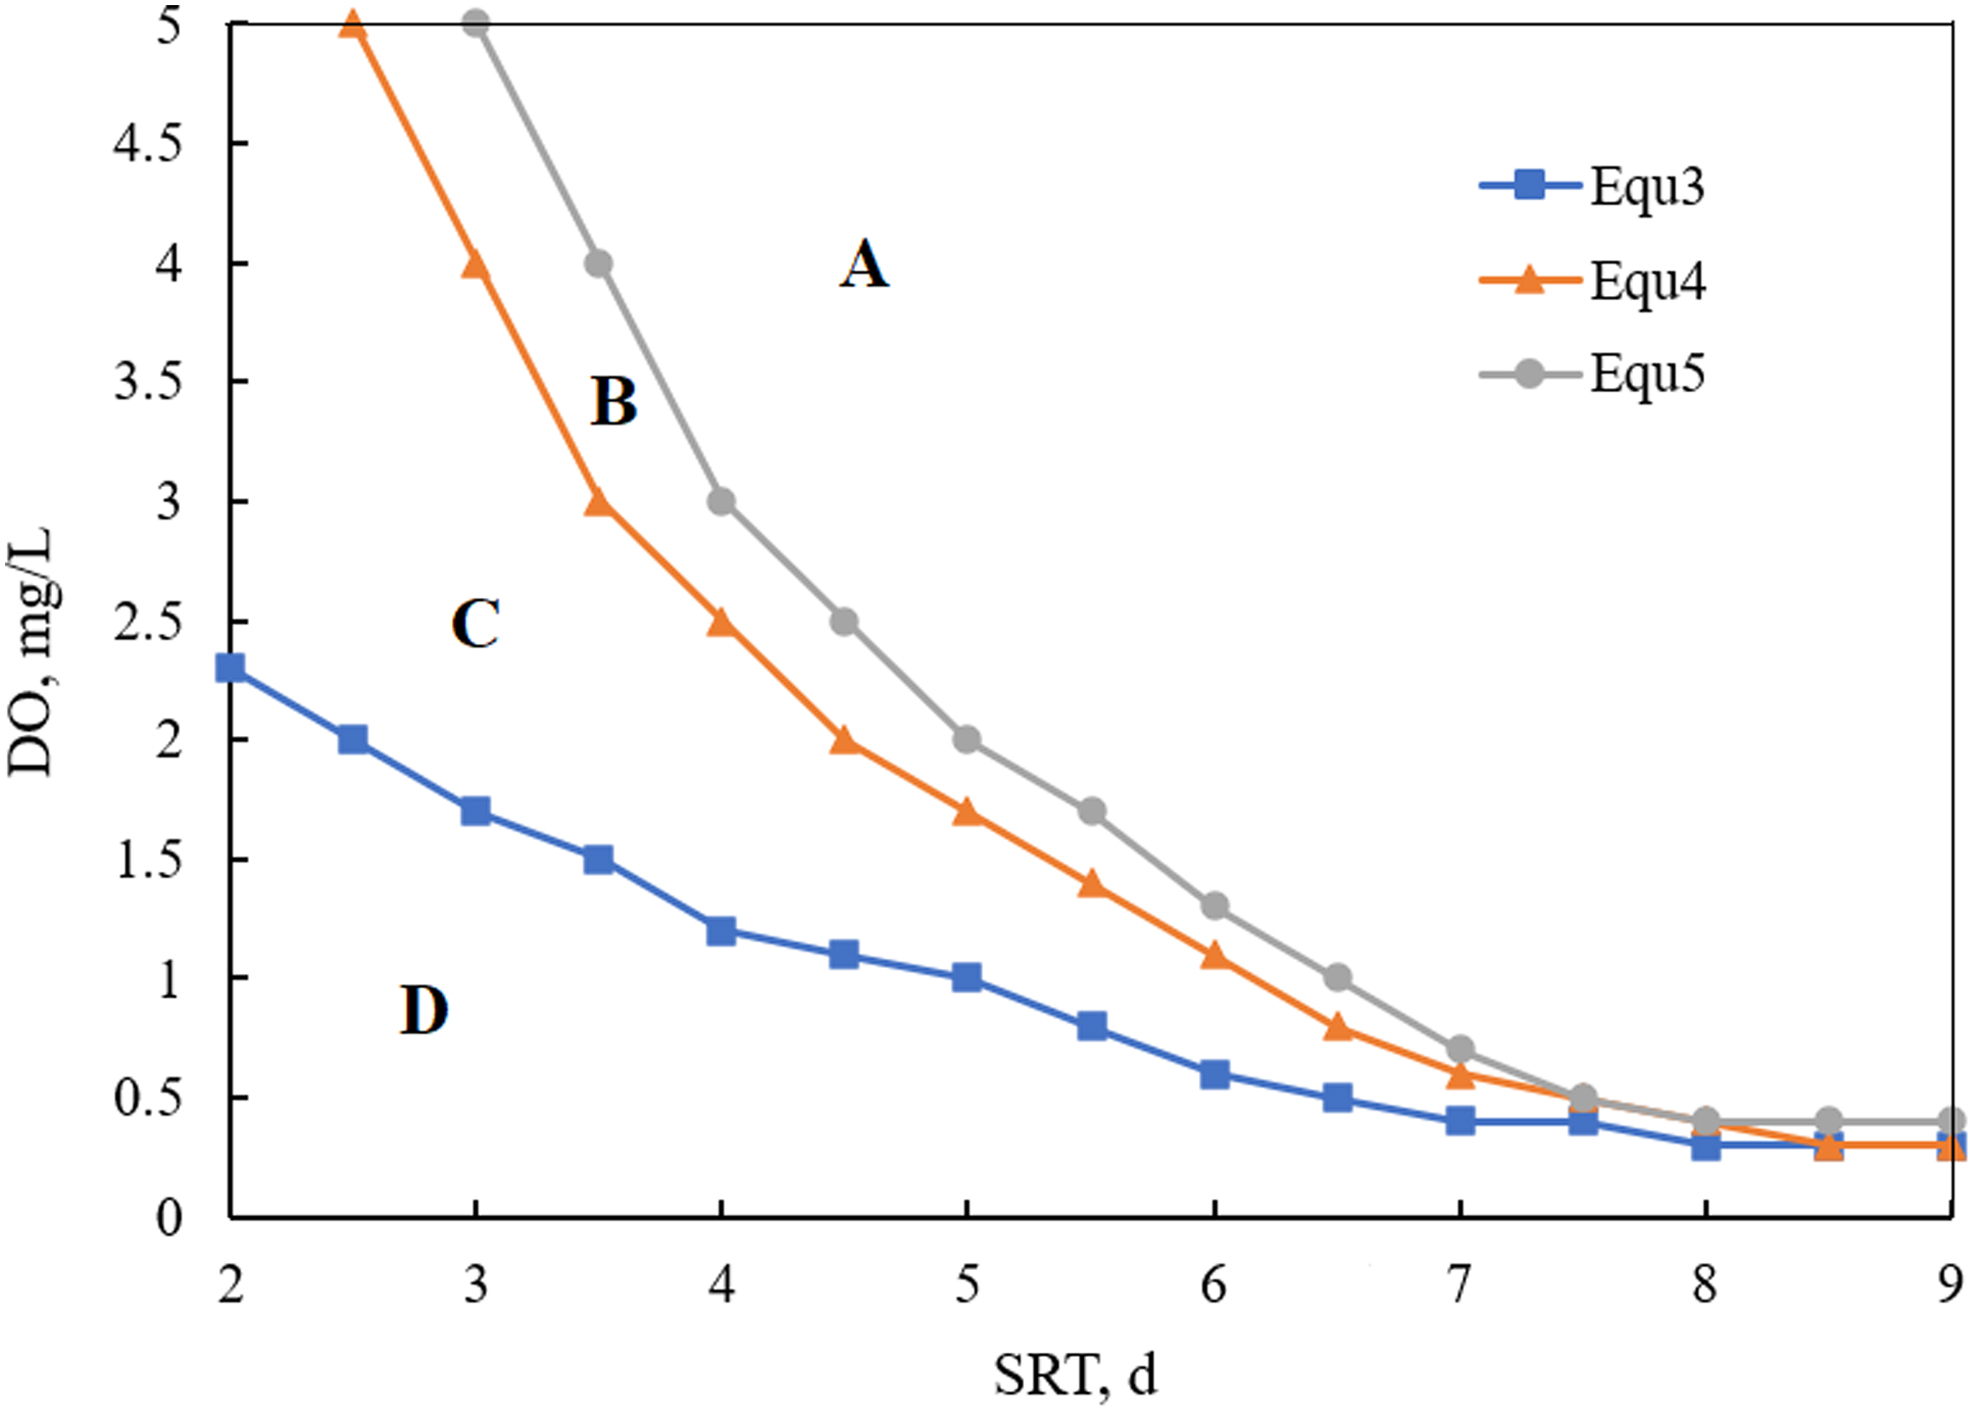
Fitting curves of the different SRT and DO concentrations. SRT, sludge retention time.
As shown in Fig. 7, a low DO and SRT generally led to NOB washout. The area of B is much smaller than that of C, indicating that the partial nitrification area only slightly increased due to the formic acid. Hence, compared with no formic acid inhibition, the area of NOB washout due to formic acid inhibition is very small. This indicates that the inhibition of NOB by formic acid in the system was very small. The area of the partial nitrification C (also the AOB abundance area without formic acid inhibition) is larger than that of B, indicating that the addition of formic acid promoted AOB activity more than it inhibited NOB.
This coincided with the results of high-throughput sequencing analysis and the MOE simulation analysis results of formic acid on the key enzymes of AOB and NOB.
Conclusions
In this study, partial nitrification was successfully achieved and maintained using formic acid dosing in an SBR. The effluent of the SBR without formic acid was primarily nitrate, and the average ammonia conversion rate and nitrate yield were 99.79% and 94.59%, respectively. After formic acid dosing for approximately 1 week, the shortcut nitrification ran stably, and the average ammonia conversion rate and nitrite accumulation rate were 99.25% and 89.41%, respectively, while the yield of nitrite nitrogen was only 46.22%, and ∼46.93% of the nitrogen was removed. In addition, the pH of the effluent was slightly higher than that of the influent. This indicated that denitrification might have been involved during the stage when formic acid dosing was applied. Partial nitrification ran stably for ∼20 days after stopping the addition of formic acid.
In addition, the average ammonia conversion rate and nitrite accumulation rate were 99.69% and 89.02%, respectively, while the average nitrite yield increased to 85.89%. The results of the MOE simulation showed that in the presence of formic acid, AOB and denitrifying bacteria gradually grew and became the dominant species. The high-throughput analysis of the activated sludge samples showed the presence of the AOB Nitrosomonas and Sphingomonas, and that the denitrifiers Acidovorax, Bacillus, Comamonas, Flavobacterium, Lactococcus, Paracoccus, Terrimonas, and Thauera enriched when formic acid was added. This indicated the enrichment of AOB and denitrifiers in the formic acid system.
The above experimental results demonstrated that the long-term effect of formic acid on partial nitrification was consistent with the results of the MOE molecular simulation analysis and the high-throughput sequencing analysis.
Therefore, formic acid was considered to be responsible for the partial nitrification process in this study. By measuring OUR, the activities of AOB and NOB were analyzed, and the results indicated that the addition of formic acid promoted AOB activity more than it inhibited NOB.
Footnotes
Acknowledgment

Authors’ Contributions
All authors contributed to the study conception and design. Material preparation, and data collection and analysis were performed by N.L., S.Y., H.W., L.L., and G.L. The first draft of the article was written by N.L., and all the authors commented on the previous versions of the article. All authors read and approved the final article.
Author Disclosure Statement
The authors declare that they have no competing interests.
Funding Information
This work was supported by the major science and technology projects of Liaoning Province (grant No. 2019JH1/10300001); Shenyang Youth Science and Technology Project (grant No. RC190366); Project of Science and Technology Department of Liaoning Province (grant No. 2019–ZD–0483); Liaoning Provincial Department of Education Project (grant No. LJC201907); Cooperative education program of industry and university (grant No. 202101255043); and Innovation and Entrepreneurship Training Program for College Students (grant No. S202110166031) and Innovation and Entrepreneurship Training Program for College Students (grant numbers 202206012).