
Abstract
Free chlorine and thermal treatment are used in water disinfection, sludge treatment, and food sterilization processes to inactivate pathogens. Previous research has shown that RNA viruses and bacteriophages can evolve to develop increased resistance to chlorination and thermal disinfection. However, DNA bacteriophages are also commonly used as indicators and surrogates for enteric viruses, but knowledge about their adaptation to disinfection processes is more limited. We repeatedly subjected T7 coliphage to small doses of free chlorine or to heat treatment at 60°C for a long enough time to cause an inactivation of 90–99.9%, then cultivated the surviving phage and assessed the resistance to these treatments to understand if increased resistance emerged. After 10 repeated exposures to free chlorine, T7 coliphage did not develop increased resistance compared with the unexposed strain. However, T7 did develop an increased resistance to thermal treatment at 60°C after four consecutive exposures. The heat-adapted population of T7 had a significantly lower decay rate than the original strain, but its breakpoint temperature (a measure of its thermal stability) did not change. Results from this study provide important implications for scientific and practitioner communities, specifically that not all bacteriophages are equal indicators, proxies, or surrogates for human pathogens in all treatment processes, and caution is warranted when choosing an appropriate indicator. Further research is needed to better understand the influence of virus genome type, mutation rate, and capsid reactivity on virus evolvability to chlorine and heat treatment processes.
Introduction
Globally, viruses cause disease outbreaks associated with recreational water (Sinclair et al, 2009), drinking water (Hrudey and Hrudey, 2019; Werber et al, 2009), and irrigation water (Rodriguez-Lazaro et al, 2012). For example, noroviruses cause many recreational waterborne disease outbreaks (Sinclair et al, 2009), and adenoviruses are a top cause of swimming pool disease outbreaks (Bonadonna and La Rosa, 2019). Waterborne virus disease burdens are greater in settings where safely managed sanitation systems are lacking—in Bangladesh, the probability of norovirus or rotavirus infections from exposure to contaminated rivers was 7–17% (Islam and Islam, 2020), greater than the infection risk from Escherichia coli O157:H7. In Uganda, adenovirus and rotavirus caused higher risks of infection than E. coli and Salmonella, based on exposure to surface water, graywater, household storage containers, unprotected water sources, contaminated soils, and tap water (Katukiza et al, 2014).
The global health burden from foodborne viruses is similar to that of HIV/AIDS, malaria, and tuberculosis; and norovirus has caused a greater foodborne disease burden than Campylobacter, E. coli, Salmonella, Shigella, Giardia, Entamoeba, and Ascaris (Devleesschauwer et al, 2018).
Various approaches are used to disinfect water, wastewater, sludge, and food, including physical agents (e.g., ultraviolet radiation, heat treatment, sunlight exposure) and chemical agents (e.g., chlorine, ozone, lime). Chlorine is generally effective at reducing pathogens, but viruses have still been detected in chlorinated effluents (Simhon et al, 2019). The evolution and adaptation of viruses have relevance for the efficacy of water treatment and disinfection processes (Kadoya et al, 2021), as well as the epidemiology of foodborne disease transmission (Domingo and Vennema, 2008).
Chlorine compounds used to treat water such as free chlorine, chloramines, and chlorine dioxide cause loss of virus viability by reacting with structural proteins, genetic material, or both (Wigginton and Kohn, 2012; Wigginton et al, 2012). Chlorine compounds react differently with different amino acids to induce protein damage—for example, hypochlorite preferentially reacts with cysteine, methionine, histidine, serine, and leucine (Hawkins et al, 2003); chlorine dioxide reacts preferentially with cysteine, tyrosine, tryptophan, histidine, and proline (Sharma and Sohn, 2012).
Different chlorine compounds affect viruses in different ways. Chlorine dioxide does not damage genomes as much as free chlorine, instead selectively damaging susceptible regions of the capsid, affecting host cell binding to cause loss of viability (Wigginton and Kohn, 2012). Presumably, this preferential damage to capsids could enable mutations that confer selective advantages for resistance to chlorine dioxide. Zhong et al (2017b, 2016) found that MS2 coliphage and echovirus evolved to develop an increased resistance to chlorine dioxide, likely from mutations that enhanced their ability to bind to host cells, with chlorine-labile amino acids substituted with more chlorine-stable amino acids (Zhong et al, 2017b; Zhong et al, 2016).
Free chlorine damages both the capsid and genome, resulting in a loss of binding and replication ability (Sigstam et al, 2013; Wigginton et al, 2012). Presumably, viruses exposed to free chlorine should be less capable of developing mutations that confer increased resistance, since chlorine-induced genome damage would preclude the preservation of beneficial mutations. Nevertheless, Rachmadi et al (2018) found that murine norovirus developed greater resistance to free chlorine after multiple exposures.
Thermal treatment is used in food safety (e.g., boiling, pasteurization) and sludge stabilization (e.g., Peguero et al, 2021). A systematic literature review revealed that time–temperature inactivation curves were controlled by viruses with high resistance to heat (Espinosa et al, 2020). Viruses can also adapt greater resistance to heat after repeated exposures. Adeyemi et al (2017) demonstrated that a heat-resistant strain of poliovirus emerged after 10 consecutive exposures to 51°C. Meister (2019) adapted coxsackievirus to 50°C and 55°C, finding the emergence of more thermally stable strains at both temperatures, which are below the virus's breakpoint temperature (the temperature above which capsid proteins denature). Virus capsids with disulfide bonds are stable at higher temperatures, but breakpoint temperatures of viruses without disulfide bonds are usually around 50–60°C (Caldeira and Peabody, 2007).
As such, different virus species have different levels of resistance to chlorine and heat treatment. However, such variations have also been reported between isolates from the same species, implying the potential of environmental adaptation (Meister et al, 2018; Rachmadi et al, 2018). One limitation of previous virus adaptation studies is that most have used viruses with positive-sense, single-stranded RNA genomes. RNA viruses mutate faster than DNA viruses, leading to high genetic diversity, rapid evolution, and adaptation to environmental stressors (Holland et al, 1982; Sanjuán et al, 2010).
While RNA viruses have higher mutation rates than DNA viruses (Domingo et al, 1996), it is still important to understand the potential for adaptation by viruses with DNA genomes, since some DNA viruses are used as indicators. For example, somatic coliphages, which infect E. coli through the cell membrane, are numerous in wastewater (Mesquita and Emelko, 2012), and are used as viral fecal indicators (Jofre et al, 2016; McMinn et al, 2017; US EPA, 2015; Verbyla et al, 2021), surrogates for treatment processes (Momba et al, 2019; Verbyla and Mihelcic, 2015), and proxies for pathogen fate and transport (Jebri et al, 2017; Lucena and Jofre, 2010). However, if DNA phages and RNA viruses respond and adapt differently to treatment processes, then the former may not be an appropriate indicator for the latter.
Bacteriophage T7 is a well-studied member of the somatic coliphage group. It is structurally different from most human enteric viruses. For example, T7 has an icosahedral head with a short noncontractile tail that is used to inject its genome into the host without disrupting the cellular membrane (Hu et al, 2013). In contrast, most waterborne enteric viruses lack tails, and instead enter their host cells through endocytic mechanisms. Previous T7 adaptation studies have had mixed results. Richie and Malcolm (1970) successfully adapted T7 to survive longer at a temperature of 60°C, and Cole et al (2021) adapted T7 to survive for up to an hour at a temperature of more than 70°C, but Heineman and Brown (2012) failed to see an adaptive response by T7 for thermal tolerance at 63°C. These mixed results are likely due to differences in methodology.
Heineman and Brown (2012) used a higher starting temperature, cultivating the surviving 0.01% for only three consecutive generations, while others only reduced infectivity by 2 to 3-log10 units and used lower temperatures (initially), which may have helped optimize the multiplicity of infection during regrowth and avoid population bottlenecks (Carratalà et al, 2020; Cole et al, 2021; Richie and Malcolm, 1970).
The overall goal of this study was to test the ability for T7 bacteriophage to develop an increased resistance to chlorination and thermal treatment in a controlled laboratory setting. To avoid the potential shortcomings of Heineman and Brown (2012), we characterized T7's breakpoint temperature before experimental evolution, used an adaptation temperature below the breakpoint, and aimed to reduce infectivity by 90–99.9% during each exposure. Findings from this research can help inform decisions about the strengths and limitations of T7 as a virus indicator.
Methods
Experimental evolution (Carratalà et al, 2020; Carratalà et al, 2017; Kawecki et al, 2012; Meister et al, 2020; Tom et al, 2018; Zhong et al, 2017a; Zhong et al, 2017b) was used in this study (Fig. 1a, b). A laboratory strain of T7 was repeatedly exposed to sodium hypochlorite or a temperature of 60°C, with sufficient contact time to reduce the population by 90–99.9%. Surviving phages were cultivated, and then the process was repeated. Time and temperature shift experiments helped characterize virus decay rates and breakpoint temperatures, respectively, before and after thermal adaptation (Fig. 1c, d).

Summary of the various experimental approaches used in this study, including:
Propagation of T7 bacteriophage and bacterial host
E. coli strain B and T7 bacteriophage were provided by Dr. Anca Segall (SDSU). E. coli was cultured using 2.5% Luria-Bertani (LB) broth and 1.5% agar. A single isolated colony of E. coli was gathered from streak plates, then inoculated into 3.5 mL of broth, and incubated at 37°C overnight with shaking. This overnight culture was used in plaque assays and to propagate T7. For propagation, 3.5 mL of overnight E. coli with 10 mM MgSO4 and 1 mM CaCl2 was incubated with shaking at 37°C for 2–3 h to reach logarithmic growth. To maintain population diversity during experimental evolution, at least 20 phage plaques were inoculated into log-phase E. coli culture. After overnight incubation with shaking, chloroform (10%) was added, then bacterial debris was removed by centrifugation (3,184 g, 10 min) and phage stocks were stored at 4°C.
Phage enumeration
The double agar layer (DAL) method (9224B; APHA, 2017) was used to enumerate T7. Briefly, Petri dishes were prepared with 1.5% bottom LB agar, and 2.5% top LB agar was transferred into overlay tubes. Then, 200 μL of log-phase E. coli and 200 μL of phage, diluted from 10−1 to 10−6 in 0.02-μm filtered SM buffer (0.58% NaCl, 0.2% MgSO4-7H2O, 0.014% CaCl2-2H2O, 5% 1 M Tris Cl, pH 7.5), were added to overlay tubes, which were poured onto bottom agar dishes. Once solidified, plates were incubated overnight at 37°C, and then, average plaque forming unit (PFU) counts were made from duplicate or triplicate plates with 20–200 PFUs each. Exposed phage concentrations were compared with unexposed process controls to calculate log10 reductions due to treatment. For quality control, negative process controls (bacterial host with no phage), sterility controls (no host, no phage), and positive controls (spot plate) were analyzed regularly.
Experimental evolution with free chlorine
T7 was repeatedly exposed to low doses of free chlorine by adding sodium hypochlorite to chlorine demand free buffer and spiking this solution into a liquid culture of T7 for a fixed amount of time. After each exposure, the number of surviving phages was quantified in duplicate and compared with a control (T7 with no chlorine). Then, at least 20 plaques of the surviving phage were harvested and cultivated in LB broth (as described in the subsection entitled ‘Propagation of T7 bacteriophage and bacterial host’), then the cultivated phages were exposed to chlorine, and the process was repeated for 10 generations, based on approaches used in prior studies (Rachmadi et al, 2018; Zhong et al, 2017b; Zhong et al, 2016). The original T7 strain is referred to as GEN-0, and the T7 populations from each exposure cycle are referred to as “free chlorine-exposed generations” (e.g., FC-GEN-1, FC-GEN-2).
Chlorine stock was prepared fresh weekly with 13% sodium hypochlorite (ACROS Organics) and DI water, and then stored at 4°C until use. Free residual chlorine concentrations of 0.8–1.0 mg/L in the stock were verified using DPD colorimetry within 24 h of experiments. T7 was diluted 1:1,000 in phosphate-buffered water (PBW, pH 7) to reduce its chlorine demand, and then, the chlorine stock was added to process blanks and diluted phage aliquots for an initial target concentration of 0.3–0.5 mg/L. All chlorine contact experiments were carried out at ∼25°C. Chlorine concentrations and pH were simultaneously monitored in sterile LB diluted 1:1,000 in PBW. After 2.0–3.5 min of contact time, chlorine was neutralized with 150 μL of 1 M sodium thiosulfate. Surviving phages were enumerated in chlorinated samples and controls using the DAL method, and the log10 difference between concentrations was calculated.
Time shift experiment
T7 decay rates at 60°C were assessed using a time shift experiment, conducted by distributing 30 μL aliquots of T7 stock into PCR tubes, which were placed in a thermocycler set to 60°C. Sacrificial samples were collected periodically, placed immediately on ice, and then enumerated using the DAL method. A control sample, consisting of 30 μL of phage stock, was kept at 4°C for the duration of the time shift experiment, and then analyzed using the DAL method alongside temperature-exposed samples. The log10 reduction was calculated as the log10 difference between T7 concentrations in the control and temperature-exposed samples. Experiments were performed in duplicate or triplicate and data points were pooled to develop decay curves for different experimental groups.
Temperature shift experiment
To assess the breakpoint temperature, a temperature shift experiment was performed. Aliquots of T7 (30 μL) were placed in a thermocycler, programmed to start at 50°C with the temperature increasing by 3°C every 15 s. Sacrificial samples were initially collected at temperatures of 50°C, 53°C, 56°C, 59°C, 62°C, 65°C, 68°C, and 70°C, and then immediately chilled on ice. Later, the experiment was repeated, starting at 64°C, increasing by 1°C every 15 s, and collecting sacrificial samples at 65°C, 66°C, 67°C, and 68°C. A 30 μL aliquot was stored at 4°C throughout both experiments as a control, and concentrations in these controls were compared with temperature-exposed samples to determine log10 differences. Samples were diluted serially in filtered SM buffer as necessary before quantification.
Experimental evolution with heat treatment
After quantifying the breakpoint temperature of GEN-0, a time shift experiment was performed at 60°C. After each exposure, surviving phages were quantified and compared with a control (T7 at 4°C), with the goal of achieving 90–99.9% reduction. Surviving phages were recultivated by harvesting at least 20 plaques from each plate and propagating as described in the subsection entitled ‘Propagation of T7 bacteriophage and bacterial host’. Then, the new generation of T7 was exposed again to 60°C. For the first exposure, survivors were harvested after 120 min at 60°C, which resulted in ∼1-log10 reduction. For the second exposure, survivors were harvested after 280 min at 60°C, which resulted in ∼1.5-log10 reduction. For the remaining generations, survivors were harvested from samples that were exposed to 60°C for 330 min (resulting in 1.4- to 1.8-log10 reduction). Each exposure cycle is referred to as a “heat-exposed generation” (e.g., HE-GEN-1, HE-GEN-2).
Statistical analysis
For experimental evolution with free chlorine, log10 differences in T7 concentrations with and without chlorine exposure were calculated [Eq. (1), where Cex is the concentration of chlorine-exposed T7, and Cun is the concentration of T7 unexposed to chlorine].
Changes in survival after multiple exposures to chlorine (at the concentrations and contact times summarized in Table 1) were assessed using analysis of variance (ANOVA) of log10 differences that were normalized to the chlorine dose by dividing by the contact time and the free chlorine concentration (i.e., the CT value).
Doses of Free Chlorine and Log10 Differences in the T7 Bacteriophage Concentrations Between Exposed and Unexposed Groups for Each Generation
To analyze data from the experimental evolution with heat treatment, log10 differences between T7 concentrations in the control and heat-exposed samples were calculated using Equation (1), where Cex is the concentration after exposure to heat and Cun is the concentration of T7 control held at 4°C. Natural log differences between the concentrations in the control and the heat-exposed samples were calculated as ln(Cex/Cun). For temperature shift experiment data, segmented linear regression of the natural log differences (y value) versus the temperature (x value) was used to determine the breakpoint temperature, defined mathematically as the point at which the slope of the regression curve changes abruptly (Meister, 2019).
For time shift experiment data, first-order decay rates were calculated [Eq. (2), where Cex,t is the phage concentration after t minutes of exposure to 60°C, Cun is the concentration of T7 control, and kht is the decay rate coefficient]. A t-test for regression (Zaiontz, 2022) was used to assess differences between slopes of the decay curves for GEN-0 and HE-GEN-4.
Results and Discussion
Experimental evolution with free chlorine
Exposure times and initial chlorine concentrations ranged from 2.0 to 3.5 min and 0.36–0.86 mg/L, respectfully, except for the first two exposures, where slightly higher concentrations were applied (Table 1). Except for these first two exposures, concentrations of T7 dropped by 0.31-log10 to 1.99-log10 units, with an average reduction of 1.1-log10 units. The ANOVA was not significant (Table 2; residual standard error = 0.0077 on 8 degrees of freedom, R2 = 0.05843, p-value = 0.5011), indicating a lack of T7 adaptation to free chlorine. Thus, the 10 consecutive exposures to free chlorine did not significantly affect the difference between the concentrations of exposed and unexposed T7. This contrasts with Rachmadi et al (2018), who found that murine norovirus developed increased resistance to free chlorine within ten generations.
Analysis of Variance Table for the Dose-Normalized Log10 Differences with Respect to the Number of Sequential Exposures to Free Chlorine
Based on these ANOVA results, we used data from all 10 generations to calculate the overall average log10 reduction (normalized by chlorine concentrations and contact times).
Excluding the first two generations, the average initial chlorine concentration was 0.5 mg/L. For a 0.5 mg/L concentration, the average normalized reductions we observed equate to a 1.0-log10 (95% confidence interval [CI]: 0.2-log10 to 1.8-log10) reduction in 2.7 min (i.e., T90) or a 2.0-log10 (95% CI: 1.3-log10 to 2.7-log10) reduction in 5.2 min (i.e., T99). Normalized to a contact time of 10 min, this equates to a 1-log10 (95% CI: 0.2-log10 to 1.8-log10) reduction with 0.14 mg/L free chlorine, a 2-log10 (95% CI: 1.3-log10 to 2.7-log10) reduction with 0.26 mg/L free chlorine, or a 3-log10 (95% CI: 1.7-log10 to 4.3-log10) reduction with 0.38 mg/L free chlorine. This is similar to what was reported for somatic coliphage PhiX174 in mineral water, where a 3.2-log10 reduction was achieved after 10 min with an initial free chlorine concentration of 0.5 mg/L (Durán et al, 2003).
In our experiments, T7 was more resistant to free chlorine than the ssRNA coliphage MS2, which experienced a 4.3-log10 reduction from a 2 mg-min/L dose (Meister et al, 2018), which, assuming minimal decay of free chlorine, is equivalent to a concentration of 0.2 mg/L with a 10-min contact time. This is greater reduction than what we found for T7 (e.g., the equivalent 2-log10 (95% CI: 1.3-log10 to 2.7-log10) reduction with 0.26 mg/L free chlorine after 10 min). We also found T7 to be more resistant than some human viruses, such as the Faulkner B5 coxsackievirus, a member of the enterovirus family with an ssRNA genome, which decayed by more than 2-log10 units in 10 min with a free chlorine concentration of 0.1 mg/L in chlorine demand-free phosphate-buffered saline (PBS) (Shirasaki et al, 2020).
This is lower than the concentration of 0.14 mg/L, which we found corresponded with a 1-log10 reduction (95% CI: 0.2-log10 to 1.8-log10) for T7 for a contact time of 10 min. However, the resistance of viruses to free chlorine can vary within the same serotype (Meister et al, 2018), and the first-order decay rate coefficients for free chlorine disinfection of coxsackievirus B5 strains isolated from the environment ranged from 0.8 to 4.9 L/mg-min (a range that includes what we found for T7). More research is needed to compare the decay of bacteriophages circulating in the environment, as their persistence may differ from laboratory strains.
The ability for viruses to adapt increased resistance to free chlorine is influenced by the genome's mutation rate and the reactivity of the genome and the capsid with free chlorine. Replication of DNA genomes is not prone to as many errors as RNA genomes, causing more frequent mutations and more rapid evolution by RNA viruses (Domingo et al, 1996). Mutation rates relative to genome size are consistent for DNA viruses (Drake, 1991), but more variable for RNA viruses (Combe and Sanjuán, 2014). Similar to other members of the somatic coliphage group, T7 has a dsDNA genome ∼40 kb, which is small for bacteriophages. As such, its mutation rate is likely slower than that of most pathogenic viruses but high relative to some other dsDNA bacteriophages.
The reactivity of virus genomes with chlorine is also dependent on genome type (RNA is damaged faster than DNA). Naked dsDNA extracted from T3 coliphage (genome length of ∼38K bp) reacted with free chlorine more than 30 times more slowly than naked ssDNA, dsRNA, and ssRNA extracted from Phi6 (genome length of ∼13.5K bp), PhiX174 (genome length of ∼5K bp), and MS2 phage (genome length of ∼3.5K bp), respectively (Qiao et al, 2022). Also, dsDNA reactivity increases with higher chloride concentrations, but the same is not true for ssDNA (Szczuka et al, 2022). T7 is closely related to T3, and so, its reactivity with chlorine is likely slower than that of many pathogenic viruses and slower than or similar to that of other DNA bacteriophage indicators.
The protection offered by capsids also influences viruses' susceptibility to chlorination and the extent of this protective effect likely differs between viruses. Hypochlorite reacts more readily with cysteine, methionine, histidine, serine, and leucine than with other amino acids (Hawkins et al, 2003), which could explain the differences between viruses, depending on the composition of exposed capsid proteins. Qiao et al (2022) found that encapsidation had a protective effect on the chlorine-induced degradation of viral nucleic acids, which was greater for DNA genomes than it was for RNA genomes. Fuzawa et al (2019) reported that 1.7 ppm of free chlorine induced rotavirus to lose its ability to bind to host receptors within 1 min, while the Tulane virus only lost its binding capabilities after exposure to 29 ppm of free chlorine during 1 min.
Pepper mild mottle virus, an ssRNA plant virus, required a chlorine dose of 71.4 mg-min/L to achieve a 3-log10 reduction in PBS—this is much higher than coxsackievirus, which experienced a 3-log10 reduction under the same conditions but with less than 1.0 mg-min/L chlorine (Shirasaki et al, 2020). T7 has a 60 nm icosahedral capsid with an internal core and six fibers that interact with the host cell surface through a short noncontractile tail, which extends to enable genome delivery (Hu et al, 2013). This capsid size is relatively small compared with other tailed phages, whose capsid diameters generally range from 40 to 180 nm (Lee et al, 2022).
In summary, the protective effect of encapsidation varies between viruses, and there is currently no way to mechanistically predict a virus's susceptibility to chlorination based on its genome type and capsid size (Qiao et al, 2022). Future research is needed to better understand the influence of mutation rates, genome type, and capsid reactivity on virus's evolvability to chlorine treatment, to help determine suitable bacteriophage indicators for disinfection processes.
Experimental evolution with temperature
Results from the temperature shift experiment with GEN-0 revealed slow decay from 50°C to 64°C (prebreakpoint period; Fig. 2a), followed by rapid inactivation, indicating a breakpoint of 65°C. This is similar to MS2 coliphage, but much lower than bacteriophage PP7 (Caldeira and Peabody, 2007). Unlike MS2, PP7 has disulfide bonds in its capsid proteins, which cause greater thermal stability (e.g., when PP7 was heated with dithiothreitol under reducing conditions to break the disulfide bonds, the breakpoint temperature was lower) (Caldeira and Peabody, 2007). T7 has disulfide bonds in its tail structure (Cuervo et al, 2013), but not in its capsid proteins.
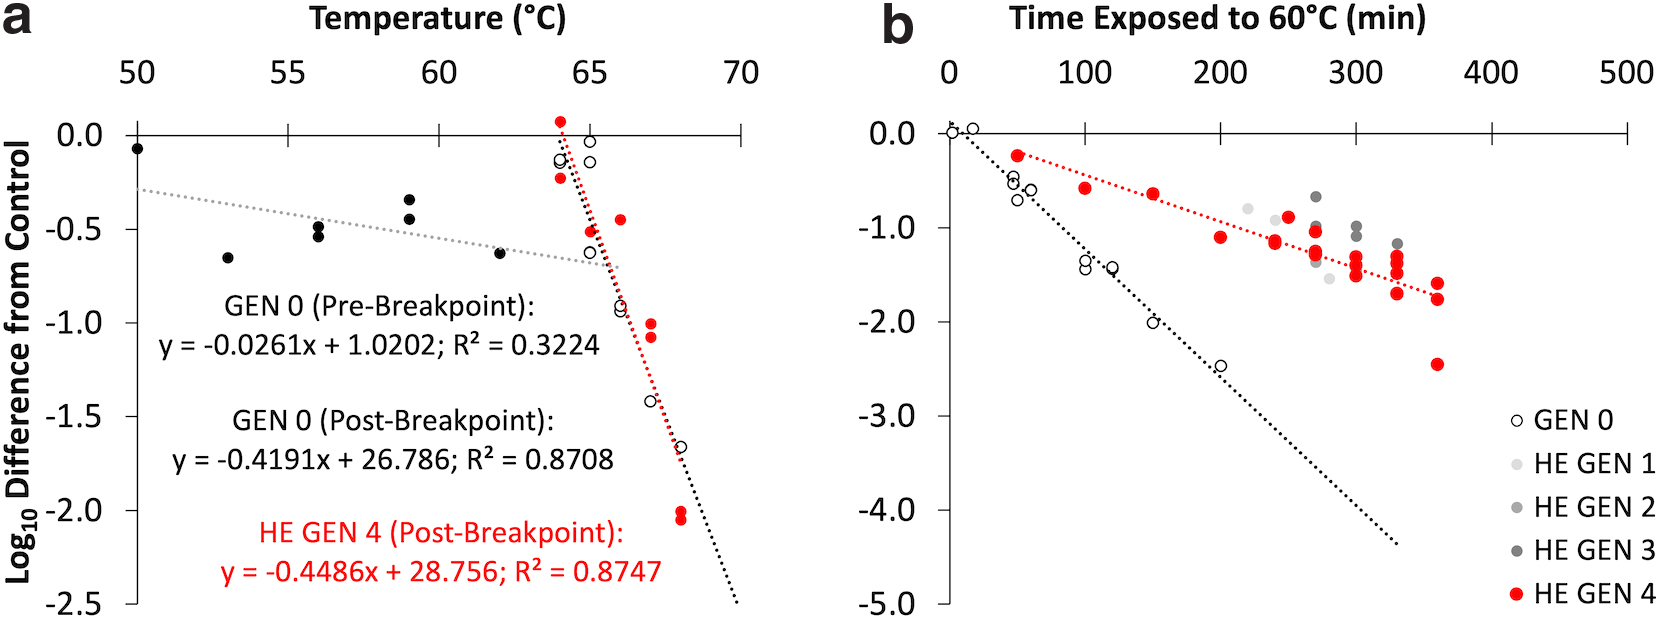
Results for unexposed T7 coliphage (GEN 0) and T7 coliphage that was exposed to sequential cycles of inactivation at 60°C (HE GEN 1 through HE GEN 4) from
Each generation of heat-adapted T7 coliphage was exposed to 60°C for a period that resulted in 90–99% inactivation (Table 3). The exposure time for the first generation was 120 min, but the time more than doubled for the next exposure (Fig. 2b), then stayed consistent for the following three exposures. The experiment was stopped after the fourth generation. Decay did not appear to correlate with the generation number. Elucidating the reasons for this lack of correlation was not within this study's scope, but one hypothesis is that T7's persistence may have changed drastically in a single generation, potentially due to mutations that conferred a competitive advantage.
Summary of the Exposure Times at 60°C and the Log10 Differences in T7 Coliphage Concentrations During Each Generation
To confirm that GEN-0's decay rate was different than HE-GEN-4, the time shift experiment was repeated at least once for both generations (Fig. 2b). First-order decay rate coefficients for GEN-0 and HE-GEN-4 were 0.031 min−1 (95% CI: 0.028–0.034) and 0.011 min−1 (95% CI: 0.0087–0.014), respectively, and were significantly different from each other (p-value <0.001) (Table 4).
Summary of the Estimated Pseudofirst-Order Decay Rate Coefficients and Predicted T90 Values for the Original Strain of T7 (GEN 0) and the Fourth Generation of Heat-Exposed T7 (HE GEN 4)
Decay rate coefficients were calculated based on a sample size of 14 total data points collected in duplicate experiments (GEN 0) or 21 total data points collected in triplicate experiments.
Our results differed from previous studies. Ritchie and Malcolm (1970) found that T7 became more stable at 60°C after ten back-to-back heat cycles; the original wild-type strain was reduced by ∼3-log10 after 15 min, but heat-tolerant mutants generally experienced a 1-log10 reduction after 20 min. Our GEN-0 and HE-GEN-4 T7 strains survived for much longer at 60°C, and adapted after fewer exposure cycles. Heineman and Brown (2012) were unsuccessful at adapting T7 to 63°C after three consecutive exposures that achieved a 4-log10 reduction. However, Cole et al (2021) successfully adapted T7 to survive at 70°C for 1 h by putting them through 51 consecutive heat challenges, starting at 58°C, then increased the temperature by 1°C until at least 0.01% retained infectivity after three successive challenges at the previous temperature.
In our experiments, there was no significant difference between the breakpoint temperatures of HE-GEN-4 and GEN-0 (Fig. 2a), which contrasts with previous findings for RNA viruses. For example, poliovirus's breakpoint temperature increased from 51°C to 59°C after 10 subsequent exposures to 51°C, 12 exposures to 53°C, then another 10 exposures to 57°C—this change in breakpoint temperature corresponded with conformational changes to capsid proteins that peaked at 48°C for the wild-type strain, but did not peak until 59°C for the 57°C heat-adapted strain (Adeyemi et al, 2017). Also, coxsackievirus B5 was adapted to 50°C and 55°C after 10 subsequent exposures, and the breakpoint temperatures increased by more than 2°C (Meister, 2019). Also, echovirus was adapted to 10°C and 30°C, and the 30°C-adapted strains had higher breakpoint temperatures than the 10°C-adapted strains (Carratalá et al, 2020).
The effect of thermal adaptation on breakpoint temperatures has not been studied as much for DNA bacteriophages. Phi6 adapted to higher temperatures after 50 consecutive exposures to 45°C (McBride et al, 2008) and ∼30 consecutive exposures to temperatures ranging from 45°C to 50°C (Singhal et al, 2017). Singhal et al (2017) reported that breakpoint temperatures increased by up to 2.5°C, but only for six out of nine thermally adapted populations. The adaptation of phiX174 to 54°C (Kadowaki et al, 1987) and 70°C has also been reported (Cox et al, 2010), but breakpoint temperatures were not assessed.
Broader implications and limitations
There are important limitations to this study that should be acknowledged before translating the findings to real-world applications. First, we used a laboratory strain of T7, which may respond differently to treatments than the circulating environmental strains. Also, we used pure media and pH-neutral buffers to dilute and suspend T7, and so, its response to chlorination and heat treatment in a real system may be different, due to matrix effects.
Despite these limitations, our findings have broader implications for scientific and practitioner communities. For example, T7's response to free chlorine and heat treatment differed from what has been previously reported for human viruses and other bacteriophages, implying that not all bacteriophages are appropriate indicators or surrogates of all human viruses for a given treatment process. More caution is warranted when choosing virus indicators and when interpreting results from studies that use T7 to indicate the performance of chlorination or heat treatment systems. Also, it may be necessary to pay attention to potential differences in the adaptation of viruses and indicators during treatment processes.
There are also implications for practitioners. Caution should be taken when using T7 as a sole indicator for chlorination or thermal treatment processes. There is a lack of information in the literature about the survival of other somatic coliphages during chlorination or heat treatment, but if their survival is similar to what we found for T7, then the somatic coliphage group may have more limited utility as indicators or surrogates of enteric viruses in certain environmental systems.
Conclusions
We challenged T7 bacteriophage to consecutive exposures to free chlorine and thermal treatment. T7 failed to develop an increased resistance to free chlorine after 10 consecutive exposures. This finding supports the hypothesis that a virus's ability to adapt an increased resistance to free chlorine may be limited by the fact that free chlorine attacks both the capsid and genome, unlike other disinfectants that react preferentially with capsid proteins (Wigginton et al, 2012). We also found that T7 developed an increased resistance to thermal treatment at 60°C after only four consecutive exposures, and the T90 value of the adapted strain was more than twice that of the original strain, but the breakpoint temperature did not significantly change.
Results from this study indicate that T7 can adapt to heat, and that increases in the decay rate can develop independently of changes in the capsid breakpoint temperature. Virus adaptations to treatment processes should be considered when evaluating the use of bacteriophages as indicators of pathogenic viruses, and not all bacteriophages are suitable indicators for all treatment processes. Further research is needed to compare the decay rates and response of laboratory bacteriophage strains with strains that are circulating in the environment, as their decay rates may differ. Future research is also needed to better understand the influence of mutation rate, virus genome type, and virus capsid reactivity on a virus's evolvability to chlorine and heat treatments, to help determine which bacteriophages are the most suitable indicators, proxies, or surrogates for pathogenic viruses.
Footnotes
Acknowledgments
Dr. Anca Segall (SDSU) kindly provided T7 and its host. Dr. Anna Carratalá provided advice about our experimental protocol. We thank Jose Calderon, Arnold Wong, Shr-Hau Hong, and Tram Le for their help in the laboratory. Dr. Christy Dykstra and Dr. Naveen Vaidya were members of the lead author's thesis committee. Nicole Brokaw and Sandra Maxwell helped with hiring and purchasing.
Authors' Contributions
The authors made the following contributions, in accordance with the CRediT system: F.Z. (investigation, validation, and writing—original draft); A.G (investigation and methodology); M.E.V. (conceptualization, formal analysis, funding acquisition, methodology, supervision, visualization, and writing).
Author Disclosure Statement
No competing financial interests exist.
Funding Information
Funding was provided by the San Diego State University (SDSU) Division of Research Affairs through the University Grants Program (award no. 242607) and the Summer Undergraduate Research Program (award no. 202018).