
Abstract
Rice husk (RH)-based activated carbons (ACs) were successfully manufactured and used as an adsorbent for the removal of methylene blue (MB) dye from polluted water. ACs were created by impregnating RH char with sodium hydroxide and then activating it for 1 h in a nitrogen environment at various activation temperatures. The characteristics of the obtained ACs were confirmed using Brunauer-Emmett-Teller analysis, scanning electron microscopy, X-ray diffraction analysis, and Fourier-transform infrared spectroscopy. The prepared ACs' pore volume and surface area increased with increasing temperature. The maximum specific surface area of the ACs sample was 729.4 m2/g at 900°C activation temperature. Adsorption was used to remove MB dye from polluted water using the obtained product. The effect of experimental parameters like adsorbent dosage, initial MB dye concentration, contact time, temperature, and pH of the MB dye solution was studied. The synthesized ACs were found to remove 80% of the MB dye under optimal conditions of pH (8), initial concentration (50 mg/L), and contact time (120 min). To represent the fitness of the adsorption data, the Langmuir and Freundlich isotherm models were used. The Langmuir model was found to be the best fit to equilibrium data, with R2 = 0.9972. Similarly, using pseudo first-order and pseudo second-order kinetic models, MB dye adsorption on ACs followed the pseudo-second order with an R2 value of 0.99719. The results show that synthesized RH-based ACs have a high potential for use as an effective adsorbent for removing dye from polluted water.
Introduction
Activated carbons (ACs) are extremely important due to their potential applications as an adsorbent for air/water purification, solvent separation, and catalyst/catalyst supports, as storage materials for energy and gases, food processing, pharmaceutical (Ghazali et al., 2020; Reza et al., 2020; Sevilla and Mokaya, 2014), and so on. The significance of these materials stems from their unique properties, which include a high porous structure and a high specific surface area. They are made from carbonaceous materials with high carbon content through carbonization and activation.
Their characteristic porous structure and adsorption properties can be achieved in precursor materials through either physical or chemical activation (Shamsuddin et al., 2016). During physical activation, precursor materials are pyrolyzed at temperatures ranging from 800°C to 1,000°C to produce charcoal, which is then activated with steam, air, or carbon dioxide (Ani et al., 2020). Carbonaceous materials are impregnated with active agents such as potassium hydroxide, sodium hydroxide (NaOH), zinc chloride, and others before being chemically activated at temperatures ranging from 400°C to 800°C under N2 gas (Safitri et al., 2017).
The activating agents vigorously affect the pyrolytic disintegration of precursors, preventing the growth of tar and volatile matter, and thus essentially increasing the AC yield. Activating agents require lower activation temperatures than physical activation for dehydration and oxidation within biomass materials, resulting in the formation of micro pores (Sakhiya et al., 2020). The ACs obtained through chemical activation have large surface area and high micro porosity compared to physical activation. However, chemical method has the drawback of chemical corrosion, which harms equipment (Azargohar and Dalai, 2008).
AC production has received a lot of attention due to their novel applications in various new technologies (Kwiatkowski, 2012); they are typically made from coal and agricultural biomass (Soffian et al., 2022; Wazir et al., 2020a). One of the most commonly used adsorbents is ACs made from coal, but it is expensive and unsustainable, while agricultural biomasses with high cellulose, hemicellulose, and lignin content are thought to be a suitable alternative precursor for low-cost AC production (Ouyang et al., 2020). Almond shells, cane bagasse, cashew nut shells, coconut shells, corn cob, date pits and pistachio shells, orange peel, rice husk (RH), and walnut shells have all been used to make ACs (Farnane et al., 2018; Guilluame et al., 2020; Neme et al., 2022; Younis et al., 2022).
Among the aforementioned sources, RH is considered to be one of the cheapest by-products obtained from rice milling factories and is usually dumped as waste, and is mostly used as a fuel in the Brick Killen Factories and in the Boilers for processing paddy in Pakistan, causing a serious environmental issue (Tareen et al., 2020). Therefore, it is critical to fully utilize RH in the form of ACs, which is commonly used to remove heavy metals and synthetic dyes found in polluted water effluents from various industries (Bello et al., 2012; Mondal, 2008; Neolaka et al., 2023).
For example, Rahma (2020) studied the NaOH activation method to prepare AC with a Brunauer-Emmett-Teller (BET) surface area of 429.32 m2/g at 850°C from RH and determined their characteristic properties using Fourier-transform infrared (FTIR) spectroscopy, scanning electron microscopy (SEM), and X-ray diffraction (XRD). Kennedy et al. (2004) investigated phosphoric acid activation at 900°C to produce AC from RH with a BET area of 438.9 m2/g. Rahman et al. (2012) prepared ACs from RH using sulfuric acid and zinc chloride as activating agents and used them for methylene blue (MB) adsorption in polluted water.
Saad et al. (2020) synthesized ACs from rice straw using potassium hydroxide and NaOH as activators and characterized them using BET, FTIR, and SEM. After chemical activation with NaOH at 850°C, the AC product with a BET surface area of 332.8 m2/g was used to adsorb MB dye from an aqueous MB dye solution, and the adsorption efficiency was found to be good. Zhang et al. (2012) investigated RH ash-based ACs using a chemical-thermal process and used them to adsorb MB dye from polluted water with an adsorption capacity of 22.64 mg/g.
Similarly, ACs were synthesized from other biomass wastes, including coconut leaves, waste orange and lemon peels, grape wood wastes, and Coriandrum sativum, and used to remove MB dye from an aqueous MB dye solution as polluted water (adsorption capacities of 66, 38, 5.88, and 94.966 mg/g) (Abd Rashid et al., 2018; de Souza et al., 2022; Mousavi et al., 2022; Ramutshatsha-Makhwedzha et al., 2022). Furthermore, in fixed-bed columns, simple modified RH has been used to remove heavy metals such as copper, iron, and manganese from synthetic wastewater (Al-Saedi et al., 2022).
This study also aims to chemically prepare ACs from locally available RH and use them to remove MB dye from polluted water. The effects of activation temperature on product samples' morphology, porous structure, and specific surface area have been examined. Using an aqueous MB dye solution as polluted water, the MB dye adsorption study on the AC sample was also explored. The effects of different experimental factors such as adsorbent dose, concentration, contact time, pH, and temperature were studied for maximum adsorption. After analysis of experimental data using adsorption isotherms and kinetics studies, the AC sample proved to be an effective adsorbent that could be used to address RH elimination and pollution issues.
Materials and Methods
RH was collected from rice milling machines in District Bannu, Khyber Pukhtunhwa, Pakistan. RH was washed repeatedly with tap water and then with distilled water to remove impurities before being dried in an oven at 100°C for 24 h. Sigma-Aldrich provided the hydrochloric acid (HCl) and NaOH. In our previous article, we presented the results of the proximate and ultimate analyses, as well as the chemical composition of the precursor RH (Wazir et al., 2020b). The chemical composition of RH is determined by the absorption of various metals from soil by rice plant roots and the storage of those metals in their tissues by translocation (Zhang et al., 2021).
Chemical activation
A stainless steel reaction container containing 100 g of RH sample was loaded into a heating chamber (assembly was made locally) and pyrolyzed for 2 h at 400°C under nitrogen (100 mL/min) to produce rice husk char (RHC). The yields and weight losses were calculated to be 41.63% and 58.37%, respectively. The RHC was ground and sieved to a mesh size of 45 m using a Standard Sieve model: BS410; Fisher (United Kingdom). The sieved RHC was then chemically activated using the impregnated method (Kalderis et al., 2008; Le Van and Thi, 2014).
The RHC sample was mixed with 50 mL of NaOH solution and impregnated with constant stirring for 1 h at 60°C with an NaOH to RHC ratio of 1:1 (w/v). The obtained RHC slurry was oven dried for 24 h at 110°C after impregnation. The dried NaOH-loaded RHC samples were then activated for 1 h under nitrogen (at a flow rate of 100 mL/min) and at a heating rate of 10°C/min in a horizontal split tube furnace (Model: HST12/600; Carbolite, United Kingdom). Samples were collected after cooling and washed with 1 M HCl solution before being filtered with deionized water to achieve a normal pH for the filtrate.
Finally, at temperatures ranging from 700°C to 900°C, the chemically activated carbons (CAC) were labeled as CAC700°C, CAC800°C, and CAC900°C. Similarly, the product's burn off (%) and yield (%) were measured, as shown in Table 1, which revealed that as activation temperature increased, the percent burn off increased and the percent yield decreased, respectively.
The Burn Off (%) and Yield (%) of CAC Produced at Various Activation Temperatures for 1 h
Preparation of MB dye solution
A 0.5 g MB dye stock solution in 500 mL of distilled water was prepared. Furthermore, the stock solution was used to prepare diluted solutions of various concentrations for various experiments.
Adsorption procedure
The batch adsorption approach employed one of the RH-based chemical AC samples generated at 900 °C activation temperature, indicated as CAC900°C. Adsorption studies were conducted in 250-mL Erlenmeyer flasks containing AC as an adsorbent and 100 mL of MB dye solution with varying starting concentrations in isothermal water bath shaker at 130 rpm and 30°C. The flasks were stirred for specific time periods before the MB dye solutions were filtered with filter paper (Grade 42). The dye concentrations in the filtrate solutions were determined using a ultraviolet-visible spectrophotometer (Model: UH5300, S. No. 3050-044) based on maximum absorbance at 664 nm after filtering. The pH of solutions was adjusted using the NaOH and HCl reagents. To calculate the adsorbed amount and percentage elimination of MB dye, the following formulae were used:
and
where Co is the concentration of MB dye in solution before treatment and Ce is the concentration of MB dye in solution after treatment. Similarly, V represents the volume of solution and M represents the mass of the adsorbent.
Adsorption isotherms
The two well-known adsorption isotherms of Langmuir and Freundlich (Pathania et al., 2017; Tan and Nguyen, 2021) were used for the adsorption of MB dye onto an AC sample (CAC900°C). The Langmuir isotherm's linear equation is given as
where qm (mg/g) is the amount of MB dye adsorbed onto the adsorbent as a result of monolayer formation. KL (L/g) is the Langmuir constant, which is related to adsorption free energy and binding site affinity. The qe (mg/g) is the MB dye concentration at equilibrium on the adsorbent. Ce (mg/L) is the MB dye concentration at equilibrium in solution. From the slope and intercept of Ce against Ce/qe plotting, the values of qm and KL are estimated. The fundamental feature of the Langmuir isotherm can be articulated in terms of the separation factor (RL), shown as
The RL (dimensionless constant) value determines the type of isotherm, which can be considered linear (RL = 1), favorable (0 < RL > 1), unfavorable (RL > 1), or irreversible (RL = 0).
The Freundlich isotherm's mathematically linear shape (Bello et al., 2012) is represented by the equation given below.
where, KF [mg/g·(L/mg)1/n] denotes the Freundlich constant used to calculate adsorption capacity and 1/n denotes adsorption intensity, which indicates whether the adsorption process is favorable or unfavorable. The intercept and slope of the lnqe versus lnCe plot are used to calculate the n and KF values.
Adsorption kinetic study
Two well-known pseudo-first and pseudo-second order models (Amar et al., 2021; Jawad et al., 2016; Wazir et al., 2020c) were used for the adsorption kinetic study. The pseudo-first order is used as follows:
where qt (mg/g) denotes the adsorption capacity at time interval t and K1 (min−1) denotes the equilibrium rate constant. The slope and intercept of the plot of ln(qe − qt) against t were used to calculate K1 and qe.
The pseudo-second order is used as follows:
where, K2 [g/(mg·min)] is the second-order equilibrium rate constant. The slope and intercept of the t/qe versus t plot were used to calculate the qe and K2 values, respectively.
Characterization
Surface area and porosity of ACs were measured using N2-physical adsorption data from 77K (Quantachrome-NOVA-2200e). ACs was dried for 2 h at 120°C before being vacuumed for 5 h after degassing at 150°C. SEM (JEOL, Japan) was utilized to study the surface morphology of ACs. The surface functional groups of powdered ACs were determined using an FTIR spectrometer (Eco-ATR-FTIR Spectrometer, Alpha; Bruker). XRD was also performed using a diffractometer and X-rays-CuKa (λ = 1.5418) (Model: JDX-3532; JEOL).
Results and Discussion
Activation behavior of ACs products
Figure 1a, b, and c depicts the BET and Barrett-Joyner-Halenda (BJH) pore size distribution curves and N2 adsorption isotherms of RHC-based chemical ACs produced at different activation temperatures (700°C, 800°C, and 900°C) for a residence time of 1 h. The plotted isotherms were thought to be a mixture of types (I) and (IV) according to the classification of the “International Union of Pure and Applied Chemistry” (Sing, 1985), because a sharp knee was displayed at a relative pressure less than 0.1, indicating the presence of micropores. The pore size distribution curves assign twofold micropore and mesopore structures to the resulting RHC-based ACs. Table 2 also shows AC samples with various pore properties.

Pore Properties of CAC Produced at Various Activation Temperatures for 1 h
BET, Brunauer-Emmett-Teller; BJH, Barrett-Joyner-Halenda; SA, surface area.
All AC samples have the same properties when activated at different temperatures, but one of the AC samples obtained at 900 °C and designated as CAC900°C for 1 h had the highest mean pore radius of 15 Å and surface area of 730 m2/g. Figure 1d depicts the effect of activation temperature on surface area. It was demonstrated that increasing the activation temperature increased the surface area of ACs. Similarly, Fig. 2a, b, and c shows SEM microphotographs that show the well-developed porous structure of RHC-based ACs with a variety of pore sizes (Gao et al., 2019; Li and Xiao, 2019).

SEM images of CAC produced at various activation temperatures for 1 h
The mechanism of NaOH as an activating agent with carbon has also been reported previously (Guo et al., 2003; Linares-Solano et al., 2012; Liou et al., 2016), and is thought to be a complex procedure that can be represented by the equations given below:
At high temperatures, the RHC sample decomposes into sodium carbonate, molecular hydrogen, carbon dioxide or carbon monoxide, and free metals. At temperatures ranging from 700°C to 900°C, the activation process takes place with lower carbon and hydroxide ratios than necessary for a stoichiometric relationship. Pore development in the carbon structure happens as a result of the elimination of these compounds from the carbon sample.
XRD analysis of AC products
The XRD patterns of ACs produced from RHC with a chemical activating agent (NaOH) at varying activation temperatures (700–900°C) for 1 h are shown in Fig. 3. The carbon structures in all ACs products are amorphous, where, two significant reflection bands, one broad band at 2θ = 26° and another minor band at 2θ = 44°, indicate typical characteristics of amorphous carbons. According to the literature, both of these bands correspond to (002) and (100) lattice planes of micrographitic carbon clusters formed at elevated temperatures during the activation process (Shen and Fu, 2018; Shrestha et al., 2019).

XRD patterns of CAC obtained at activation temperatures (700–900 °C) for 1 h.
FTIR analysis of ACs products
The FTIR spectra of ACs prepared from RHC to NaOH ratio of (1:1) at different activation temperatures (700–900°C) for 1 h are shown in Fig. 4a. All the spectra show broad bands that are established around 3,600 cm−1 and can be attributed to the stretching vibration modes of O-H groups. Bands situated around 2,360 and 1,525 cm−1 may be ascribed to C = C and C

Other bands detected in the wave number region 1,744, 1,698, and 1,652 cm−1 may be attributed to C = O stretching vibrations in lactones, ketones, carboxyl groups or aldehydes. Bands near 1,462 and 1,215 cm−1 could be attributed to -CH2 and C-O stretching modes. C − H bending vibrations could be assigned to the band at wave number 675 cm−1 (Alvarez et al., 2015; Song et al., 2012). There are no absorption bands relating to SiO2 in any of the spectra. As a result, FTIR analysis confirms that the samples are ACs with no evidence of SiO2.
FTIR analysis of ACs after MB dye adsorption
The FTIR spectrum of an AC sample (CAC900°C) after MB dye adsorption is shown in Fig. 4b. After the process of MB dye adsorption, the spectrum reveals the appearance of some new bands as well as some shifted and remaining bands. Before adsorption, FTIR spectra of AC samples with various functionalities such as C = C, C = O, C-O, C-H, -CH2, and O-H are suggested to be involved in MB dye adsorption through the mechanistic approach of chemical bonding and π-π—interaction (shown in Fig. 6) (Zubair et al., 2020).
As a result, the characteristic bands at 1576.19, 1164.85, 1155.70, 1072.53, and 758.93 cm−1 were identified as N = O, C-N, C = O, and C-S (functional groups) discovered after MB dye adsorption on AC surfaces (Pathania et al., 2017). Another broad band at 612 cm−1 was detected for C-Cl (stretching vibration modes) in the sample due to MB dye adsorption (Thang et al., 2021). Similarly, some weak bands in the 600–900 cm−1 range could be assigned to C–H or O–H functional groups (out-of-plane bending modes) (Elkady et al., 2020). These findings confirmed that the MB dye was effectively adsorbed onto AC made from RH.
Removal of MB dye by ACs
Effect of initial MB dye concentration
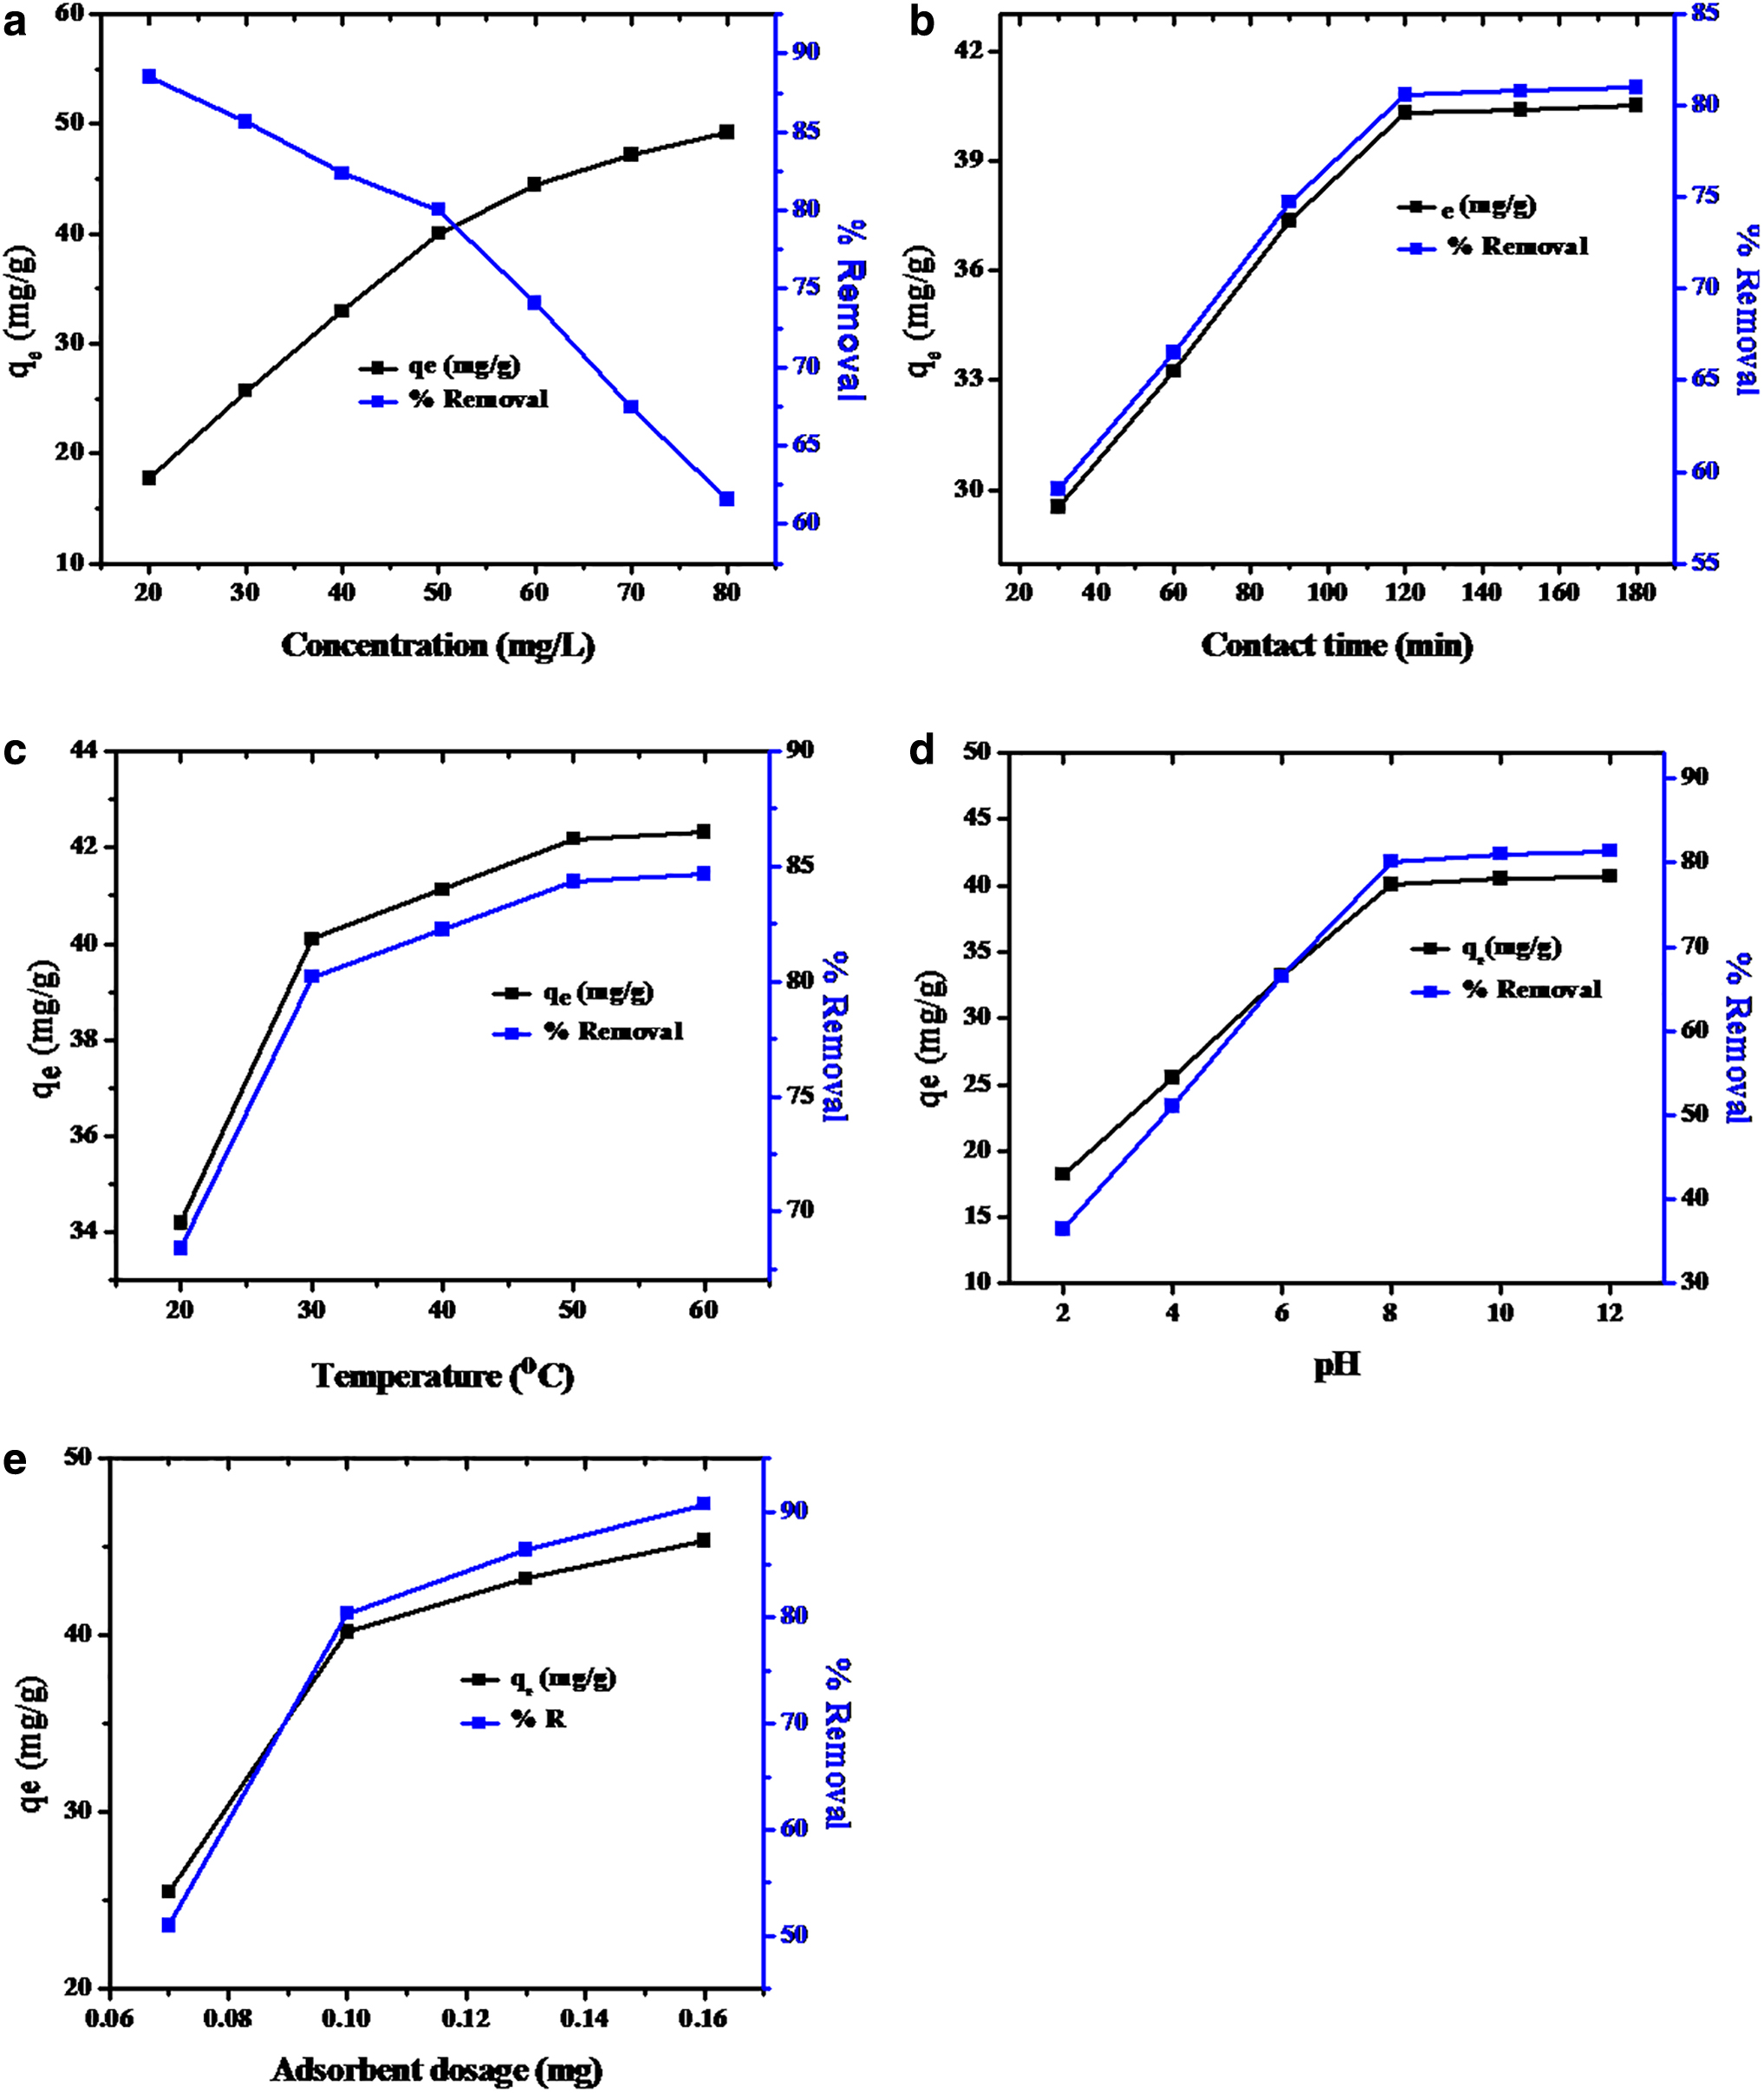
Because all the activated samples exhibited the same MB dye adsorption characteristics, one of the AC samples obtained at 900°C and designated as (CAC900°C) was selected for the MB dye molecule adsorption process. Figure 5a depicts the initial concentration effect of MB dye on adsorption onto the selected AC sample as an adsorbent. Adsorption against the adsorbent was tested in 100 mL solutions with initial concentrations ranging from 20 to 80 mg/L. The results show that the percentage removal efficiency decreases with increasing initial concentrations, while the accumulation of total MB dye molecules increases. This increase in total MB dye accumulation with increasing initial concentration could be caused by MB dye molecules contacting numerous adsorbent sites.
Effects of
As a result, the percentage removal efficiency decreased with increasing MB dye concentration in solution. The results show that the maximum amount of MB dye adsorbed by ACs is 40.02 mg/g at an initial concentration of 50 mg/L. As a result, 50 mg/L was chosen as an initial concentration for further optimization. Most of the MB in solution could make contact with the adsorbent's active sites at low concentrations, but as the MB dye solution concentration increased, all MB dye species became inaccessible to contact through the active surface of ACs because the active sites were previously covered up (Jawad et al., 2016; Rahman et al., 2012).
Effect of contact time
Figure 5b depicts the effect of contact time on the percentage removal efficiency of MB dye by RHC-based ACs. The graph depicts the percentage removal of MB dye over a contact time of 180 min, whereas equilibrium is nearly reached at a time interval of 120 min, increasing agitation time results in a slight increase in percentage removal of MB dye. As a result, an AC sample removed ∼40.03 mg/g at 50 mg/L MB dye in 120 min.
Effect of temperature on MB dye adsorption
Figure 5c depicts the effect of temperature on MB dye adsorption. The adsorption capacity of MB dye onto ACs increased rapidly as temperature increased from 20°C to 60°C. The increase in MB dye adsorption onto ACs was attributed to pore size swelling and adsorbent surface activation with temperature. An increase in temperature increases the mobility of the outsized dye ions and reduces the effect of enlargement, allowing large dye molecules to enter the adsorbent more readily. The findings also revealed that MB adsorption is an endothermic process (Erwa et al., 2022; Kuang et al., 2020; Pathania et al., 2017).
Effect of solution pH
Figure 5d depicts the effect of solution pH on the percentage removal efficiency of MB dye by ACs, whereas by using 0.1 g of adsorbent, the percentage removal efficiency increased from low to high due to an increase in the initial pH of the MB dye solution from 2 to 12. The nature of the adsorbent influences the increase in tendency of MB dye removal with increasing pH value.
As a result, the removal efficiency of MB dye increased dramatically as solution pH increased from 2 to 8, whereas at higher pH values, no significant increase in percentage removal tendency was observed. As a result, high MB dye adsorption is obtained at optimal pH 8, which is comparable to the literature (Jawad et al., 2016; Pathania et al., 2017; Tan and Nguyen, 2021). High adsorption of MB dye molecules occurred at higher pH values because the AC surface adopts a negative surface charge, which contributes to improved uptake of positively charged MB dye molecules through electrostatic attraction. Lower adsorption of MB dye molecules was observed at acidic pH values due to counteraction between the MB dye cations and surplus H+ ions in solution at adsorption sites (Corda and Kini, 2018; Kaykioğlu and Güneş, 2016; Sulaiman et al., 2021).
Effect of amount of adsorbent
The effect of AC dosage on MB dye removal efficiency was investigated. The initial volume of 100 mL was chosen for all experiments by keeping the initial concentration of MB dye solution constant at 50 mg/L. Figure 5e depicts the obtained results. The MB dye percentage removal efficiency was found to gradually increase as the amount of ACs increased from 0.07 to 0.1 g. Furthermore, no significant change in percentage removal efficiency was observed when the amount of adsorbent was increased.
The adsorption efficiency increased from 25 to 40.05 mg/g as the amount of AC increased from 0.07 to 0.1 g. It means that the adsorption efficiency increased as the number of adsorption sites increased. Thus, percentage removal efficiency was found to be in equilibrium with 0.1 g of ACs (Jawad et al., 2016). As a result, our prepared RH-based ACs exhibit good MB dye adsorption capacity when compared to that prepared from other biomass wastes such as coconut leaves, C. sativum, grape wood wastes, and waste orange and lemon peels, as cited above in the literature review. According to these findings, RH is a low-cost and renewable raw precursor for the production of AC, which could be used in environmental applications.
Adsorption isotherm
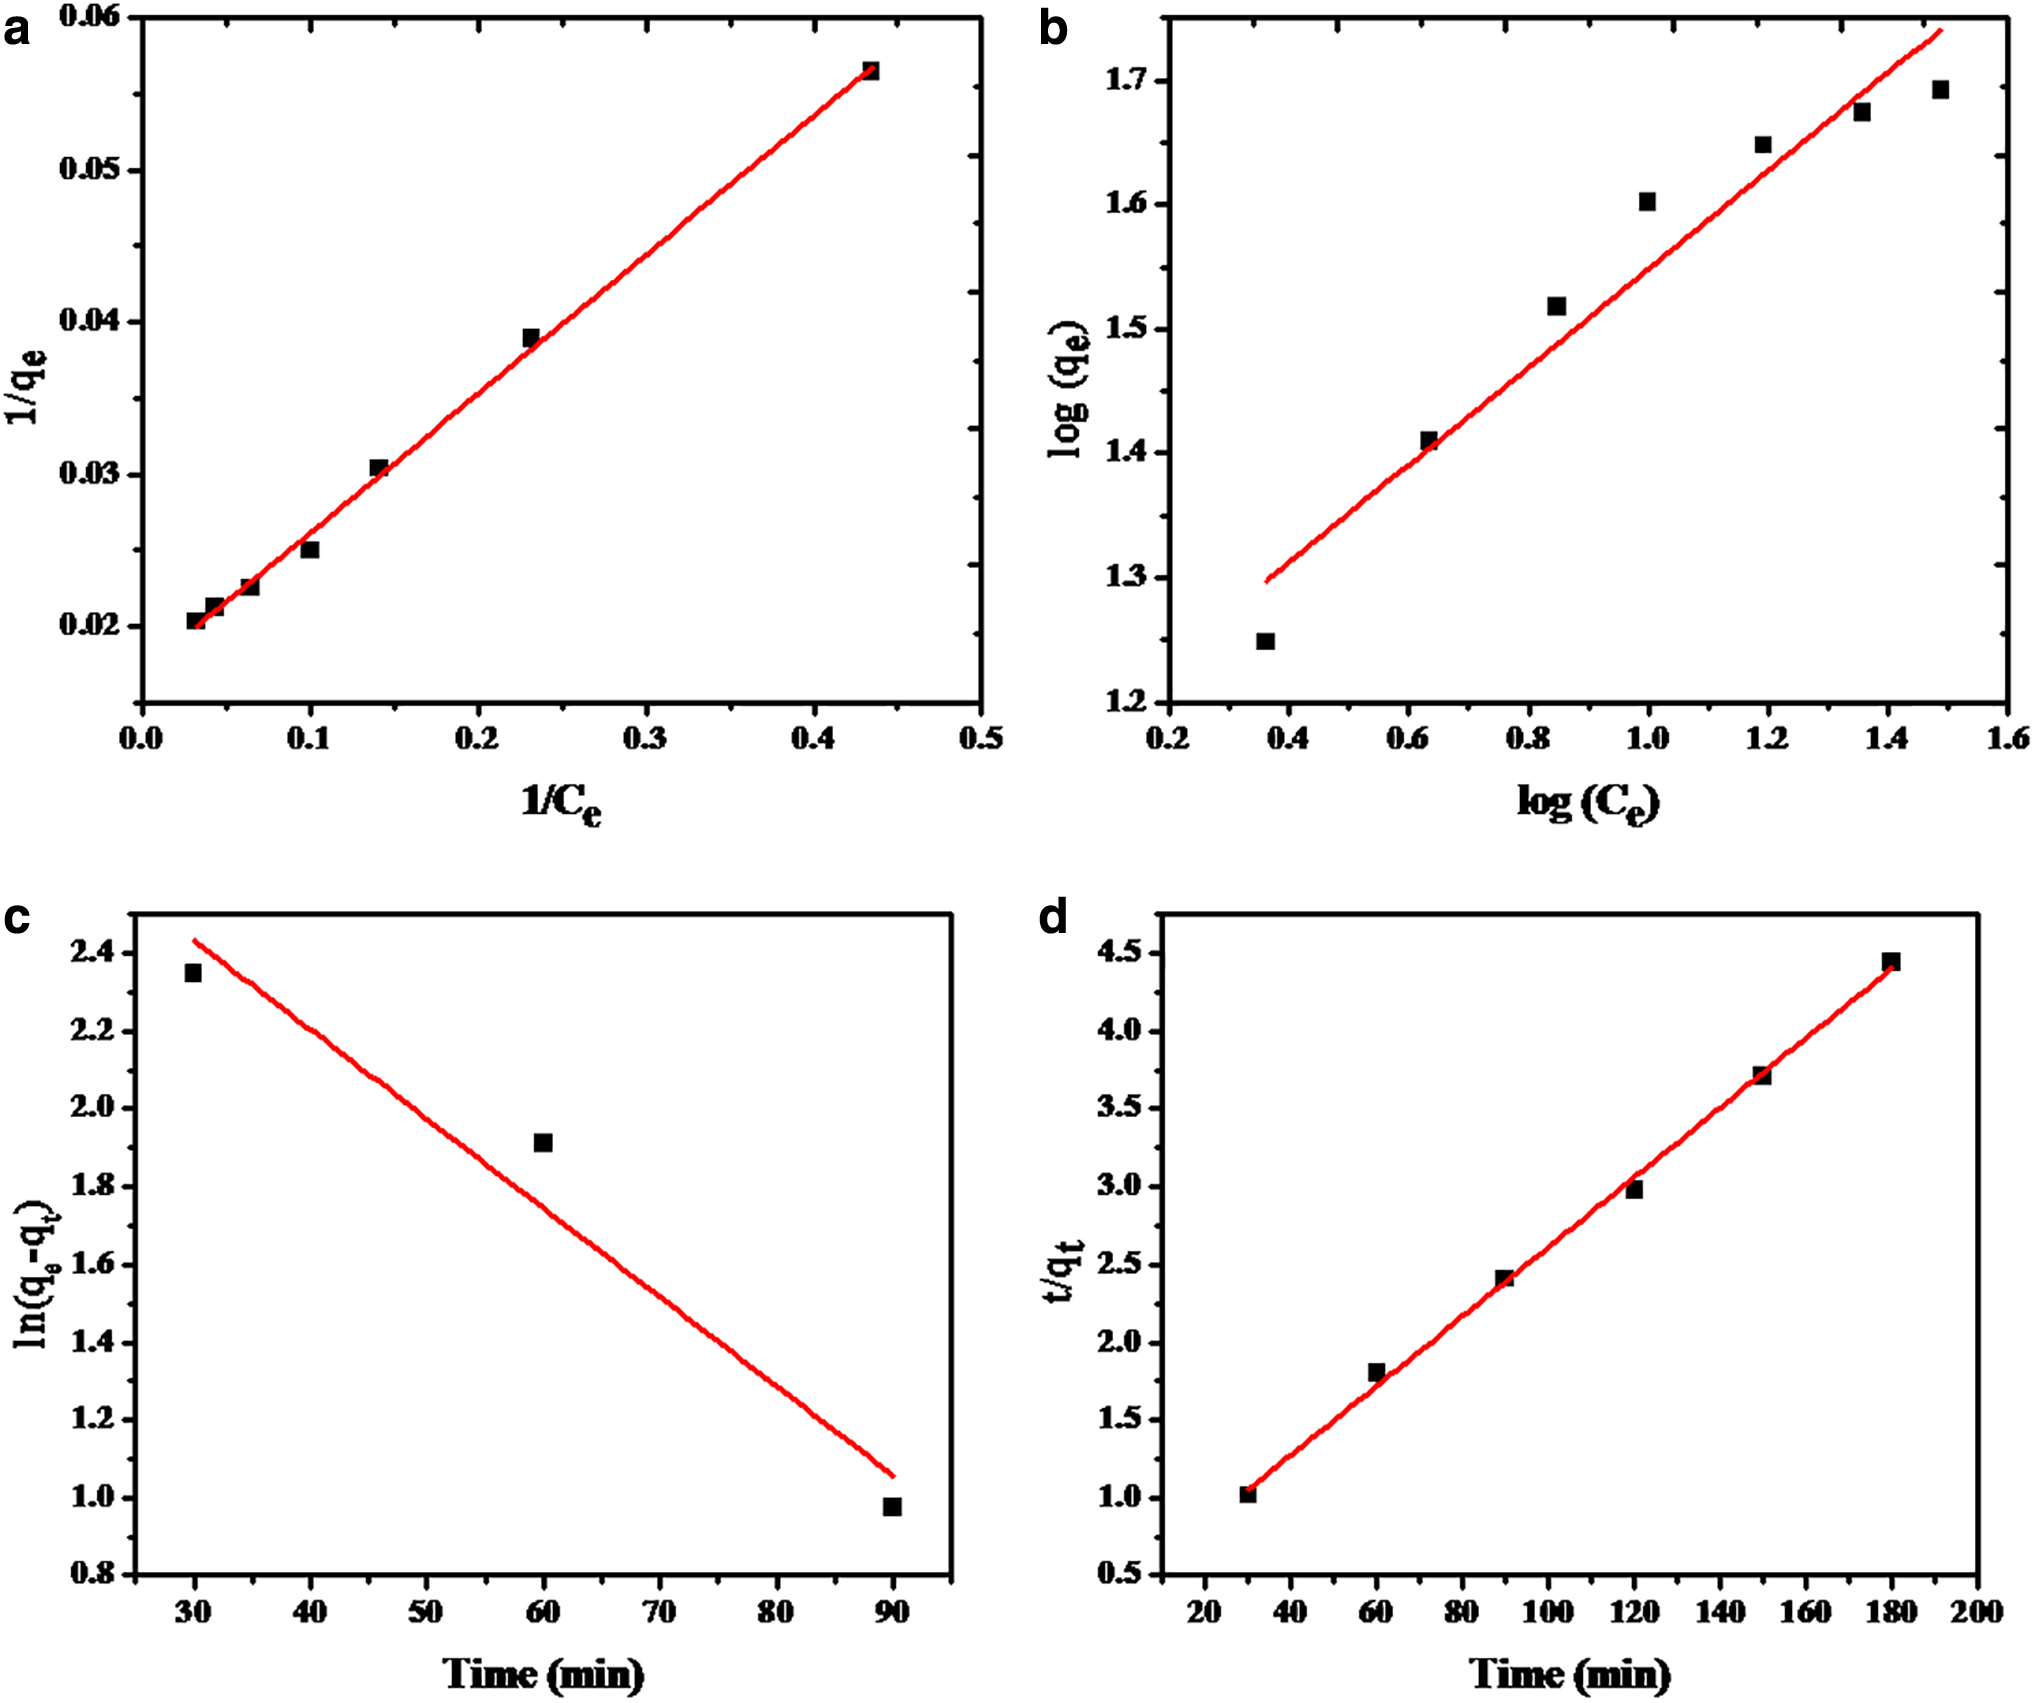
Adsorption capacity and other parameters were evaluated using the Langmuir and Freundlich isotherm models, as shown graphically in Fig. 6a and b. Table 3 summarizes the obtained values of correlation coefficients and other isotherm parameters. The adsorption capacity has been determined to be 58.96 mg/g. The high coefficient correlation value 0.997 demonstrates the applicability of the Langmuir isotherm, which is thought to provide mono-layer coverage and uniform distribution of activity across the adsorbent surface. In this case, the obtained value of RL (0 < RL < 1) favors MB dye adsorption onto ACs.
MB Adsorption Isotherm Parameters of CAC at 900 °C for 1 h
The values of equilibrium were also compared to the Freundlich equation, whereas parameters like KF and n indicated the system's adsorption capacity and intensity. The magnitude of the term (1/n) indicates the advantage of adsorbent and adsorbate systems. The coefficient correlation value is 0.93, which is less than the Langmuir value. As a result, MB dye adsorptions on RHC-based ACs are mathematically best described by Langmuir adsorption isotherms rather than Freundlich isotherms (Erwa et al., 2022; Pathania et al., 2017).
Adsorption kinetics
The data for MB dye adsorption onto ACs were tested using pseudo first-order and pseudo second-order kinetic models, as shown in Fig. 6c and d, and the results are shown in Table 4. The coefficient of determination was used to determine which models fit best (R2). The R2 value (0.997) of the second-order kinetic model is found to be greater than the R2 value (0.915) of the first-order kinetic model.
Kinetic Parameters for the MB Adsorption onto CAC at 900 °C for 1 h
The obtained qe(exp) value is close to the qe(cal), indicating that the pseudo-second order model is appropriate for describing the process of MB dye adsorption by ACs. Furthermore, it is established that the possible rate-limiting step is a chemical adsorption that controls MB dye adsorption on ACs (Jawad et al., 2016; Kuang et al., 2020; Liguang and Ke, 2021).
Conclusion
RH was effectively utilized to manufacture ACs by chemical activation with NaOH at various activation temperatures (700–900°C) for 1 h under N2. The product developed at 900°C has a maximum BET surface area of 729.4 m2/g. The XRD results confirmed the amorphous nature of the AC structures.
SEM microphotographs confirmed the well-developed porous carbon structures of AC products with varying pore sizes. Similarly, FTIR spectroscopy revealed changes in the presence of surface functional groups in the resultant products with different peak frequencies before and after MB dye adsorption. The resulting RH-based AC sample also provided a practical method for removing MB dye from polluted water, with a maximum adsorption capacity of 40 mg/g. The following operating parameters were found to be optimal for maximum adsorption: MB dye solution concentration (0.05 g/100 mL), contact time (120 min), amount of adsorbent (0.1 g/100 mL), pH (8), and temperature (30°C). Fitting the equilibrium data in the Langmuir and Freundlich isotherm models was performed.
The Langmuir isotherm (R2 = 0.9972) was discovered to be the best fit for accurately describing experimental data. The rate of MB dye adsorption on ACs was also discovered to follow a pseudo second-order kinetic model with a good coefficient correlation. As a result of the findings, high-quality ACs can be manufactured from locally available RH and effectively used as a potential adsorbent for the removal of MB dye from polluted water, potentially resolving the RH elimination and pollution concerns.
Footnotes
Authors' Contributions
I.U. carried out the experiments and wrote the article. A.H.W. was involved in the study's design, project supervision, and article editing. K.Y. read and contributed to the article.
Author Disclosure Statement
No competing financial interests exist.
Funding Information
This work is supported by the Higher Education Commission, Pakistan, for the promotion of science and technology under the National Research Program for Universities (NRPU) project number [20-1878/R&D/11/1001].