
Abstract
Food waste (FW) is an increasing concern worldwide, especially for its severe impacts on eco-environmental sustainability. However, the most recent interventions for reducing FW have still been focusing on slogans only, and the invisibility of the food-saving effect for new interventions such as small serving portions or intelligent catering systems, might weaken its application for investors. In this study, we used visual inspection, ecological footprints, and questionnaire survey to evaluate the food-saving potential by 1143 observations and 326 questionnaires at a university in Beijing, China. The results showed that using the new intervention of smaller serving portions coupled with an intelligent catering system, FW at canteens could decrease by 32.4% per year, that means it may reduce the original FW of 6.7 kt per year in Beijing, China. Correspondingly, this amount of reduced FW could equally reduce 24.7 kt of CO2-eq, 1.6 kt of nitrogen loss, 10.4 Mt of water wasted, and 2815.6 hm2 of land use. This study provided a promising alternative for soft persuasion, confirmed the potential of reducing FW and related eco-environmental loads, and increased the visibility of a new food-saving system for investors.
Introduction
An increasing public concern on food waste (FW) has arisen due to its substantial impacts on both food security and eco-environmental aspects (Oldfield et al., 2018; Wang et al., 2018). Across the globe, almost one-third of the produced food was lost or wasted (FAO, 2011), resulting in a large amount of carbon emission, nitrogen loss, freshwater waste, and land use in vain (Scialabba et al., 2013). For instance, China, as the largest developing country with rapid growth of economy, accounts for an increasing proportion of the global FW (Liu et al., 2013). Based on a 6-year field survey, the latest estimation of FW from Farm to Fork in China was 349 Mt per year and the eco-environmental load was correspondingly 464 Mt CO2-eq emission (Xue et al., 2021).
In 2018, the loss of nitrogen, phosphorus, and water waste caused by China's FW was equal to 10.4% of nitrogen fertilizer used, 5.1% of phosphorus fertilizer used and almost three times of total water storage in The Three Gorges Dam, respectively (Niu et al., 2022). Despite an alarm that FW can occur along the whole food supply chain, the consumption stage (e.g., eating) generally contributes the most of FW that can be avoidable (Betz et al., 2015; Silvennoinen et al., 2015; Xue et al., 2021). Facing such severe challenges worldwide, the United Nations proposed the Target 12.3 of the Sustainable Development Goals calling for a 50% reduction in FW at the retailing and consumption stage by 2030 (FAO, 2020).
The FW at the consumption stage is usually categorized into several groups, including FW at retailing stores, at home, at restaurants, and at canteens in companies or institutions, among which plate waste at school canteens should be paid more attention. Because plate waste at school canteens, especially at college and university canteens, is one of the most important sources of FW at the consumption stage (Derqui et al., 2018; Liu et al., 2016; Thyberg and Tonjes, 2016). The previous studies showed that plate waste at school canteens was 60–100 g per capital per meal, and could cause total emission of 227.6 t CO2-eq and 10.7 hm2 land use in vain per meal at city level (Derqui et al., 2018; Qian et al., 2021; Wu et al., 2019).
Furthermore, college life of students can almost determine their diet habits in the future (Lagorio et al., 2018; Pinto et al., 2018). Therefore, it is necessary for college students to spontaneously reduce FW at school canteens. By now, there are only a few recent empirical studies conducted at colleges or universities (Derqui et al., 2018; García-Herrero et al., 2019; Wu et al., 2019). More field surveys to quantitatively estimate the degree of FW at university dining halls are highly warranted.
Besides the estimation of FW, to accomplish the ultimate mission of FW reduction at canteens with more effective and accurate interventions, the key determinants of FW need to be identified. Although numerous potential drivers of FW have been identified by previous studies, including consumer's and manager's understandings on FW (Derqui et al., 2018; Tsai et al., 2020), food quality and quantity (Heikkilä et al., 2016; Wen et al., 2015; Wu et al., 2019), running efficiency of the food supply system at canteens (Derqui et al., 2018; Gao et al., 2021), educational interventions targeting on improving consumer's awareness of FW have still been considered as an effective solution in public dining areas by now (Rethink Food Waste through Economics and Data [ReFED], 2016), for example, the “Clean Plate Campaign.”
Nonetheless, only soft interventions for FW reduction may not be sufficient because educational campaign becomes less effective over time (Ellison et al., 2019). Recently, serving portion is becoming another essential factor contributing significantly to FW reduction at canteens except for food quality (Niu et al., 2022; Wu et al., 2019). Smaller serving portion along with an intelligent system can bring better sale and less FW for canteens' management. A good example can be found in Hangzhou, China, where 5G technology, database backstage, and automatic assembly lines are efficiently integrated to cooking food and thus lead to less FW (Jinbw News, 2020). However, the invisibility of the food-saving effect may weaken its value of application for investors, canteen managers, and consumers (Boschini et al., 2017; Hanson et al., 2016), which need to be further improved.
In this study, we originally designed a mini-grid plate coupled with an intelligent food supply system, and tried to testify its potential to FW reduction through ecological footprints and eco-environmental loads. This study aimed to promote the visibility of the effectiveness and significance of such a new intervention for investors, consumers, and canteen managers, which might contribute to taking this design as a promising FW solution for campus greening and food security.
Materials and Methods
Data collection
This study was conducted at canteens at a university in October 2021, which is located in Haidian District, Beijing, China. It is divided into eastern and western campuses, containing 18 colleges with 13,483 undergraduates, 11,309 full-time graduate students, and 3032 teachers and staffs. There are six canteens in the eastern campus and five canteens in the western campus, and all of which are outsourced. The food service center of the Logistics Support Department is responsible for the supervision of the procurement, storage, cooking, and service of these canteens.
Herein, FW refers to the waste that can be avoided at the food consumption stage, that is, the FW that was generated due to the unreasonable consumption purpose, behavior, and the lack of subjective consciousness (Zhang et al., 2016b). To collect the primary data of FW mass, we launched a volunteering campaign within the university. Basic information about participants was collected by questionnaires, including gender and grade. Participants were asked to take pictures of the rest of the plate food after having a meal.
Owing to the coronavirus disease 2019 (COVID-2019) pandemic, the sampling was constrained in only one sampling university. However, to account for the sampling bias as much as possible, we considered the total 11 canteens and carefully chose the method of data collection. We used a semiquantitative method to visually measured the FW weight, similar to that successfully tested in previous studies quantifying the relative proportions of remaining food (Saccares et al., 2014; Scognamiglio et al., 2012). According to the characteristics of the canteen plate, we divided the plate into six or eight small grids of the same size, and used direct weighting method to measure the weight of different kinds of FW in a small grid as a unit mass.
We then visually estimated the number of grids occupied by the remaining food (i.e., how many units of wasting food), and calculated the weight of the FW by multiplying the unit mass with the number of grid units. Food categories only refer to those listed in the canteen windows, including rice, wheat flour, other grains, vegetables, nuts, bean products, pork, beef, poultry, fish, and eggs, and excluding soup and cooking oil (Zhang et al., 2016a; Zhang et al., 2016b).
Data processing
We made preliminary calculations and preprocessing of the data obtained from the volunteering campaign and the questionnaire survey. We excluded breakfast because quite a few students skip breakfast. Therefore, we counted each college student or teacher 14 meals a week (7 days × 2 meals = 14 meals/week). According to the data from China Statistical Yearbook (2017), there are 1,094,700 college students in Beijing, excluding undergraduates who study online. Based on this and the assumption of 260 days per academic year, we extrapolated the amount of FW on a larger spatial and temporal scale of 1 year in Beijing City. In addition, we assume that on average college students have two takeaway meals a week (Wu et al., 2019), so the weight of FW should be multiplied with a coefficient of 6/7 to correct the amount of FW at university canteens. After obtaining the data of FW mass, we then calculated various ecological footprints as follows (see details in the Supplementary Materials and Methods).
Land footprints
As an analysis model of ecological economics, land footprint (LF) is an account tool to calculate the biological productive land area consumed by the population or activities in a given region (Rees and Wackernagel, 1996; Wu et al., 2011; Zhang et al., 2016a). In this study, LF refers to the biological productive land area used in vain due to FW at university canteens. The calculation formulas are as follows (Feng and Zhao, 2020):
where Ci : per capita consumption of item i (kg per person); Yi: total annual production of item i (kg); Oi: annual export volume of item i (kg); N: total population (person); Ai: actual ecological productive land area per capita occupied by consumption item i of production (hm2 per person); Pi: average annual productivity of consumption item i of ecological productive land production (kg/hm2); γ
i
: equivalence factors, making different types of ecological productive land into equivalent coefficient; gPi: average ecological productivity of the global category i of ecologically productive land;
As one of basic items of footprint calculation, the average yield of major food sources can be easily acquired from the local statistical yearbook or relevant literature. In this study, we chose the equilibrium factor and the average yield of major food sources in Beijing as the calculation basis of LF of FW (Wu et al., 2011; Zhang et al., 2016a).
Carbon footprint
Carbon footprint (CF) is an index derived from ecological footprint, which is used to measure the greenhouse gas emission load caused by production activities (Scholz et al., 2015). Herein, CF refers to the greenhouse gas emissions caused directly and indirectly by FW, in terms of equal carbon dioxide emission (CO2-eq).
In FW research, life cycle assessment (LCA) is widely used to evaluate the eco-environmental impact of the product from the acquisition of raw materials, products processing to the disposal. Owing to the inevitable energy and material dissipation in the process of obtaining raw food materials from agricultural products, we need to divide the initial weight of FW (FWinitial) by the coefficient of agricultural products (θ) to get the waste of real agricultural products. The CF of Beijing university canteen includes greenhouse gas emission caused by the unit weight of FW at the agricultural production (CFagicultural), processing (CFprocessing), distribution (CFdistribution), canteen consumption (CFconsumption), and disposal (CFdisposal) stage (Fig. 1). Relevant data in the article were also used as the calculation basis (Zhang et al., 2016b). Details regarding calculating methods can be found in Supplementary Materials and Methods.
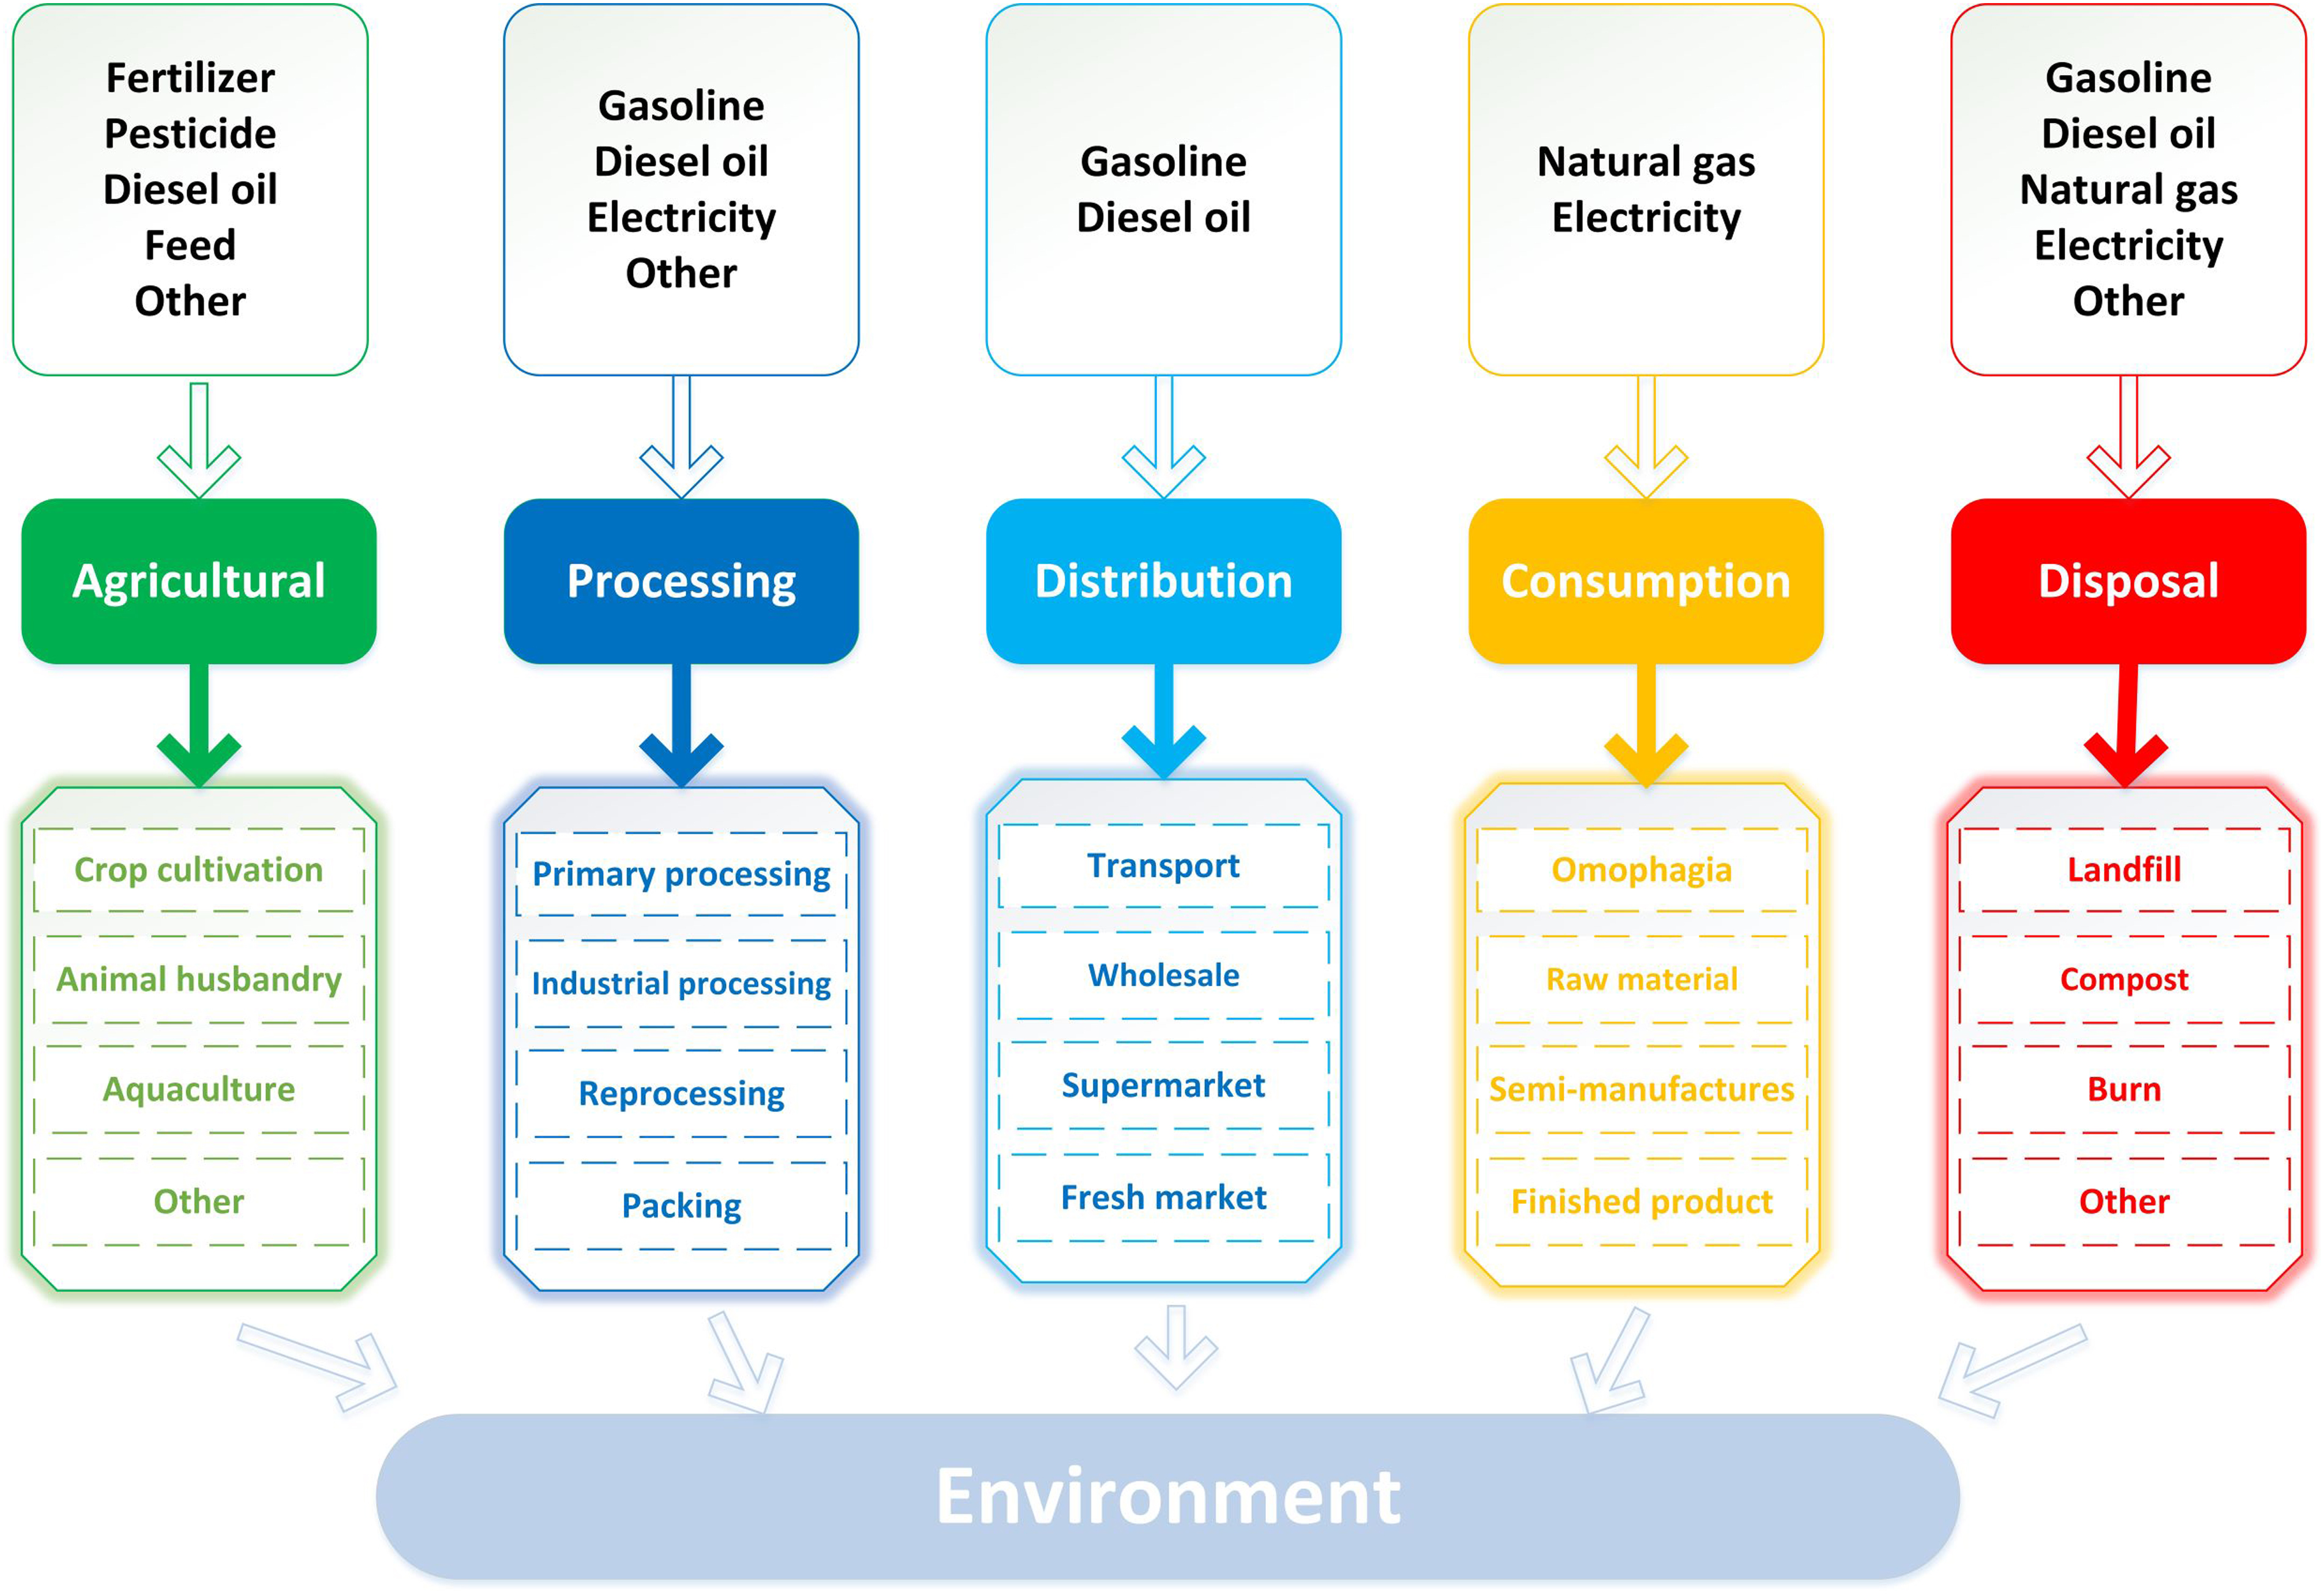
Schematic diagram of carbon emissions in LCA processes. LCA, life cycle assessment.
Nitrogen footprint
Nitrogen footprint (NF) is generally defined as the total amount of reactive nitrogen emitted into the environment caused by the consumption of resources (Galloway et al., 2014). It is an excellent tool for measuring the flow of nitrogen, including industry and agriculture, transportation, and food processing (Mohanty et al., 2020). In this study, we defined NF as N input per unit weight of FW, plus N contained in FW, and additional N emissions from the production of wasted foods. Also based on LCA, the NF of FW was divided into five stages: fertilizer production (NFfertilizer), agricultural production (NFagicultural), processing (NFprocessing), food consumption and disposal (NFdisposal). The food consumption was incorporated to the disposal stage because no nitrogen emission was involved. Relevant data in the previous studies were also used as the calculation basis (Zhang et al., 2017). Details about calculating methods can be found in Supplementary Materials and Methods.
Water footprint
Water footprint (WF) refers to the impact or pressure caused by the consumption of resources on the environment and water resources (Hoekstra, 2015). We chose the calculation method of virtual WF here (Lu et al., 2015). Agricultural consumption, output, and evapotranspiration are included to calculate green WF (WFgreen) and blue WF (WFblue). Data of pollutant permeability and usage amount is collected for calculating gray WF (WFgray). Finally, green water, blue water, and gray WF were combined to obtain the total WF (Wu et al., 2011). Details about calculating methods can be found in Supplementary Materials and Methods.
Mini-grid plate and food supply system design
We designed a mini-grid plate coupled with the intelligent food supply system, attempting to reduce FW at university canteens by decreasing portioning size and automatically food supplying. Referring to the original size of plates and Dietary Guidelines for Chinese Residents (2016), we reduced the size of the plate grids to ensure it can meet the needs of customers to try a variety of dishes and the recommended daily nutrition intake. To avoid the long queues at the canteen windows, we designed a set of assembly line of food supply system to match the plate. Customers order meals through the mobile phone client and the assembly line intelligent catering. All of these conceptual frameworks were interpreted with the drawing software of Visio 2013 and the modeling software of AutoCAD 2018 and Sketch Up 2019.
Questionnaire survey and the calculation of FW reduction
To investigate the willingness of college students and teachers to use the mini-grid plate coupled with the intelligent food supply system and its expected food-saving potential, we made an online questionnaire for investigation, which was also a mitigating measure for the data collection constrained by the COVID-2019 pandemic (see details in Supplementary Questionnaire). The questionnaire is mainly for college students and teachers in Beijing (i.e., not only for the sampling university although with a major proportion of 230/326). We set up questions to investigate their food surplus and possible reason at canteens, and then we described the mini-grid plate coupled with the intelligent system to investigate their willingness and the subjective food-saving potential of the mini-grid plate. In some questions, each option has a certain value to facilitate the calculation of food-saving potential. There are no ethical issues involved in this research. All campaigns were with the permission of relevant departments.
Results
FW and its ecological footprints quantification
According to the 1143 valid observations collected from the campaign, the total FW mass of college canteens in Beijing is about 3.6 × 10⁴ t per year, where vegetables and rice accounted for the most part of 44.34% and 33.88%, respectively (Fig. 2a).

FW and footprint composition (%).
The total CF per year caused by FW at Beijing university canteens is 7.61 × 10⁴ t CO2-eq (Fig. 2b), and the total NF is about 4.9 × 10³ t N (Fig. 2c). The total amount of WF, which is shown as wasted virtual water, can reach 3.20 × 10⁷ t (Fig. 2d) and the total LF is 8.7 × 10³ hm2 (Fig. 2e). Vegetables, as the largest part of FW, account for <10% of WF and LF, whereas bean products with a small amount of FW account for a large proportion of NF and LF (Fig. 2). Regarding the stages of the food supply chain, CF is largest at the consumption stage, mainly from rice and vegetables, and least at the processing stage (Fig. 3a). This is significantly different from NF composition, where N loss in the agricultural production stage is the largest (Fig. 3b).
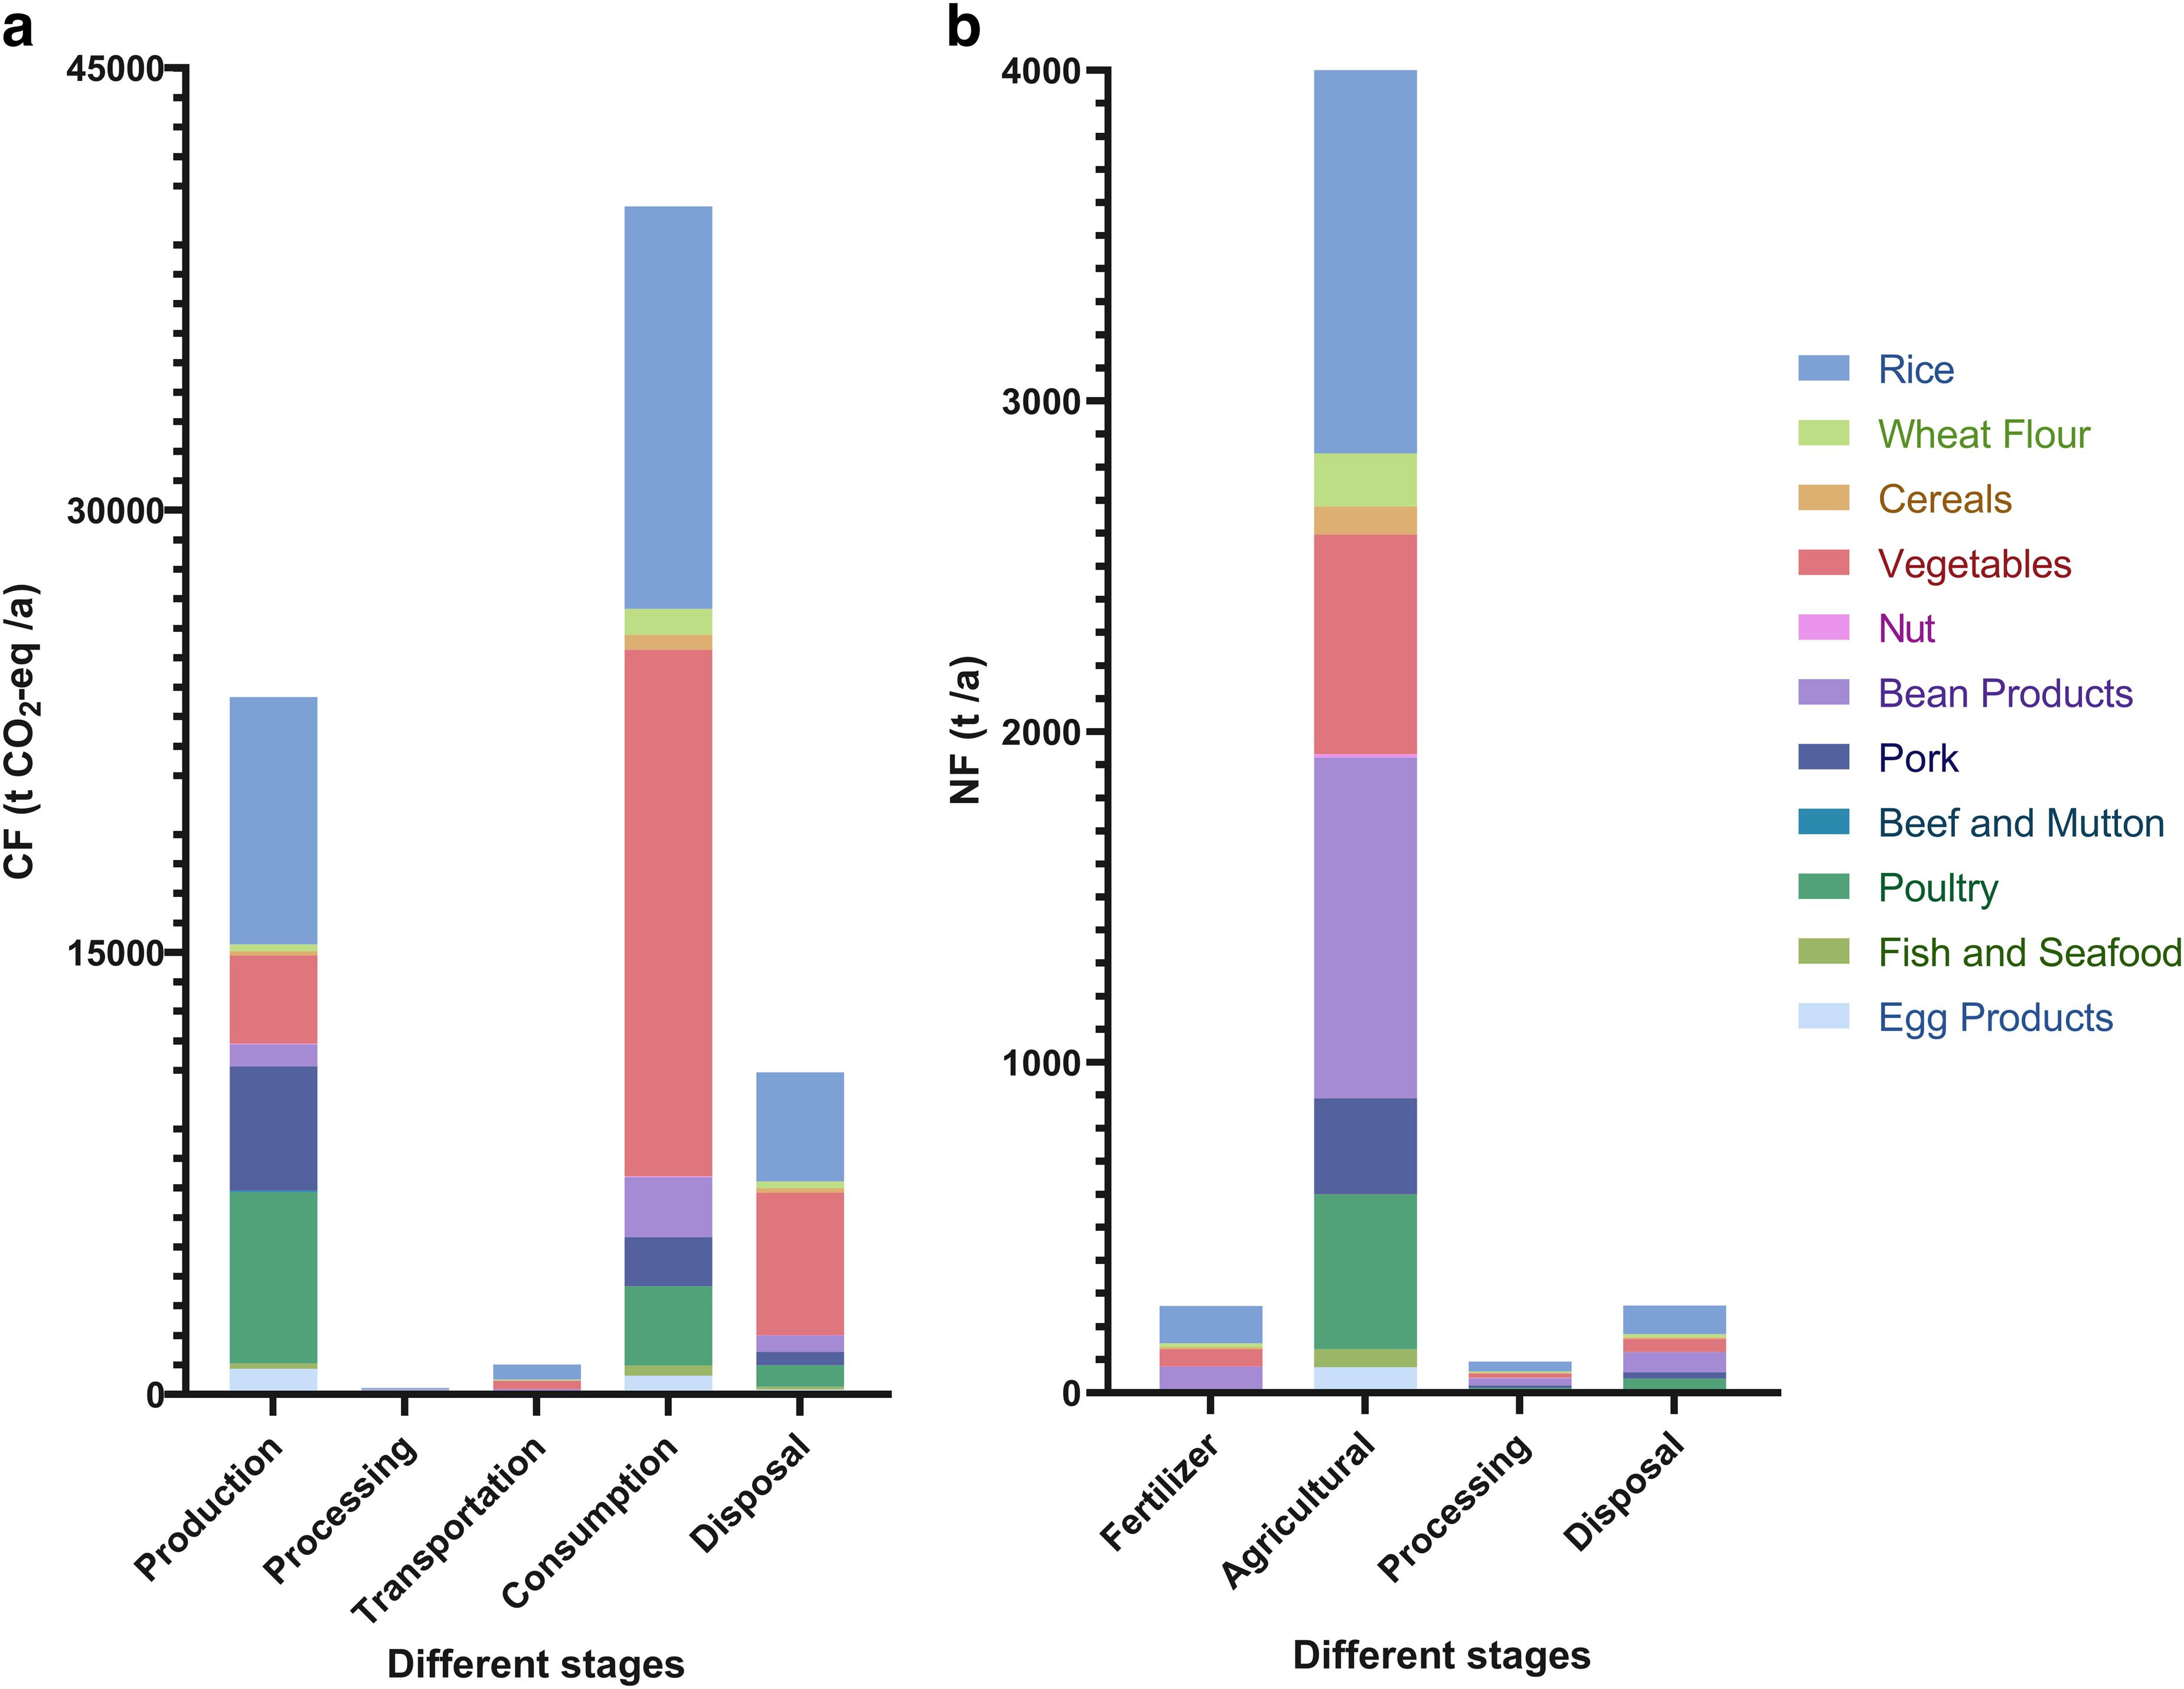
Footprint at each stage of the supply chain per year.
Mini-grid plate and intelligent supply system
The mini-grid plate we designed has the following characteristics: (1) only half of the original portion can be served in each dish (except for staple food), and the number of the dishes allowed on the plate has been changed from three to six, so that users can freely choose the variety and quantity of dishes when they order (Fig. 4a); (2) there are three colors of dishes (except for staple food) used as a reminder of balanced nutrition: the red ones are used for meat dishes; the green ones are used for vegetable dishes; and the blue ones are used for egg, milk, or soup (Fig. 4a); (3) users can freely choose staple food with appropriate portions, and the intelligent supply system is less likely to excess supply than the manual one (Fig. 4a); (4) the plate below is separated from the dishes above, and the groove of the plate makes the bottom of the dishes fixed on the plate, which is convenient to separate the plate and the dishes after meals for cleaning (Fig. 4b).
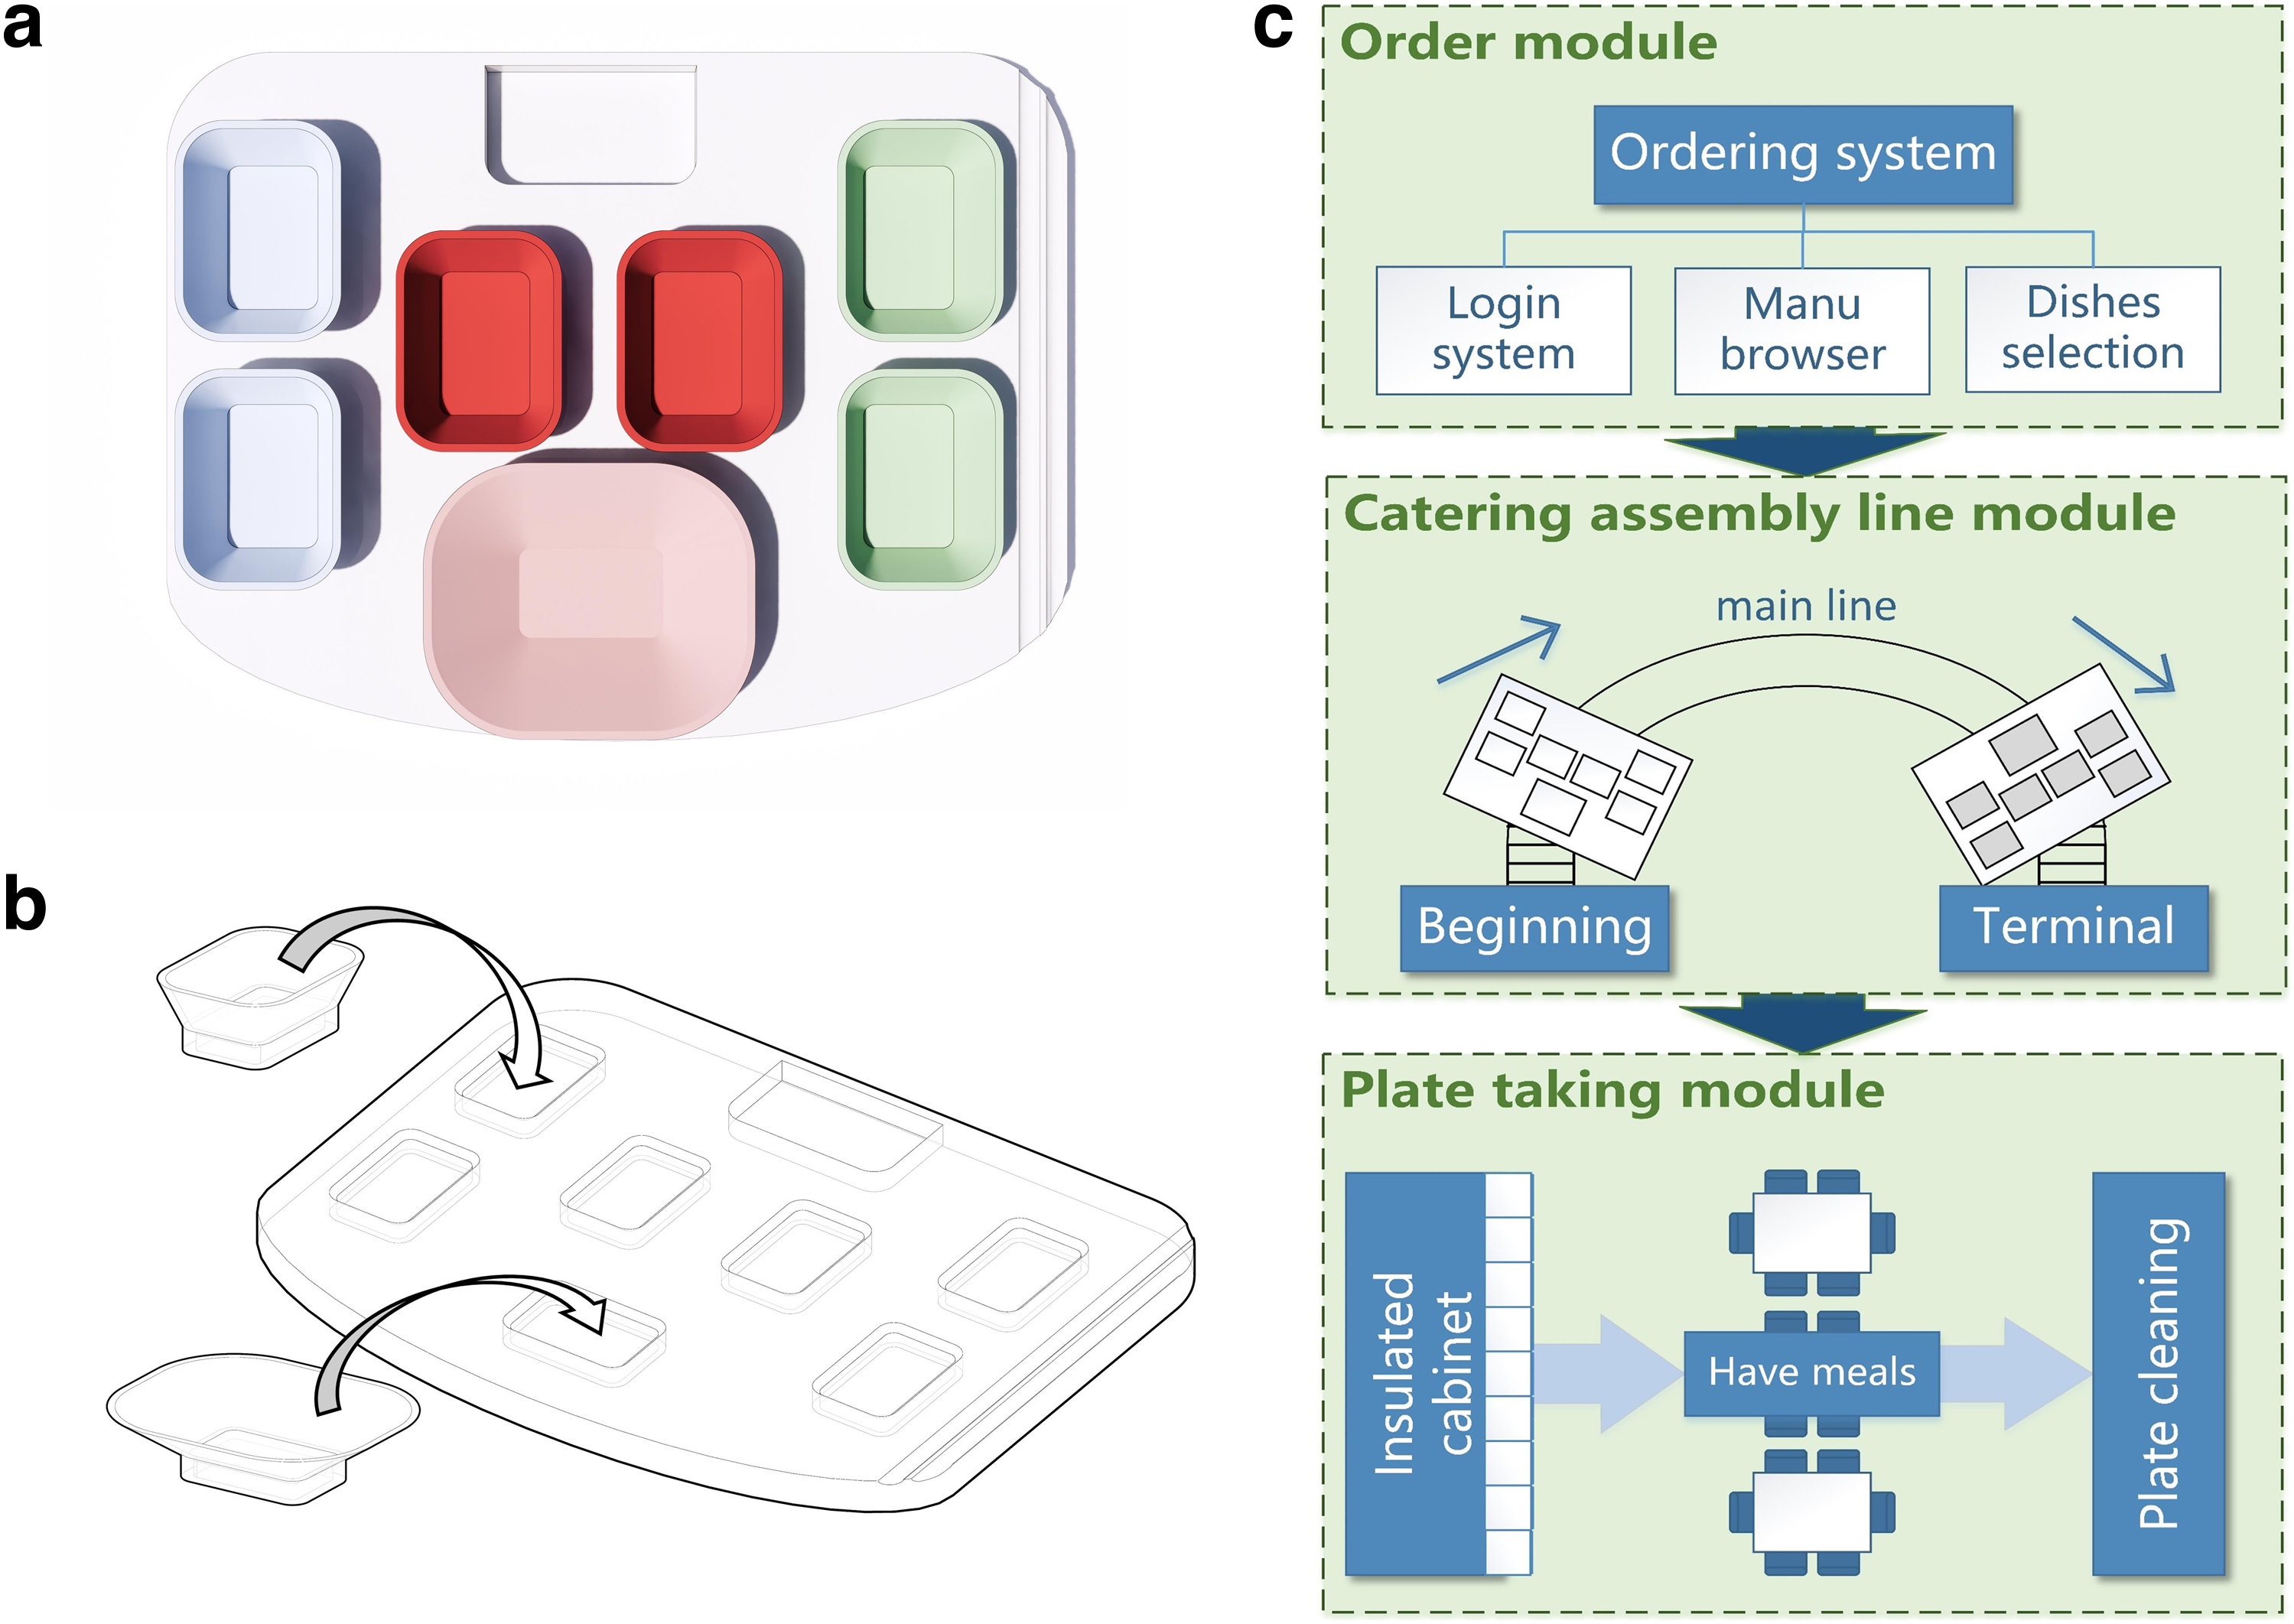
The mini-grid plate with the intelligent supply system.
Furthermore, we constructed a conceptual framework of an integrated catering system, which was based on big data interaction system and intelligent assembly line. It is mainly composed of three modules: order module, catering assembly line module, and plate packing module (Fig. 4c). Details on how the coupled system runs with the mini-grid plate can be found in Supplement Material and Methods.
Subjective evaluation of FW and consumers' attitudes toward FW and our design
We received 326 valid questionnaires in total, 230 of which were from the sample university we collected the weighting data. We first asked the respondents to evaluate their levels of FW, and the results were as follows. Veggies were the most seriously wasted food, which was consistent with our FW results mentioned earlier. On the average, each person wasted 26.61% of the total amount of vegetables on their plate. Although “the dishes are too large” came with the second highest score when respondents ranked the drivers for FW, >60% of people considered large portions as a key factor to FW.
Most of respondents showed their willingness to use our design, whereas some respondents raised more concerns on the taste of dishes, the pricing of small portions and the food insulation than the design itself. By weighting the level of willingness, we found that 63.50% of respondents were willing to use this mini-grid plate with intelligent system for the long term. Those who did not want to use it mainly worried about the feasibility of using an intelligent system at school canteens or preferred to choose dishes on site.
Ecological food-saving potential
Based on our survey, using the mini-grid plate coupled with an intelligent supply system at university canteens in Beijing can reduce the waste of all kinds of food by 32.42%, which means this design can reduce 6.66 kt of FW, 24.69 kt of CO2-eq emission, 1.60 kt of nitrogen loss, 10.36 Mt of water wasted, and 2815.6 hm2 of land use per year at city level (Fig. 2).
From the perspective of ecological footprints caused by various food categories, we found that (1) rice contributes the most to CF; (2) the contribution of vegetables to NF was lower than that of bean products, and rice was still the biggest contributor to NF; (3) pork contributed more to WF than rice, but vegetable contributed less to WF; (4) rice contributed the most to LF, followed by bean products, poultry, and vegetables (Fig. 5a).

Ecological food-saving effect scenarios.
At most stages of CF, rice and vegetables had a large food-saving effect (>25%). Bean products contributed 73% to the reduction of CO2-eq in the processing stage (Fig. 5b). However, as the processing stage had the least CO2-eq, bean products did not significantly reduce the total amount of CF (Fig. 5b). Poultry and pork had a larger contribution of CF reduction than FW mass reduction, especially at the production stage (Fig. 5b).
The proportion of NF reduction was the largest in rice, followed by bean products and vegetables (Fig. 5c). In the fertilization stage, the contribution of rice and bean products to the reduction reached 72% (Fig. 5c). There was little difference in the proportion of contributions of the same food category at different stages of NF (except for meat products that do not require fertilizer). Note that bean products, whose weight reduction was small, contributed more to reducing nitrogen loss than other food categories.
Discussion
The pattern of FW and consumer attitudes toward it at university canteens
The composition of FW mass in this study was in line with that of previous studies, where staple food and vegetables accounted for a major portion (Qian et al., 2021; Song et al., 2015). This reminded canteen managers at universities to pay more attention to reducing FW of staple food and vegetables. Compared with the estimation of 61.03 g per meal by Qian et al. (2019) on FW at university canteens, the FW estimation of 42.3 g per meal in this study was much lower. This may be related to the educational posters and slogans at university canteens and the high awareness of resource saving and recycling of students at agricultural universities (Zhang et al., 2020), indicating the effectiveness of awareness campaigns.
Although this low FW mass observation, the ecological footprints generated by FW in this case still need to be paid more attention. For instance, the estimated LF was much higher than that in another Beijing study and accounted for almost 20% of total FW derived LF at the consumer stage (Wang et al., 2021; Wu et al., 2019), which may be ascribed to more FW on staple food contributing to more agricultural land use. This more serious eco-environmental load of the unit mass of FW may be ascribed to a rapid growth of GDP per capital in China (Zhang et al., 2020), indicating the coherently severe FW situation stimulated by increasing economics within higher education field in China.
As to the composition of estimated ecological footprints, there existed some discrepancies among them, which may be related to the characteristics of different types of food in their practical production and consumption (Zhang et al., 2017; Zhang et al., 2016a; Zhang et al., 2016b). For instance, staple food including the rice and wheat flour, with a major proportion in the total FW mass, contributed the most to CF whereas it contributed less to NF and WF.
In contrast, meat and beans, with a minor proportion of FW, contributed the most to NF because of more nitrogen usage in the entire chain of meat and beans production, such as more ammonia emission during livestock breeding and additional nitrogen fixation during bean growth (Zhang et al., 2017). Furthermore, CF and NF of food had different performances in different stages of food life cycle. The consumption stage contributed the most to CF, whereas the agricultural production stage contributed the most to NF. This was slightly different from previous studies conducted at restaurants (Zhang et al., 2017; Zhang et al., 2016b), which needed to be further explored in future.
The questionnaire survey provided some valuable information about consumers' attitudes toward FW at university canteens. First, concerning the subjective evaluation of FW of all participants, wastage was prevailing among all food types and happened to more than a half of participants, implying the insufficiency of only educational campaigns and the large space for applications of other new interventions. Second, in line with most previous studies (Derqui et al., 2018; Wu et al., 2019), food taste was considered as the most significant drivers of FW. This may explain why vegetables and rice were wasted the most, especially at university canteens where food was generally cooked with large amounts.
This was also consistent with some respondents' comments complaining about the taste, for example, “Sometimes I cannot finish them, just because the food is becoming more and more unpalatable.” Moreover, serving portion was considered as the second most significant drivers for FW, which supported that our redesign of dish size makes sense. Several comments proposed by the respondents pointed out their concerns on future application of the mini-grid plate with intelligent system, such as the ability to choose a wider variety of dishes and the alleviation of the phenomenon of queuing for meals and so on.
Application potential of the design of mini-grid plate and coupled system
Our study exhibited the huge potential of FW reduction with applying the mini-grid plate coupled with the intelligent system, that is, 32.4% decrease of FW, and thus a significantly effective intervention for mitigating the substantial eco-environmental load caused by FW. The estimated FW reduction was much higher than that of some old interventions such as educational campaigns (3.9%) (Ellison et al., 2019), demonstrating that the reducing serving portions and reconstructing systems have more room for improving FW reduction than only using old interventions. Furthermore, the decrease of ecological footprints was comparable with the scenario of FW reduction conducted by Xue et al. (2021) at country level, providing a visible ecological food-saving potential of our design.
Intriguingly, regarding the various food types with different FW reduction potential (Fig. 5), this study was on par with many previous studies reporting the dominant role of these food types in ecological footprints generation (Zhang et al., 2017; Zhang et al., 2016a; Zhang et al., 2016b). Rice, vegetables, bean products, and some meats (pork or poultry) had relatively high FW reduction potential (>20%), which should be paid more attention to design their portion sizes and food transportation efficiency. Our findings affirmed the great potential of reducing FW by the mini-grid plate and coupled system, especially with rice, vegetables, and bean products, which should have a wide application field in not only restaurants, but also other places providing public foods.
The most creative point of our design was that we focused on the neglected FW drivers, serving portions and low efficiency of the system, and correspondingly proposed the intervention targeting precisely at them (Gao et al., 2021; Heikkilä et al., 2016; Wen et al., 2015). Despite the possibly high cost of our intervention, the application of mini-grid plate and coupled system can increase the visibility of canteen managers' effort in FW reduction, which was observed as a critical factor influencing FW (Derqui et al., 2018). Several studies have supported the idea of our design. For instance, Visschers et al. (2020) found that applying reducing serving portions along with information provision can significantly reduce FW at canteens, whereas only information provision did not exhibit significant effect.
A critical review proposed by Spang et al. (2019) argued that to reduce FW, a more systematic view of reducing interventions is highly warranted. There is a precedent applied in the catering services: a whole artificially intelligent system equipped with high technologies such as 5G and assembly lines has been already in running in Hangzhou, China (Jinbw News, 2020). This means it is affordable for some local companies or governments to have a practical trial, and our research provided attractive theoretical advantage of this design to be generalized for those decision makers.
Implications and limitations
This study evaluated the ecological food-saving potential of a new intervention, the mini-grid plate coupled with an intelligent food supply system. This would greatly increase the visibility of effectiveness of such new interventions that has huger potential to FW reduction, particularly at university canteens. Since the invisibility of the food-saving effect may be a major barrier for new interventions to be put into food production and supply, this study would make a significant step for their application as it exhibited a great amount of ecological footprints that can be reduced by the mini-grid plate and coupled system.
Although with enlightening implications, this study has some limitations needed to be addressed. First, data of FW at canteens were obtained mainly by visual inspection, which was a relatively less stable and reliable method than totally direct weighting. Nonetheless, the large size of data set (>1000 observations) may, to some degree, offset this inaccuracy. Moreover, the successful test of this semiquantitative method in previous studies made us believe this technique was sufficient to reflect the degree of FW. Second, the ecological food-saving potential was evaluated by the data and information from questionnaire survey, which may be too subjective to be generalized to other situations.
On the one hand, due to the COVID-2019 pandemic, our sample was less representative for canteens locating at only one university, and the COVID-2019 pandemic may reduce the FW due to increased consciousness (Liang et al., 2021; Sharma et al., 2020). On the other hand, it can also lead to increment of FW due to impaired food supply and storage system (Aldaco et al., 2020; Sharma et al., 2020). However, our robust data analysis could reflect at least some effectiveness of waste management and provide support for our conclusion, which may be even underestimated in that specific background (higher education).
Third, the new design in first-stage practices may need more running cost, especially when it is applied on small scales. Fourth, the uneven distribution of the surveyed students and online respondents may lead to some potential bias in the estimation of FW. For example, more female proportion may lead to the gender bias. Last but not least, we did not conduct practical trials with control canteens due to COVID-2019 pandemic, which may be a big limitation for our design to be generalized. Further studies may concentrate on control and treatment experiments with realistic interventions.
Conclusion
To reduce FW effectively, we designed a mini-grid plate coupled with the intelligent food supply system and examined its food-saving potential based on ecological footprint models. The findings indicated that new interventions, such as reducing serving portions and reconstructing food supply system, have a huge potential to FW reduction and mitigating its derived eco-environmental loads, especially for some food types such as rice, vegetables, and bean products. This study significantly increased the visibility of the ecological food-saving potential of a new intervention rather than soft persuasion, promoting a substantial step toward the generalization and the acceptance among canteen managers, consumers, and investors. Thus, we suggest that new interventions for FW reduction should be put into practices along with educational campaigns, which could significantly contribute to both campus greening and sustainability relevant to food security.
Footnotes
Acknowledgments
The authors are grateful to all participants in campaigns and online questionnaires.
Author Disclosure Statement
No competing financial interests exist.
Funding Information
This research was financially supported by Beijing University Students Innovation Training Project with Grant No. S202110019047.
References
Supplementary Material
Please find the following supplemental material available below.
For Open Access articles published under a Creative Commons License, all supplemental material carries the same license as the article it is associated with.
For non-Open Access articles published, all supplemental material carries a non-exclusive license, and permission requests for re-use of supplemental material or any part of supplemental material shall be sent directly to the copyright owner as specified in the copyright notice associated with the article.