
Abstract
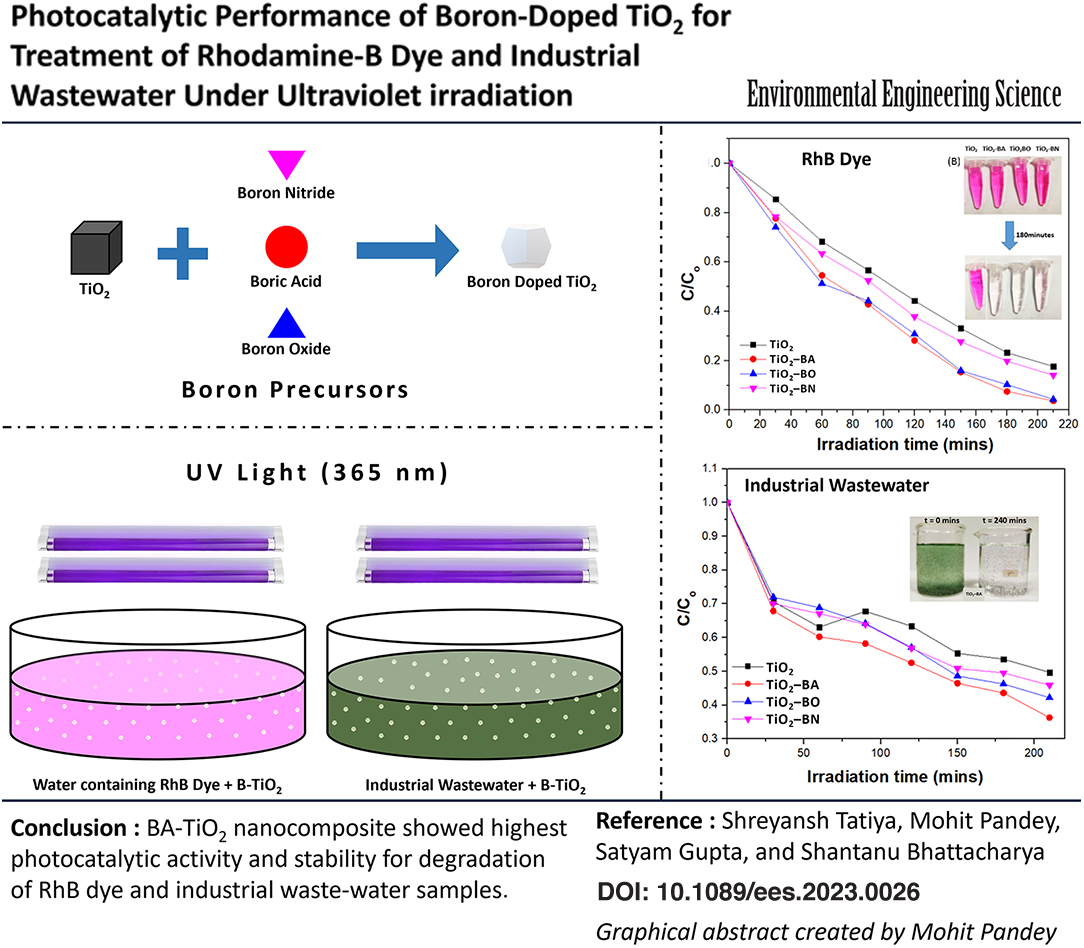
The organic dyes that have been added to water by various industrial effluents possess a serious threat to the environment due to their mutagenic character. TiO2 has been widely employed as a photocatalysis for the degradation of these dyes. However, a non-metal doped TiO2 can be a promising candidate for the advanced treatment of industrial wastewater containing organic dyes. In this work, we have prepared and tested different boron-doped TiO2 photocatalysts to examine the effect of boron addition on the photocatalytic activity of TiO2. The various boron precursors used are boric acid (BA), boron oxide (BO), and boron nitride (BN), through which Boron is formulated and is doped through a single-step sol-gel method. The prepared nanocomposites are characterized using various characterization techniques, such as Field Emission Scanning Electron Microscopy (FESEM), Transmission electron microscopy (TEM), ultraviolet-visible (UV-Vis) and Raman spectroscopy, X-ray diffraction (XRD), Fourier Transform Infrared (FTIR) spectroscopy, photoluminescence, and X-ray Photoelectron Spectroscopy (XPS) analysis. UV light of wavelength 365 nm has been used for studying the photocatalyst behavior. Both rhodamine-B (RhB) and industrial wastewater samples have been studied for degradation kinetics. The boron-doped TiO2 nanocomposites show a high level of dye degradation (>95%) with RhB dye and (>63%) with industrial wastewater samples. Further, TiO2-BA composites in both the cases showed maximum dye degradation compared with other boron nanocomposites with an enhancement in the efficiency of (>13%) over a pure phase of TiO2.
Introduction
Photocatalysis is a well-established technology that is facilitated in the harvesting of optical energy (majorly in the ultraviolet [UV] and visible spectra) of the sun by the use of semiconductor materials that leads to the subsequent conversion of optical energy into an increase in free charges and radicals that results in the breakdown of complex dye molecules) (Gao et al., 2022; In et al., 2007; Liu et al., 2022; Liu et al., 2017b). In the past 10 years, TiO2 has been the semiconductor material that has been employed for photocatalysis the most frequently.
This is caused by factors such as its strong oxidative capacity, low overall cost, photostability, simplicity of preparation over a broad pH and voltage range, etc. Due to their mutagenic character, the organic dyes that have been added to the water by various industrial effluents have posed a serious threat to aquatic life and the entire environment (Chowdhary et al., 2018; Hong et al., 2020).
Photocatalysis has been qualified as the most viable alternative compared with other conventional dye removal techniques in industrial wastewater (Cheng et al., 2022; Koysuren and Koysuren, 2020; Li et al., 2022b) due to its low cost of treatment, ecofriendly nature, and easy recyclability (Jain et al., 2017). Rhodamine-B (RhB) dye, which is used in this work for validating the effect of the catalyst, is an alkaline cationic dye that is highly toxic, leading to high chances in exposed subjects of visceral diseases, red skin staining, and many more. (Alcocer et al., 2018; Guo et al., 2020; Magdalane et al., 2019; Tian et al., 2018).
Effective RhB removal is also essential, as its degradation is difficult in natural conditions (Niu et al., 2020). Further, due to the complex and variety of dyes used in the dyeing and printing of textiles, effluent treatment and decoloration becomes further challenging.
Due to its wide band gap (i.e., 3.2 eV) and poor electron release, pure TiO2 is unable to absorb and utilize visible light effectively (i.e., the compound can only use up to 5% of the total solar energy in the UV range) (Feng et al., 2016; Mulmi et al., 2016; Saidi et al., 2016). The photocatalytic capabilities of TiO2 have occasionally been improved by the application of numerous dopants, including nickel, copper, gold, iron, and silver (Hinojosa-Reyes et al., 2019; Koysuren and Koysuren, 2020; Li et al., 2019; Sharma and Lee, 2017).
As an alternative, it has been discovered that non-metallic components, such as carbon, nitrogen, sulfur, and boron, increase the photocatalytic activity of TiO2 too (Li et al., 2022a; Li et al., 2020; Mei et al., 2021; Wang et al., 2022a; Wang et al., 2022b). Among them, boron is preferred as it is a non-toxic, biocompatible, and a good electron acceptor (Andrade Neto et al., 2019; Hoşgün and Aydın, 2019; Tatiya et al., 2020).
Synthesis of nanomaterials has been carried out with various techniques such as micro-electromechanical systems (MEMS)-based, hydrothermal-based, microemulsion, laser-based, template, biological synthesis, etc. (Chauhan et al., 2022; Chauhan et al., 2019b; Chauhan et al., 2017; Gupta and Bhattacharya, 2018; Gupta et al., 2021). Nanomaterials synthesized by these processes have applications in various industries such as health care, biomedical, energy storage (Dubey et al., 2018; Jangir et al., 2018; Yang et al., 2022), electronics (Wang et al., 2023), sensors, etc.
These nanoparticles are combined with commercial materials via surface/bulk modifications using advanced manufacturing techniques such as plasma processing, laser treatment, thin film deposition, additive manufacturing, etc. (Choudhury et al., 2021; Kumar et al., 2019; Pandey et al., 2022; Pandey et al., 2021a; Pandey et al., 2021b; Sundriyal et al., 2020) to design and develop a variety of MEMS-based sensors.
Sensors fabricated with this amalgamation of nanotechnology and MEMS technology are smartly used in automobile and aerospace industries for manufacturing and vehicle health tracking (Basu et al., 2019a; Basu et al., 2019b; Bhattacharya et al., 2019; Pandey et al., 2019c; Pandey et al., 2019d; Tatiya et al., 2019), health care diagnostics (Pandey et al., 2019a; Pandey et al., 2019b; Saini et al., 2017; Sharma et al., 2018), environmental monitoring (Chauhan et al., 2019a), etc.
The sol-gel method, however, is widely accepted due to its high yield, low cost, and mild operating conditions (Sun et al., 2022). In addition, it has been shown in numerous studies that the sol-gel process involving TiO2 doped with 5–7% boron and further calcined at temperatures of more than 500°C is the most effective process for rapid degradation of dyes (Chen et al., 2006; Mulmi et al., 2016; Yadav et al., 2020). In this study, we have used the same method and doping concentration for comparing and studying the effect of the most popular used boron precursors on photocatalytic activity of TiO2.
Jaipur is the capital city of western state of India, Rajasthan. Apart from the natural resources, it is famous for dyeing and printing on various fabrics, most famous being Sanganer and Bagru prints. The Sitapura industrial area is part of the 365 acres EPIP (Export Promotion Industrial Park) in Jaipur having industries, educational institutes, and corporate offices (Chouhan et al., 2017; Tiyasha et al., 2013).
Wastewater from industries, majorly textile, contributes to major water pollution when untreated effluent is discharged in water. Therefore, we have correlated the experimental photocatalytic data from these nanocomposites with the known mechanism of dye degradation by TiO2 and successfully degraded the industrial wastewater sample that was a complex mixture of various dyes from a textile industry at the Sitapura industrial area in Jaipur, India.
Materials and Methods
The analytical-grade chemicals and solvents that have been utilized have not undergone any additional purification. Reagents including titanium isopropoxide (TTIP, 99% purity; Sigma-Aldrich), commercial TiO2 (aeroxide P25, 99% purity; Degussa), etc. have been used for comparison and referred to as TiO2-C. Absolute ethanol and water (Merck), boron precursors Boron oxide (BO; B2O3), Boric acid (BA; H3BO3), and Boron nitride (BN; purchased in 99% purity grade; Loba Chemie), and RhB (C28H31ClN2O3) dye (purchased from S D Fine-Chem Limited) have been used in the experiments as the target dye molecule for photodegradation.
Characterization methods
To characterize the synthesis of Boron-TiO2 nanocomposites, techniques such as Field Emission Scanning Electron Microscopy (FESEM; Zeiss Supra 40V), Transmission electron microscopy (TEM; FEI-Tecnai G2 12 Twin 120 kV TEM), Photoluminescence (PL) spectroscopy (Horiba Scientific, Fluoromax 4, excitation wavelength 300 nm), Raman spectroscopy (Princeton Instruments Acton Spectra Pro 2500i), X-ray diffraction (XRD; PAN-analytical, wavelength: 1.542 Å, Cu), surface area and pore volumes (nitrogen adsorption–desorption isotherms, measured at 77 K using Quanta chrome Autosorb 1C system), Fourier Transform Infrared (FTIR) spectroscopy, and X-ray Photoelectron Spectroscopy (XPS; PHI 5000 Versa Probe II; FEI, Inc.), etc. have been used.
The absorbance spectra of Boron-TiO2 nanocomposites and their effect on RhB dye were analyzed using a UV-visible (UV-Vis) spectrophotometer (Thermo Scientific™ Evolution 300).
Photocatalytic activity
Various boron-doped titanium oxide nanocomposites were used as photocatalysts for the decoloration of RhB dye under UV light. An equal quantity (15 mg each) of the photocatalyst (preparation methodology followed mentioned in Section 1.1 in the Supplementary Data) in powder form is uniformly distributed in a 15 mL solution each of RhB dye (15 mg/L concentration) and wastewater sample in a petridish of dimensions 19 × 14 mm (Chauhan et al., 2022).
The resultant solution mix of dye and the catalyst was placed under UV light with a UV source (365 nm). A fixed amount of solution from these experiments was taken for UV-Vis spectrophotometer analysis at fixed time intervals and returned after its characterization. To compare and evaluate the degradation efficiency of doping of boron on TiO2, the dye degradation rate is studied through the following equation:
where D is the degradation rate, A0 is the absorbance at 0 min, and A is the absorbance at t min.
Results and Discussion
Analysis of morphology
FESEM and TEM (mentioned in Section 1.2 in the Supplementary Data) of undoped TiO2 and boron-doped TiO2 are shown in Fig. 1A–D. Nanoparticles of anatase (101) facets of TiO2 are observed in Fig. 1A. However, the doped TiO2 samples B and C clearly show uniform and better crystal geometry compared with samples A and D. This could be due to better incorporation of these dopants into interstitial sites, resulting in increased d-spacing and overall homogeneous crystallinity (explained later in XPS analysis).

FESEM of pure TiO2
The existence of elements and their relative weight percentages in the synthesized material were also confirmed using energy-dispersive X-ray spectroscopy (EDS). (For reference, see Fig. 1E, F, which displays EDS data for BA TiO2 and undoped TiO2.) The additional carbon (C) signal is a result of the scanning electron microscope examination being done on conducting tape that contains carbon.
Structural analysis
To assess the structural characteristics and crystalline TiO2 phase, XRD and Raman spectroscopy have been used (Fig. 2A, B). In XRD, a prominent peak at 2θ = 25° (101), attributed to anatase titanium oxide, is observed in all doped and undoped samples. Further, a sharp peak indicates good crystallinity of the prepared samples. A distinct peak is observed at 2θ = 26°, showing the presence of bulk BN, indicating that a graphite-like hBN structure is obtained (Fig. 2A, marked with a *) (Byrne et al., 2018; Deura et al., 2017).

XRD patterns
Raman spectroscopy is carried out with a 532 nm diode-pumped solid-state Laser (Laser Quantum gem 50 mW). For pure TiO2, a characteristic major peak at 144.6 cm−1 has been observed that is attributed to “Eg” mode of anatase (Kafizas and Parkin, 2012; Quesada-González et al., 2017). When doped with boron compound, this scattering “Eg” band shifts to higher wavenumbers. Doping with BA and BO has shown a similar but overall higher shift in wavenumber (Δƛ = 147.7 cm−1) compared with BN doping (Δƛ = 146.6 cm−1) (Fig. 3B).
PL spectra
This shifting of “Eg” toward the blue wavelength has been reported previously when TiO2 had been doped with boron. This is attributed to a change in the vibration mode of pure TiO2 that may be due to stress induced on occupation of interstitial sites by boron (Feng et al., 2016; Quesada-González et al., 2017; Yadav et al., 2020). The two studies cited earlier have confirmed the presence of sole anatase TiO2 phase when calcined at 500°C in both undoped and boron-doped TiO2 nanocomposite samples, as reported in previous literature (Byrne et al., 2019; Mulmi et al., 2016; Niu et al., 2020).
The recorded N2 adsorption-desorption isotherm and pore size distribution of undoped and doped TiO2 is shown in Fig. 2C and D, respectively. Both undoped TiO2 and boron-doped TiO2 synthesized catalysts showed type IV isotherms with H1 shape hysteresis loop, which are characteristic of cylindrical and parallel pores (Ramírez-Quintanilla et al., 2023; Yadav et al., 2020). Moreover, it is known that with larger surface area a semiconductor has a better efficiency in pollutant adsorption, thus improving its overall capacity (Ramírez-Quintanilla et al., 2023). Figure 2D reveals that the pore size varied between 3 and 30 nm, which corresponds to the presence of mesopores.
PL spectroscopy
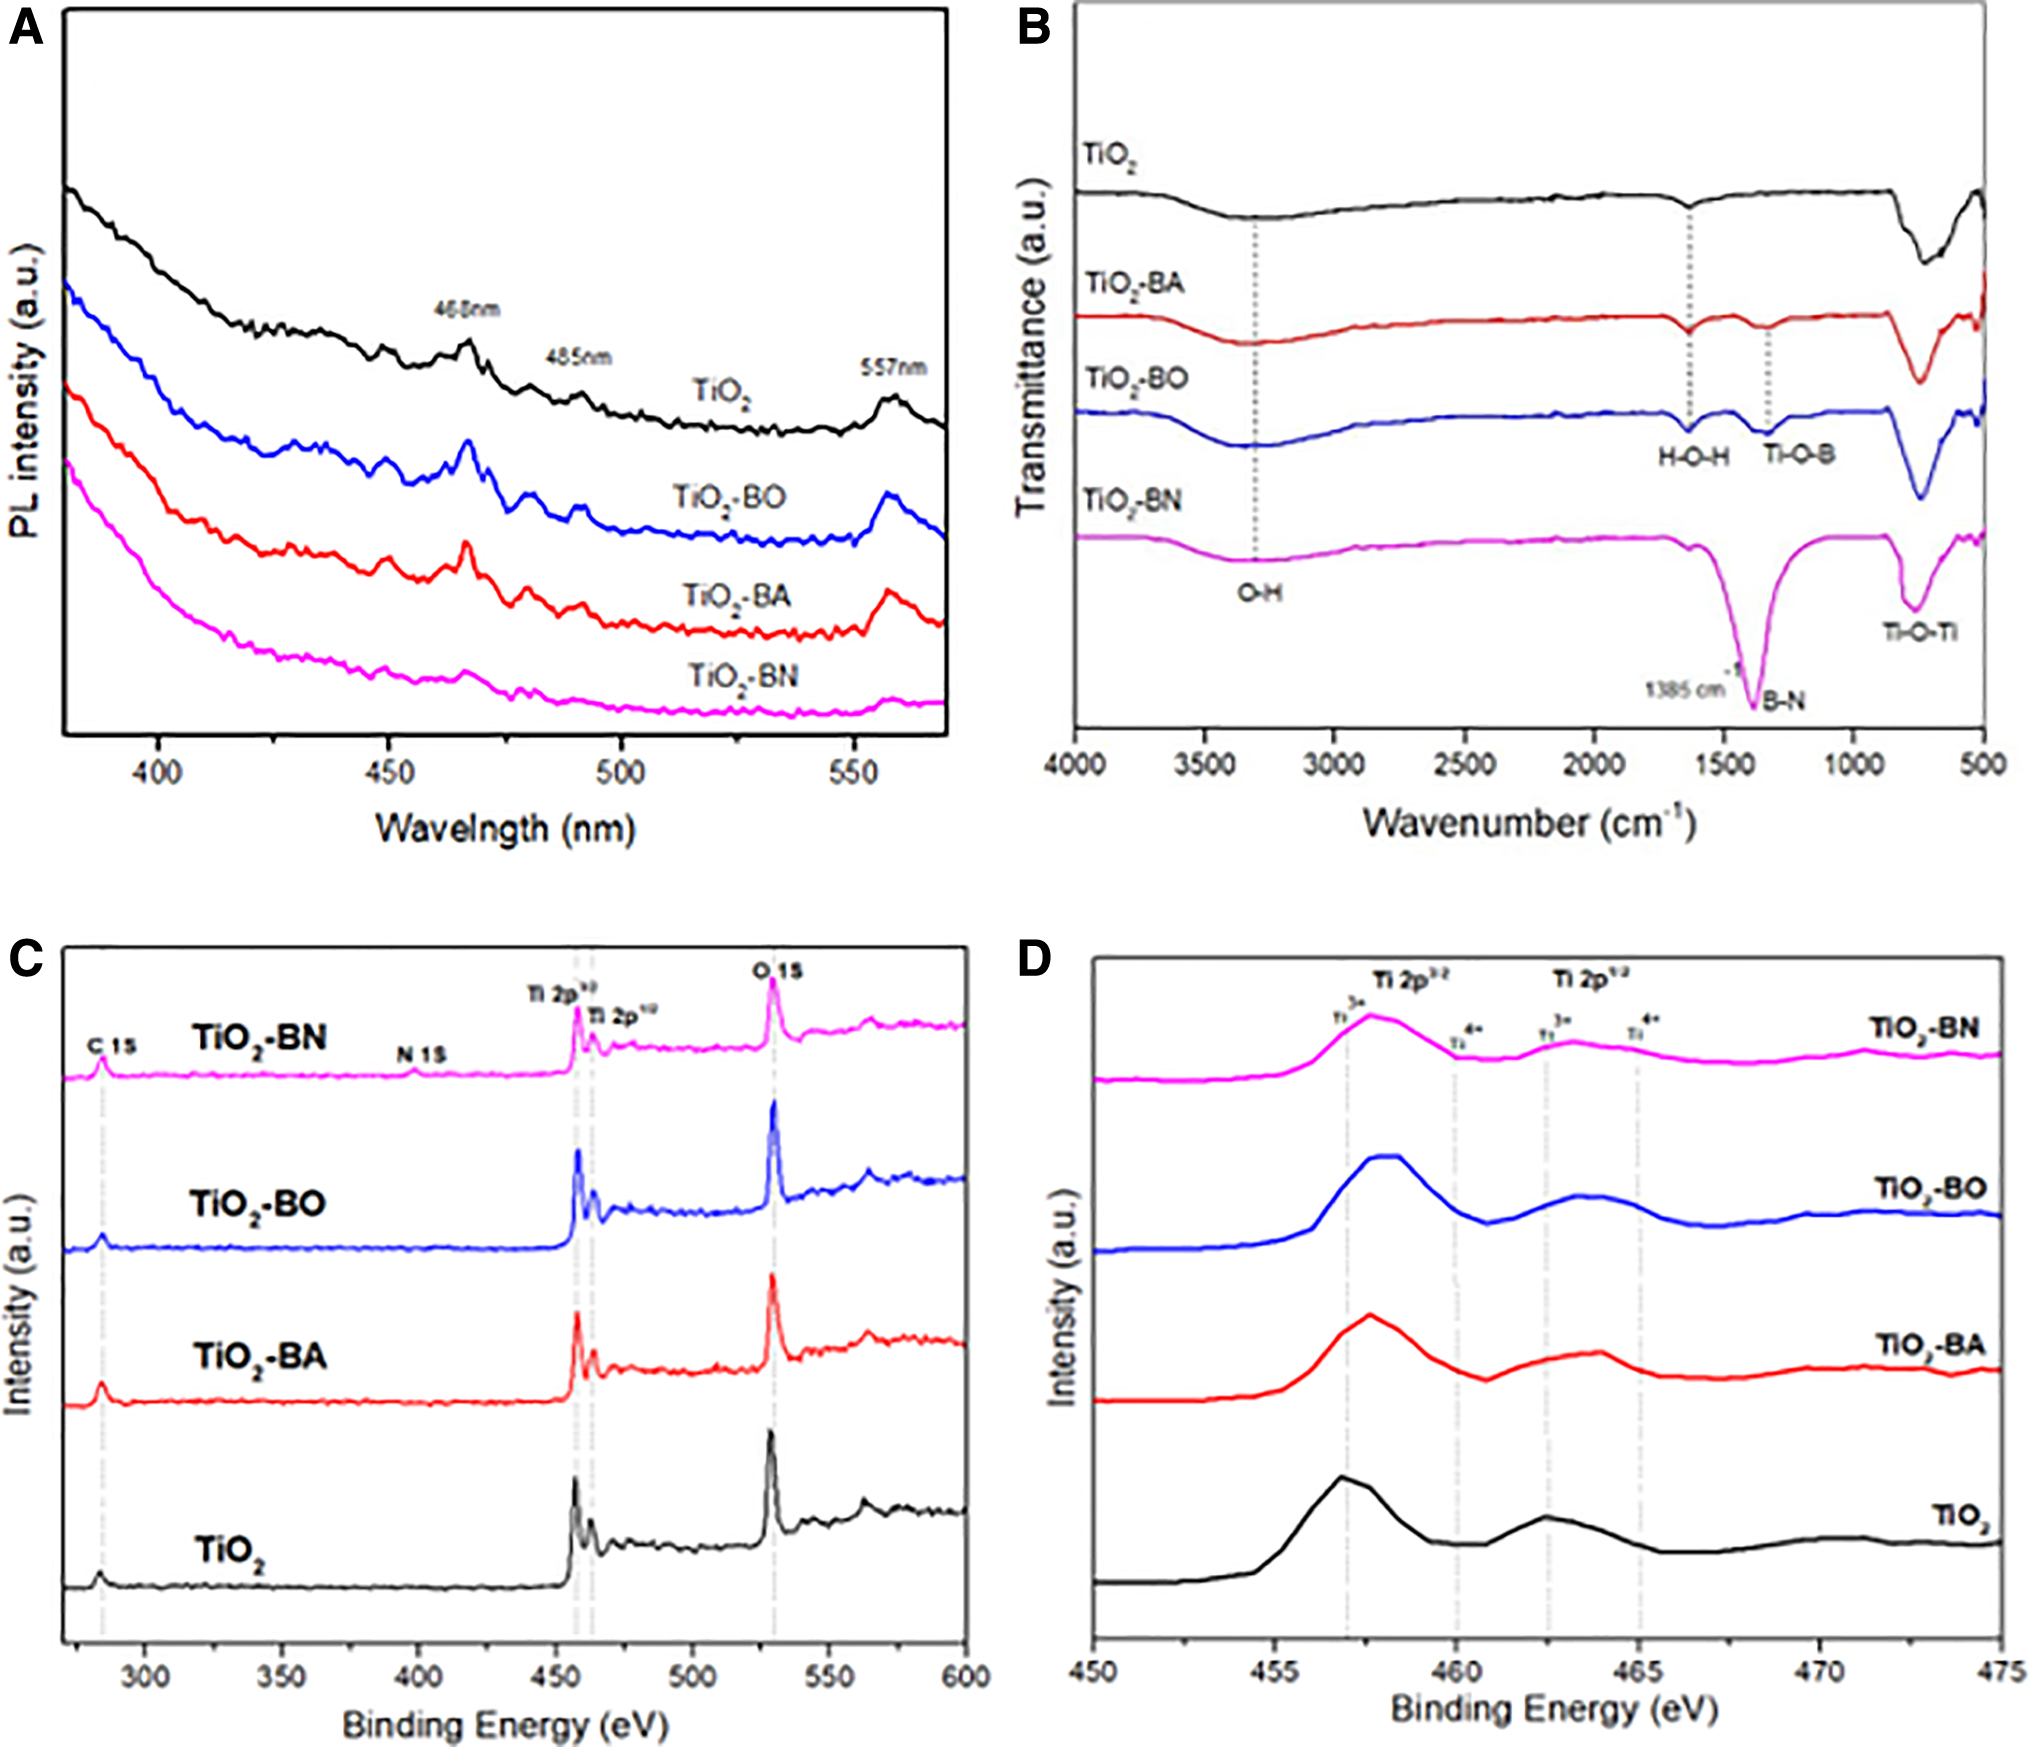
To investigate the enhanced performance of BO-TiO2 compared with undoped TiO2 and other boron-doped TiO2, PL data were analyzed. Figure 3A, thus, shows the PL spectra obtained from the recombination of electron holes in the TiO2 composites. Similar peak shapes were seen in TiO2-BO and TiO2-BA, with the main peaks at 468 nm and 485 nm being caused by charge transfer from Ti+3 to TiO68− and surface oxygen vacancies, respectively (Kao and Chen, 2017; Kavitha and Devi, 2014). These peaks are not prominent in pure TiO2 and TiO2-BN nanocomposite.
This can be understood by the fact that BO and BA are oxygen-rich species that can fuse well with the TiO2 lattice structure compared with the BN. As a result, more Ti3+ ions are produced, which is important for preventing electron-hole pair recombination and, consequently, dye degradation.
FTIR spectroscopy analysis
The chemical composition of TiO2 was investigated using FTIR spectroscopy. With respect to the Ti-O-Ti bending mode (Wang et al., 2017), the H-O-H (Hoşgün and Aydın, 2019), the bending vibrations of O-H (Koysuren and Koysuren, 2020), etc., common transmission peaks around 600, 1,650 cm−1, and a broad band at 3,460 cm−1 have been observed in all samples. The TiO2-BN sample exhibits the B-N stretching vibration mode (Gonuguntla et al., 2021) as a sharp, clear peak at 1,385 cm−1, as seen in Fig. 3B.
XPS analysis
Using a PHI 5000 Versa Probe II, FEI, Inc., system with a monochromatic Al Kα source and a charge neutralizer, the surface characteristics of the samples under study were assessed using XPS. C 1s peaks have been seen in all samples, as depicted in Fig. 3C. The “BN doped” TiO2 samples show a characteristic N 1s at 398.28 eV, indicating the B-N bonding (Liu et al., 2017a).
The Ti-O bond can be identified by the O 1s peak at 528 eV. Ti 2p3/2 and Ti 2p1/2 are responsible for two significant, separate peaks in the data that were seen at 459 and 464.7 eV, respectively. Ti3+ production is believed to be responsible for the peak at 457.5 eV in pure TiO2, which is displaced to the right in doped TiO2 samples at higher binding energies (Fig. 3D).
In contrast to TiO2-BN, this peak is seen to be more displaced in BO- and BA-doped TiO2 samples. This shows that boron doping, which is seen to be significant in BO- and BA-doped TiO2, has a favorable effect on the creation of the surface-layer of Ti3+ species. The XPS data recorded does not show the presence of the Ti-B or the Ti-B-O bond that is otherwise present between 187 and 192 eV (Gombac et al., 2007; Zaleska et al., 2009). This is attributed to the absence of boron on the surface. As the radius of Ti4+ (0.068 nm) is larger compared with B3+ (0.023 nm), it is impossible for substitution of Ti4+ with B3+. It is, therefore, obvious that boron fills the interstitial spaces in the current TiO2 lattice.
Photocatalytic activity
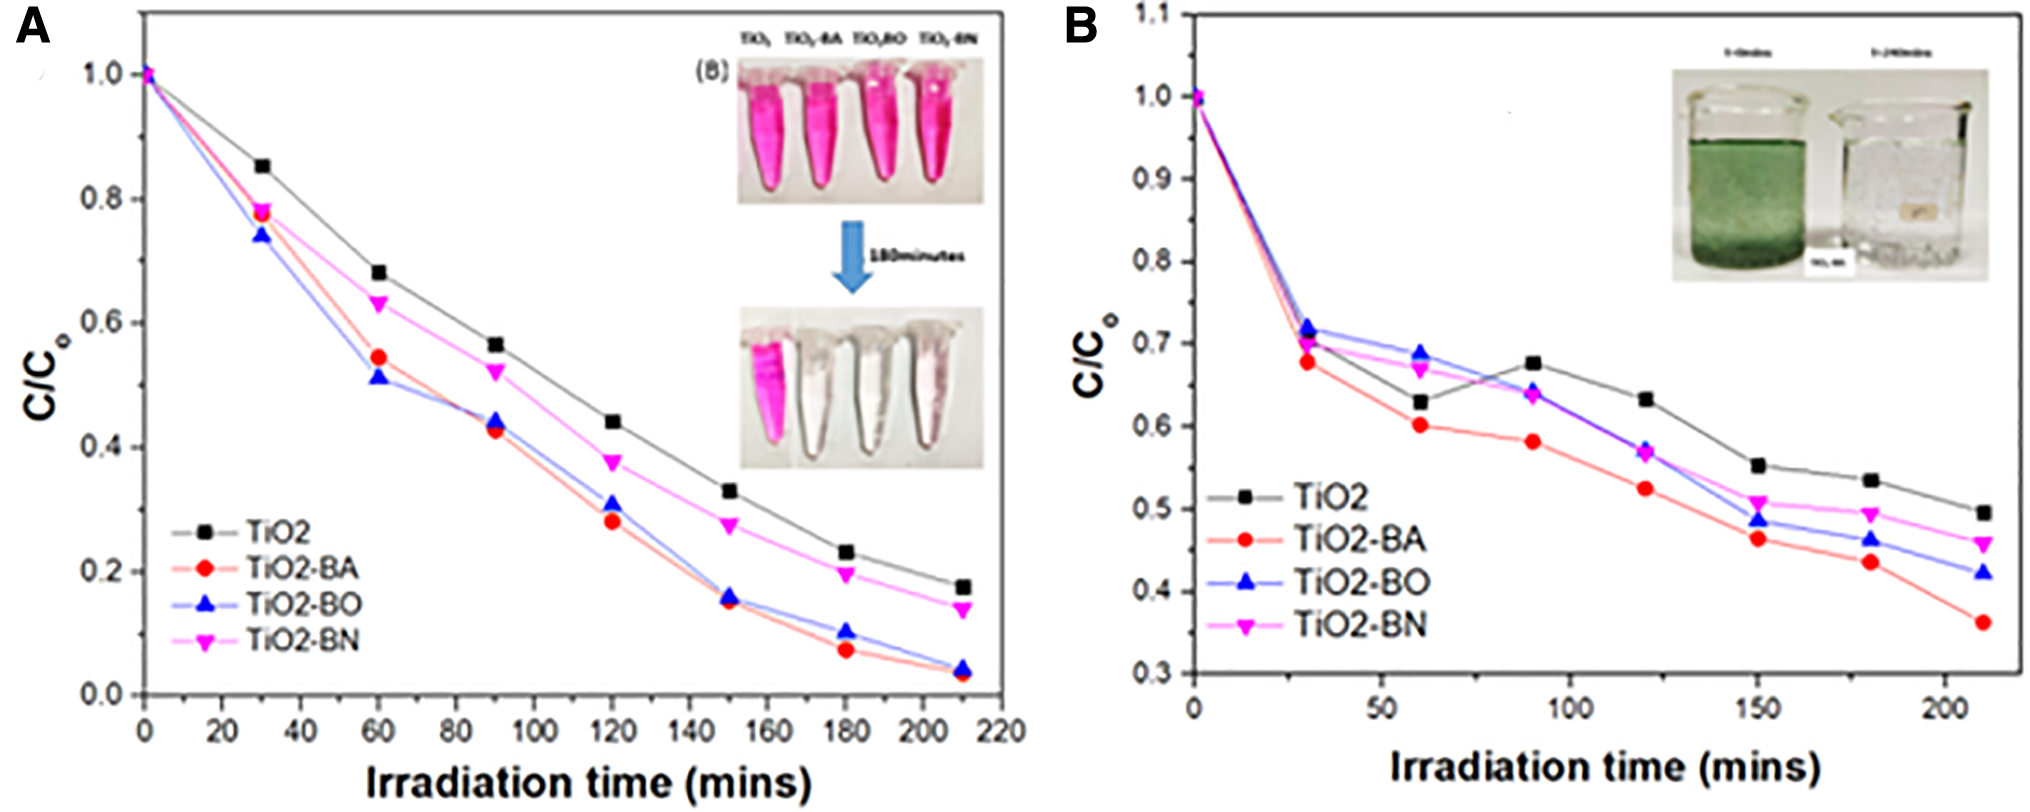
Boron-doped nanocomposites are synthesized as photo-catalysts for RhB dye and industrial wastewater decoloration and degradation in the presence of UV. The UV-Vis absorbance spectra of RhB dye (15 mg/L) with respect to time is depicted in Supplementary Fig. S3 in the Supplementary Data. Fifteen milligrams pure TiO2 decolorizes 82.3% of 15 mL RhB dye in 210 min, as shown in Fig. 3A.
Boron doping with various precursors increases the dye degradation efficiency with the same concentration of the catalyst (Supplementary Fig. S3B–D in the Supplementary Data). The decoloration rate of TiO2-BA, TiO2-BO, and TiO2-BN (15 mg each) has been found to be 96.2%, 95.6%, and 85.9%, respectively. TiO2 action was slower, as it took 240 min for 50.3% degradation for the industrial wastewater sample (Supplementary Fig. S4A in the Supplementary Data).
Boron doping increased the decoloration rate by 63.7%, 57.8%, and 54.1% in TiO2-BA, TiO2-BO, and TiO2-BN (Supplementary Fig. S4B–D in the Supplementary Data), respectively. Thus, it can be safely affirmed that boron positively influences the catalytic activity of TiO2, with BA being the most effective nanocomposite. Figure 4A and B reflects the degradation kinetics as a concentration ratio of initial versus instantaneous value of dye absorbance.
Plot on concentration ratio of RhB dye
These figures reconfirm the superiority of BA-doped TiO2 in the degradation of both RhB dye and the industrial wastewater sample than BO- and BN-doped TiO2; this is because BA-doped TiO2 has more Ti3+ ions on the surface (as evident from XPS). This reduced form of titanium serves as an active site, aids in reactant adsorption, and traps the electron and hole pair that are produced due to photosynthesis. This results in increased photocatalytic activity and prevents their recombination.
Kinetics of dye degradation
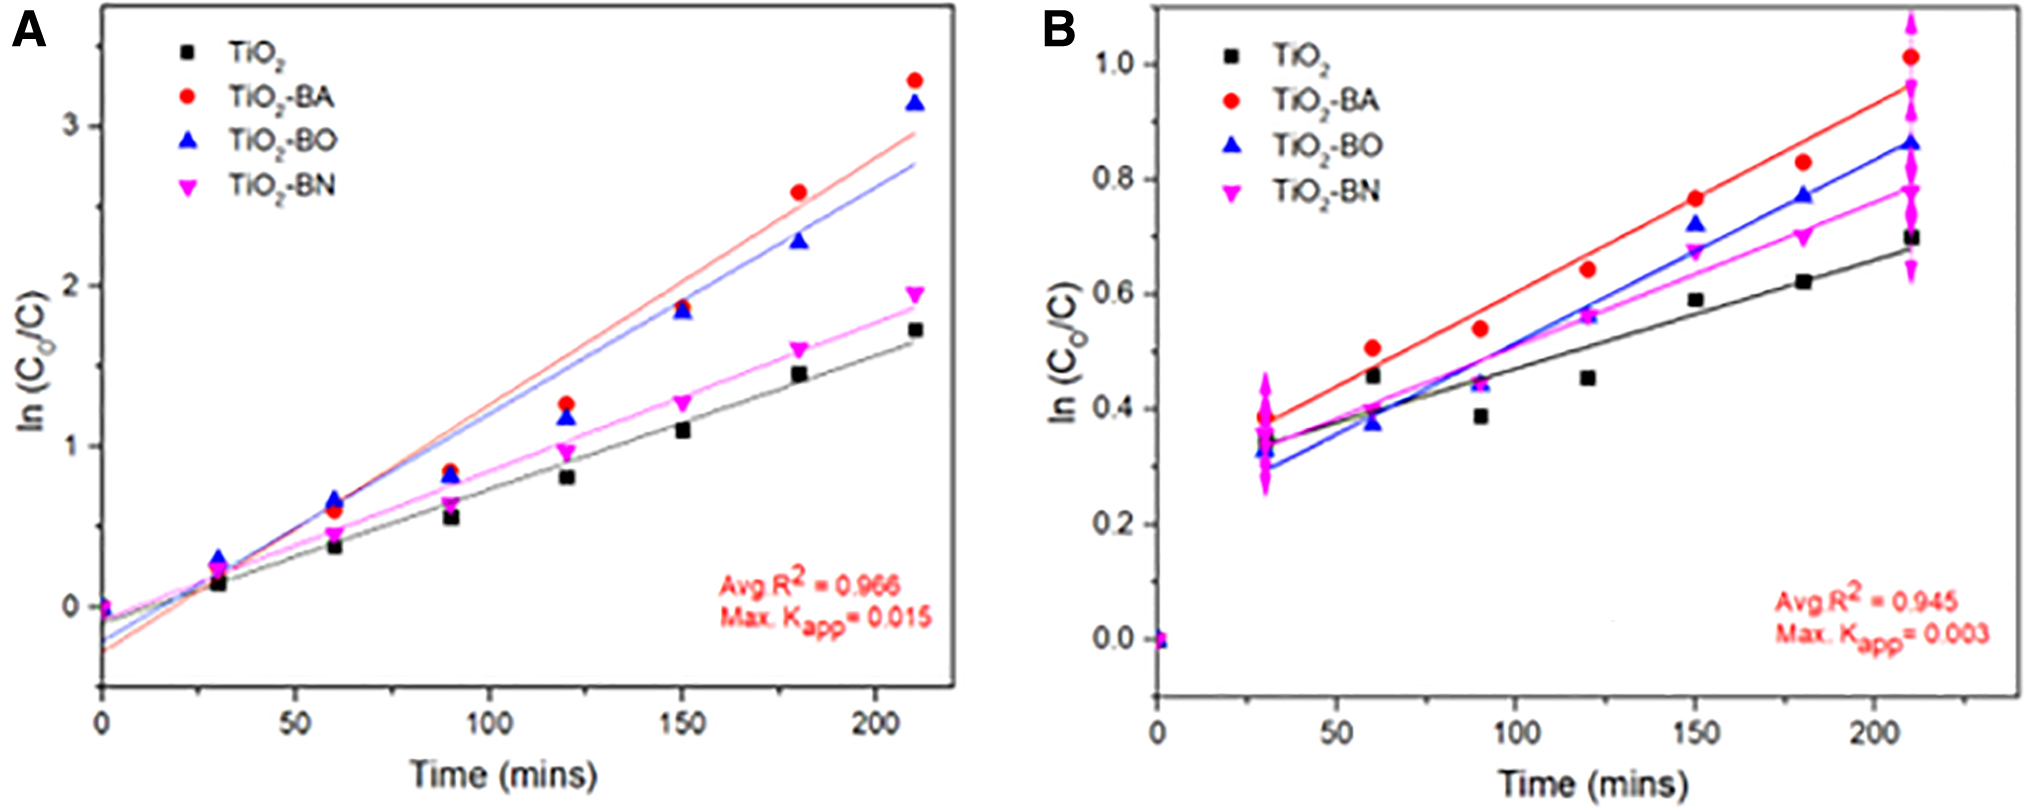
Dye degradation through the photocatalytic activity follows the Langmuir-Hinshelwood mechanism, which states that the rate of degradation with respect to time is directly proportional to the rate constant. This can be explained mathematically as follows:
where
In this equation, Cin is the initial whereas C is the dye concentration at any given time t, and Kapp is the rate constant related to the catalyst. The equation cited earlier can be plotted as a straight line between
In our experiment, different boron-doped TiO2 compounds are used to degrade the RhB dye (Fig. 5A) and industrial wastewater sample (Fig. 5B), which follows pseudo-first-order reaction kinetics. Kapp is directly associated with the photocatalytic activity of the catalyst and is highest in TiO2-BA (0.015) for RhB and (0.00328) for industrial wastewater.
Study of reaction kinetics of doped and undoped TiO2 with RhB dye
Effect of pH
Adsorption of dye molecules on the surface of catalyst depends on pH, which relates to its point of zero charge. Dye adsorption increases with an increase in the pH of the solution, as both decoloration and photocatalysis effects operate in synergy. Moreover, a change in hydrogen ion concentration has been reported to directly affect the dye degradation in semiconductor oxides (Chauhan et al., 2022; Zhang et al., 1998). To evaluate the effect of pH on dye degradation, TIO2-BA catalyst was used and its degradation efficiency was compared with the RhB dye.
Further, pH values of 4, 7, 9, and 11 were taken as reference with the same experimental setup as mentioned in the Photocatalytic Activity section. As shown in Fig. 6A and B in the acidic medium, degradation efficiency is found to be the least; this is due to excess of H+ in the medium. These H+ ions counter the active OH* and form water molecules. This phenomenon gradually reduces till neutral pH is reached. pH value of 9 was found to be the most effective for RhB dye degradation with an efficiency of more than 97% in 210 min.

UV-Vis of RhB dye degradation with TiO2-BA with variation of pH
Dipole attraction between the dye and catalyst is maximum around this pH, leading to most efficient dye degradation. Further increase in pH (>9) slows down the catalysis process due to scavenging of OH*, thus decreasing the overall efficiency of the system. This study further suggests that the developed catalyst can be effective for dye degradation in textile industries that have alkaline effluent.
Conclusion
“TiO2” doped with various precursors of boron has been prepared by a single-step sol-gel method. The boron loading is kept at a constant of 5% (w/v), and all the samples have been calcined for 5 h at 500°C using a heating rate of 3°C/min to uniformly diffuse the boron within the TiO2 structure. The obtained powdered samples have been obtained in the anatase phase, as confirmed by the XRD pattern. Further characterization is carried out using UV-Vis spectroscopy, Raman, FTIR spectroscopy, XPS, XRD, FESEM, TEM, and PL analysis.
Doped boron was found to occupy interstitial sites of TiO2 and was not available on the surface, as no peaks were observed between 187 and 192 eV representing the formulation of O-Ti-B or the Ti-O-B bonds. In this study, BA-doped TiO2 nanocomposites came out to show the highest photocatalysis for both RhB dye and industrial wastewater sample decoloration, which is around 13% more than pure TiO2.
pH dependence of the photocatalyst was further investigated, and a pH equal to 9 showed the most efficient dye degradation. These results demonstrate the effect of boron precursor in dye degradation, where TiO2-BA doping could be an ideal material for removing organic dye containments in alkaline industrial wastewater samples. The prepared photocatalyst was found to be photostable and highly effective with >90% dye degradation for up to six cycles of reuse, which is better than the previous work reported in our laboratory (Chauhan et al., 2022) and other similar systems (Niu et al., 2020; Wang et al., 2012).
The present study demonstrates the development of an effective photocatalyst for the treatment of industrial effluent containing organic dyes with improved decolorization. Non-metal doping in semiconductors is, thus, an exciting area of research that can treat industrial wastewater from dye-laden effluent water from various industries. However, further studies are required to compare and enhance the efficiency of various known photocatalysts.
Footnotes
Authors' Contributions
S.T.: conceptualization, visualization, methodology, formal analysis, and writing—original draft. M.P.: validation, investigation, and formal analysis. S.G.: data curation, writing—review and editing. S.B.: supervision, validation, and project administration.
Author Disclosure Statement
The authors declare that they have no known competing financial interests or personal relationships that could have appeared to influence the work reported in this paper.
Funding Information
This work was funded by Abdul Kalam Technology Innovation National Fellowship, Indian National Academy of Engineering (Grant No. INAE/212/AKF/22). The authors are grateful to the Centre for Nanoscience, IIT Kanpur for providing the characterization facilities.
References
Supplementary Material
Please find the following supplemental material available below.
For Open Access articles published under a Creative Commons License, all supplemental material carries the same license as the article it is associated with.
For non-Open Access articles published, all supplemental material carries a non-exclusive license, and permission requests for re-use of supplemental material or any part of supplemental material shall be sent directly to the copyright owner as specified in the copyright notice associated with the article.