
Abstract
Despite six decades of microplastic contamination research, this field struggles to establish clear, universally accepted methods and techniques. Furthermore, scant published work scrutinizes the application, effectiveness, and utility of positive and negative controls. This study examines three common practices involved in microplastic processing, enumeration, and particle characterization. The first component evaluates four filtered water sources that are commonly used to run procedural laboratory blanks and rinse laboratory glassware and instruments. A statistically significant difference was found between tap water and three sources of filtered water and between two sources of filtered water. This suggests the magnitude of correction applied to samples is dependent on the type of filtered water chosen for blanks. The second component chronicles particle loss, specifically particle adhesion to the filtration apparatus. Water samples spiked with plastic standards representing three distinct morphologies and vacuum filtered through a two-piece borosilicate glass filtration apparatus yielded a notable difference in recovery rates compared to a two-piece filtering apparatus made of stainless steel. The steel filter had significantly higher recovery rates of irregular polyethylene fragments compared to glass, although there was no statistical difference in the recovery of nylon fibers or symmetrical polyester fragments. The final component compares the effectiveness of ImageJ, a popular imaging software program, with Material Image Processing and Automated Reconstruction (MIPAR), a new program with deep learning capabilities. Both systems analyzed identical images captured from a set of polycarbonate filters that contain environmental media spiked with plastic standards. While ImageJ is capable of reporting particle enumeration, as well as basic measurement and categorization, it grossly overestimated fragments and frequently mischaracterized fibers. Particle count summaries from MIPAR, however, were in accord with the known quantity of standard spiked into each sample. These findings underscore the importance of quality controls when developing new methods or when modifying established methods.
Introduction
Scientists have been documenting plastic pollution in our environment for over 60 years, and although plastic pollution has been accumulating in the environment since the 1950s, the scientific interest and research have lagged significantly with microplastics (plastic particles <5 mm) gaining traction in the scientific community only for the past two decades (Qin et al., 2020). Despite these early publications, advances in the methodology for detecting microplastics in the environment remain a complex and time-consuming process. Currently, there is no standard operating procedure for sample collection, processing, and analysis/detection of microplastics other than the recommendations from the National Oceanic and Atmospheric Administration published in 2015 (Masura et al., 2015), which only allows the quantification of plastic particles >300 μm.
Numerous methods used to process and identify microplastics are described in the literature. These methods range from basic filtration, sieving, using different digestion solutions to dissolve organic matter (e.g., Fenton's reagent, potassium hydroxide, etc.), and density separations to visual enumeration using standard stereoscopic microscopy, fluorescence microscopy, imaging analysis tools, and spectroscopic/spectrometric quantification (Raman, Fourier transform Infrared spectroscopy, pyrolysis-gc/ms, etc.) used to identify the chemical fingerprint of plastic polymer types (Erni-Cassola et al., 2017; Hendrickson et al., 2018). Each method comprises varying quality assurance and quality control procedures to ensure sample integrity.
Quality control and quality assurance (QA/QC) is imperative in microplastic research, given their ubiquitous nature and high possibility of sample contamination. In addition, the laboratory water used to process microplastic samples varies in purity and is not standardized across different methods. Koelmans et al. (2019) evaluated 50 different microplastic publications in freshwater and drinking water for the QA/QC criteria used in each study. Only 4 out of 50 studies evaluated received a positive score indicating all QA/QC criteria were met, which suggests there is high variability in QA/QC protocols from study to study.
Gwinnett and Miller (2021) investigated procedural microplastic contamination introduced to water samples through laboratory processing methods by using strict QA/QC protocols as well as no QA/QC protocol, and found significantly greater procedural contamination in the samples where no QA/QC protocol was used. Both studies highlight the need for significant improvement in the measures and QA/QC protocols used to maintain sample integrity. The absence of standardized methods to analyze microplastics makes it difficult to compare results across studies and is even more complicated when lacking QA/QC protocols.
The methods used to enumerate microplastics include visual counting, and fluorescence microscopy coupled with imaging analysis tools. Visual counting of microplastics under a stereoscopic microscope is extremely time consuming and subjective to the individual interpreter, and requires skill to differentiate between plastic polymers and organic materials. Visual quantification only allows the detection of larger size fractions of plastics (typically >100 μm) and may drastically underestimate the amount of microplastics contained within a sample (Erni-Cassola et al., 2017; Simmerman and Coleman Wasik, 2019; Prata et al., 2019).
Fluorescent dyes such as Nile Red have gained popularity in microplastic research methods. Their strong sorption to plastic polymers renders them easy to identify when viewed under a fluorescence microscope (Erni-Cassola et al., 2017; Prata et al., 2019; Shim et al., 2016; Simmerman and Coleman Wasik, 2019). In addition, image processing analysis tools can be used in combination with fluorescent dyes to easily enumerate, categorize, and measure plastic particles.
The most commonly used open-source imaging processing software is ImageJ and is widely used in microplastic research. To illustrate the popularity of this free software, a Scopus literature search of library databases using the keywords “microplastic” and “ImageJ” revealed 435 documents. ImageJ allows the user to set several thresholds and criteria specific to their individual images to analyze microplastics using the “Image,” “Process,” and “Analyze” tabs within the program. Erni-Cassola et al. (2017) established the methods for the use of Nile Red dye and ImageJ analysis for microplastics and provided an algorithm for manual microplastic identification in ImageJ. No semiautomated or fully automated software plug-ins were available until Prata et al. (2019) built a plug-in/macro for ImageJ (Microplastics Visual Analysis Tool, or MP-VAT) to streamline and semiautomate the threshold setting and image processing of microplastic images.
MP-VAT is capable of quantifying microplastics as small as ∼1 μm, which is highly sensitive compared to 300 μm stated in the NOAA 2015 methods. The output data of MP-VAT provide parameters, including the number, area, shape, and ferret's diameter of the microplastics, and are the only attempts to date to automate microplastic quantification using Nile Red dye and image analysis. Although MP-VAT performed with satisfactory results in the original publication, it is noted that future experiments to validate this method using spikes of different polymer types are necessary to confirm the capabilities of MP-VAT.
Material Image Processing and Automated Reconstruction (MIPAR) is an imaging analysis program that allows code-free feature detection algorithm creation. Using 110 images containing fluorescing plastic standard particles as well as environmental samples representing various media-air, water, and wastewater, a pretrained deep-learning model was used to create a preliminary customized algorithm to identify microplastic fibers >200 μm and particles >30 μm. While potential exists for this algorithm to be further perfected, it worked well for the purpose of comparing the conventional ImageJ by a program with machine learning abilities.
This study highlights the importance of implementing strict QA/QC procedures in microplastic research. The aims of this study include (1) describing the difference in microplastic concentrations detected in five different laboratory water sources, (2) noting the importance of running positive controls by showing sample loss from adherence to labware (in addition to negative controls to quantify sample contamination), and (3) testing the efficacy of two different image analysis tools, ImageJ (coupled with MP-VAT; Prata et al., 2019) and MIPAR, to accurately detect and enumerate fluorescing microplastics.
Materials and Methods
IRB ID: STUDY00008248. The IRB determined that the proposed activity is not research involving human subjects as defined by DHHS and FDA regulations. To arrive at this determination, the IRB used WORKSHEET: Human Research (HRP-310).
Filtered laboratory waters
The five laboratory water sources tested include tap water, deionized (DI) water, reverse osmosis (RO) water, high-performance liquid chromatography (HPLC) grade water, and nano-pure (NP) >18 MΩ-cm laboratory grade water. The tap water is from a municipal source. The DI water system is municipal tap water with localized secondary filtration. The NP and RO water systems are smaller units confined to the laboratory, both drawing on the DI water system. Finally, the HPLC water is packaged in 4 L volumes, and, according to the manufacturer, filtered to 0.2 μm.
Each type of water was processed in 300 mL volumes in triplicate (n = 15). Processing involved wet peroxide oxidation (WPO), Nile red staining, and contaminant enumeration with customized imaging software, MIPAR. WPO consists of adding 10 mL of a 0.05 M solution of ferrous sulfate and 10 mL of 30% hydrogen peroxide to a sample on a 75°C hotplate with a cleaned magnetic stir bar for 20 min, as described by the NOAA Marine Debris Program (Masura et al., 2015).
Nile red staining consists of adding 0.5 mL of a stock solution to the digested solution to achieve a concentration within the optimal fluorescence range reported by Maes et al. (2017). Neither the WPO reagents nor the Nile red stain were prefiltered. While this lack of filtering could be a potential contribution of microplastics to our samples, they would also contribute to the laboratory water blanks, and therefore be accounted for. After staining, the solution is allowed to cool for 20 min before vacuum filtration through a 5.0 μm polycarbonate membrane filter. A laboratory wash bottle filled with the same water source as the sample was used to thoroughly rinse the beaker that held the sample as well as rinse down the sides of the filtration funnel.
The 47 mm polycarbonate filter, moved from the filtering apparatus with rinsed forceps, was placed in a 47 mm diameter petri dish and covered. By placing the petri dish on a grid under a 450–510 nm blue/green Crime-Lite 2, each filter was imaged in its entirety in 15 separate pictures captured with a Leica EZ4W at 8 × magnification. Saved images were then processed with MIPAR, which yields a summary of total contaminant fragments and fibers per sample. Tap water was expected to contain the most contaminants since purification was most distant from the spout. DI water is filtered within the building, so it was expected to contain fewer contaminants than tap water. HPLC water was expected to contain the least since it is filtered to 0.2 μm.
Filtering apparatus
The two filtering apparatuses examined had different material composition, design, and dimension. One was borosilicate glass with a 250 mL volume reservoir secured to a fritted glass base with an aluminum clamp. Another was stainless steel with a 500 mL volume reservoir and mesh screen base secured with a hand-tightened yoke. In this experiment, plastic standards prestained with Nile Red (see Supplementary Fig. S1 material for images and dimensions), representing three distinct morphologies and plastic types—nylon fiber, irregular polyethylene fragment, and symmetrical polyester fragment, were sorted into groups of 20 (60 standards per sample) and imaged before they were rinsed into a clean beaker containing 100 mL of RO water. As described in the filtered laboratory water experiment, these spiked samples were processed with WPO and Nile red staining before they were imaged and analyzed with MIPAR.
During three stages of sample processing, four pieces of laboratory equipment—magnetic stir bar, beaker, filtering cup (funnel), and filtering head (base)—were examined with the Crime-Lite 2 for errant particles. Fibers, irregular fragments, and symmetrical fragments that adhered to labware were tallied. The sum of these “lost” standard particles was then reconciled with the standard particles “captured” through vacuum filtration and percent recovery based on the standard morphology type was calculated. Final results were based on 10 samples passed through the glass apparatus and 10 samples passed through the steel apparatus for a sum of 600 standardized particles spiked into each filtering apparatus.
Standard QA/QC
Powder-free nitrile gloves and a 100% cotton laboratory coat were worn during sample handling and processing. All sample processing took place within a biosafety cabinet. All beakers and filtering apparatus reservoirs were covered with aluminum foil and only uncovered during pouring of the sample or addition of reagents. All glassware was washed, wrapped in aluminum foil, and baked in an oven for 6 h at 450°C to reduce cross-contamination (Prata et al., 2021).
Imaging software
A set of environmental samples consisting of tap water collected from 20 homes was used to compare the conventional imaging software program, ImageJ, with the contemporary program, MIPAR. Residents from 20 separate domiciles collected two 400 mL volume samples of tap water (n = 40) with a set of instructions for the sake of standardizing collection procedures. One tap water sample was immediately capped and the other was left out on a bed stand overnight and capped in the morning. All samples were processed with WPO and Nile red staining as described in the filtered laboratory water experiment. Images of sample filters were captured before each filter was spiked with 15 Nile red-stained plastic standards (5 nylon fibers, 5 symmetrical polyester fragments, and 5 irregular polyethylene fragments).
After spiking, each filter was immediately re-imaged. To evaluate each program's ability to accurately enumerate and characterize fluorescing contaminants, a summary of fiber and fragments gathered from images taken before and after spiking with standards was analyzed with both ImageJ and MIPAR. For example, a total count of fibers in an original sample processed with MIPAR was subtracted from the total count of fibers in the same filter after it had been spiked and re-imaged.
An overall average of the difference in fiber count for all filters imaged with MIPAR can then be compared with a difference in fibers count for all filters imaged with ImageJ. Similarly, a total count of fragments (symmetrical and irregular) in an original sample processed with MIPAR was subtracted from a total count of fragments in the filter after it had been spiked and re-imaged. The average of these differences was also compared with ImageJ to compare the two programs. Comparing the difference between spiked and unspiked totals will indicate each program's ability to accurately detect the standards, since the quantity of standard spiked on each filter is known.
Results
Filtered laboratory waters
Comparing the average of each of the five laboratory water samples reveals that tap water exhibited the highest concentration at 17.67 ± 1.7 particles/300 mL (mean ± standard deviation), followed by DI water at 12.3 ± 3.4 particles/300 mL, RO water at 6.67 ± 2.6 particles/300 mL, HPLC at 2.67 ± 0.94 particles/300 mL, and NP water at 2 ± 1.6 particles/300 mL (Fig. 1). The laboratory water data set was normally distributed, so parametric comparisons were used (t-test).

Mean microplastic concentration in five different laboratory waters quantified as particle count/300 mL. The letters a, b, and c indicate statistically significant differences in the means among five laboratory waters at level p < 0.05 as determined by t-tests.
There was no statistically significant difference between RO, NP, and HPLC waters. Significant differences were observed between the microplastic concentrations in RO and TAP (p-value <0.05), NP and TAP (p-value <0.001), and HPLC and TAP (p-value <0.01). In addition, significant differences were observed between the microplastic concentrations in DI and NP (p-value <0.05). There was no significant difference in the fiber to fragment ratio between the five different laboratory waters (Supplementary Table S1). Similarly, there was no difference in the sizes of particle and fibers recovered from the various laboratory waters, although both morphologies were smallest in the NP water.
Filtering apparatus
Summarizing results of the 20 trials in this experiment reveals that a vast majority of particles are lost on the filtering apparatus (Fig. 2). Only 0.73% of particles (1 symmetrical fragment and 1 irregular fragment) adhered to the magnetic stir bar, 3.67% of particles (5 symmetrical fragment and 5 irregular fragments) adhered to the rinsed beaker, 6.59% of particles (2 symmetrical fragment, 14 irregular fragment, and 2 fiber) adhered to the filtering head, and 89.01% particles (33 symmetrical fragment, 95 irregular fragment, and 115 fiber) adhered to the filtering cup. Based on morphology, the particles lost overall to labware adherence were 15% symmetrical fragments, 42.1% irregular fragments, and 42.9% fiber.

Stained standard particles adhered to the cup
When comparing performance of the borosilicate glass against the stainless-steel filtering apparatus using a Wilcoxon Rank Sum test, a significant difference is observed for microplastics of the irregular fragment morphology (p-value <0.01), suggesting the effectiveness of the two filtering apparatuses are not equal. However, there was no significant difference in the symmetrical fragment or fiber morphology (Fig. 3).
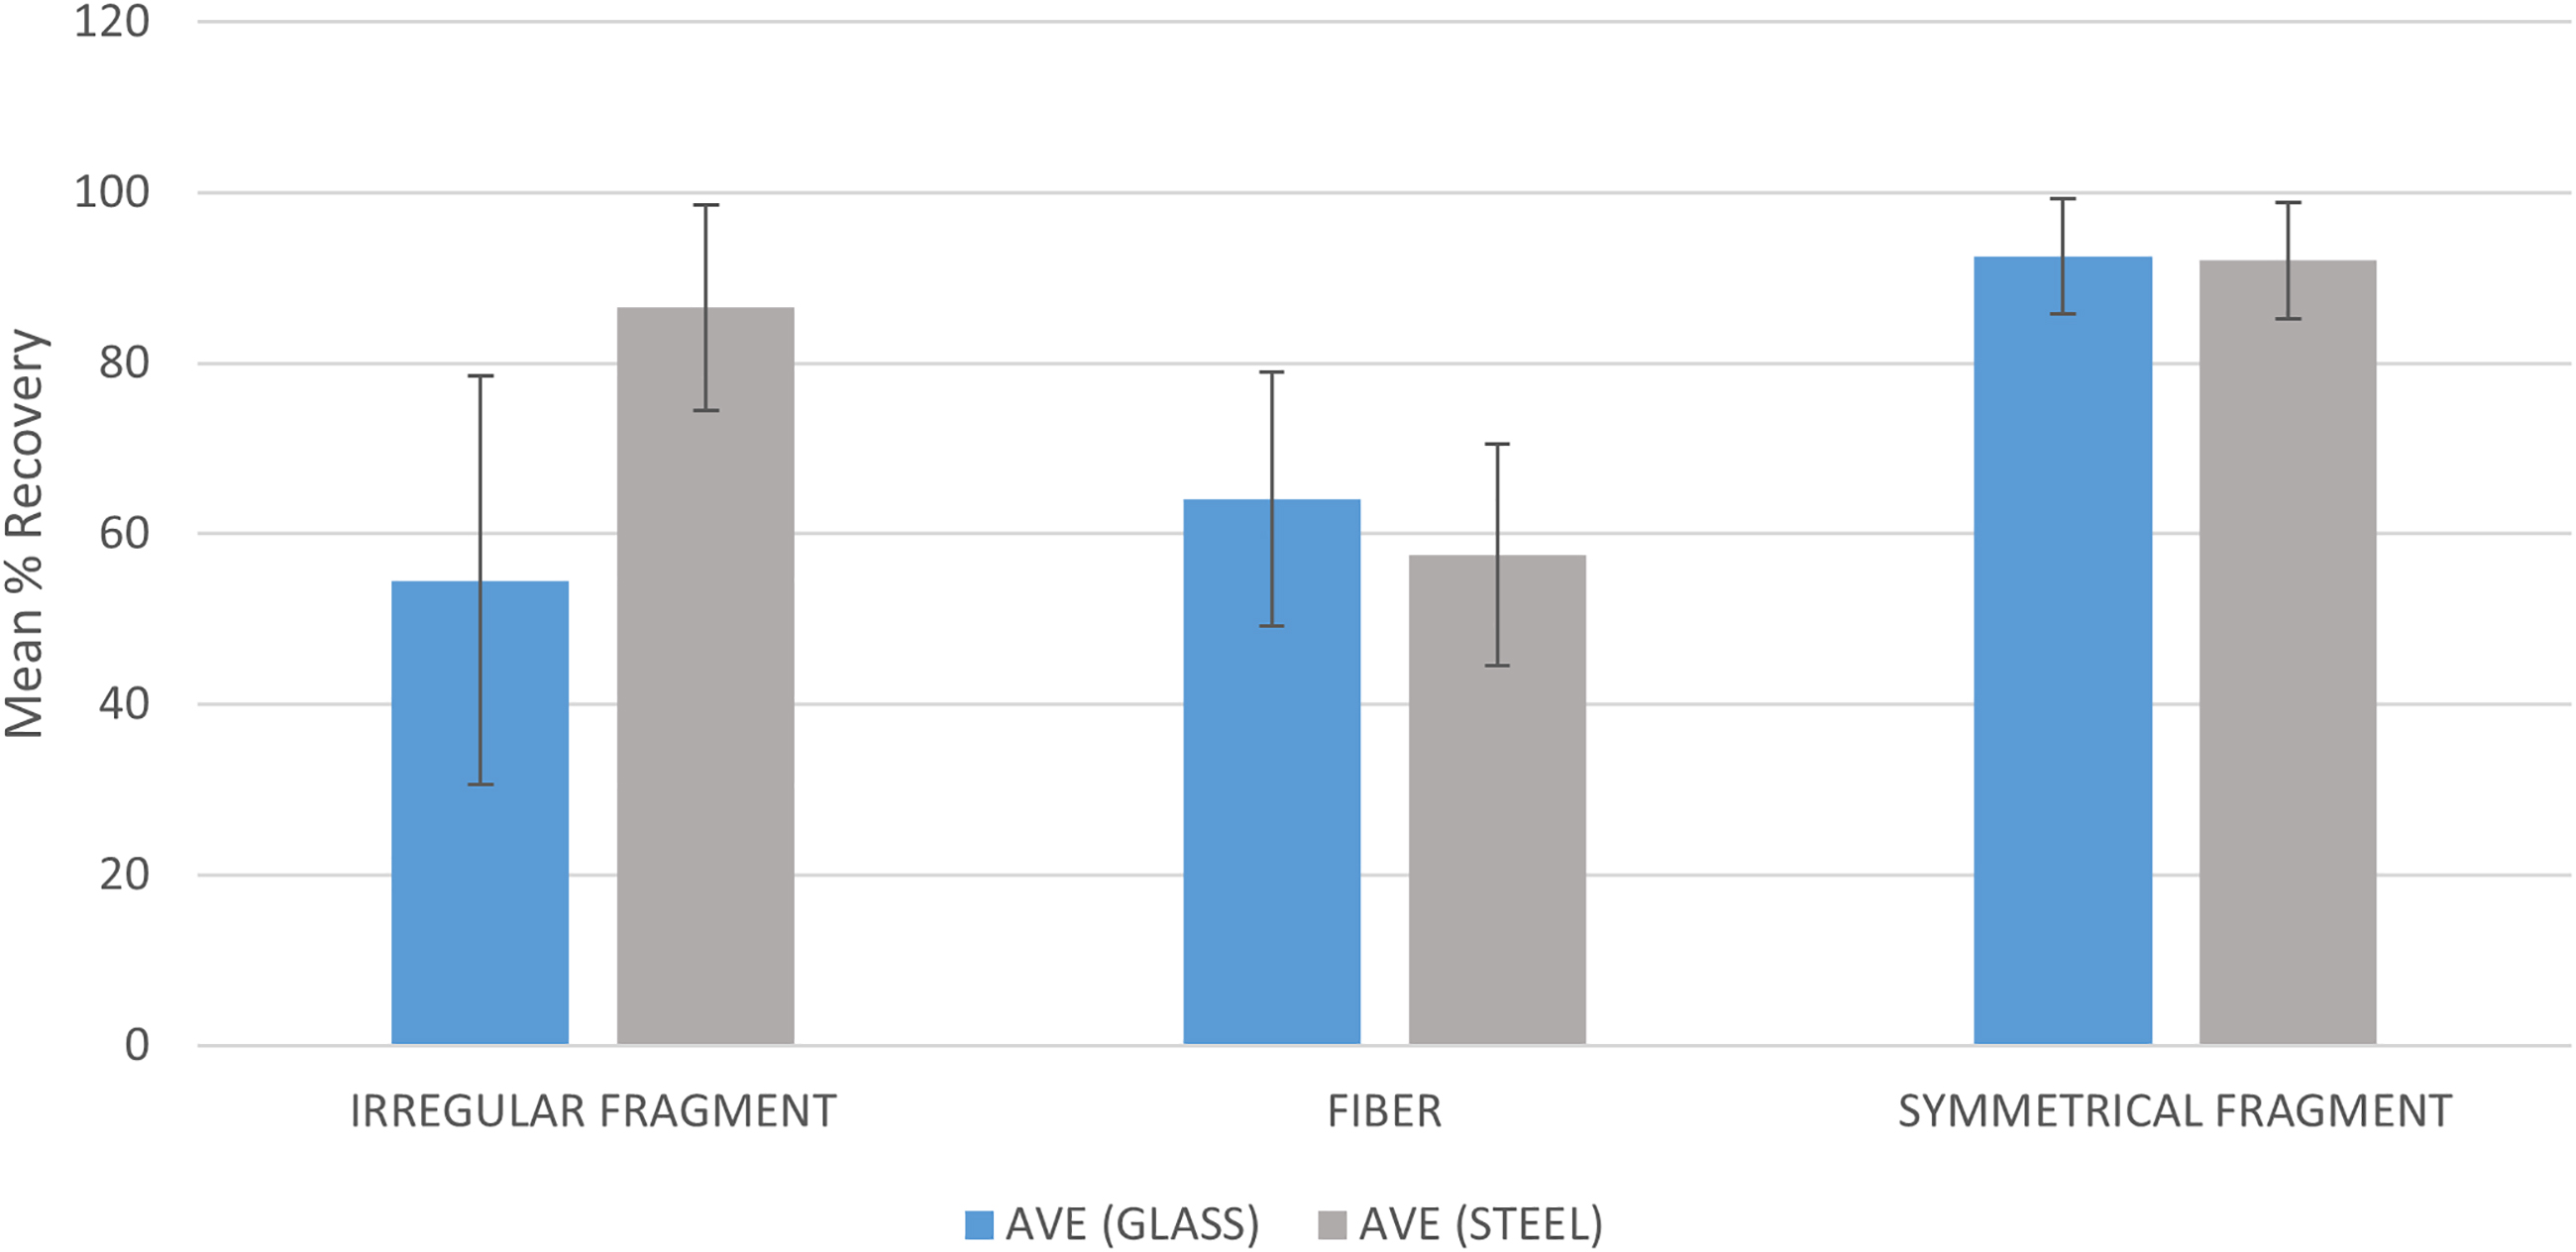
Comparison of recovered plastic standards representing three morphologies, filtered through a glass apparatus versus a steel apparatus.
Imaging software
Since each filter was spiked with 15 standard particles, an expected quantity (5 fibers, 5 symmetrical fragments, and 5 irregular fragments) can be compared to what was detected by each of the two imaging software programs, ImageJ and MIPAR. When the initial customized algorithm for MIPAR was developed, it was only capable of identifying two morphologies, fiber and fragment. ImageJ with MP-VAT, however, was capable of identifying three morphologies: fibers, fragments, and particles. Fragments are defined as irregular and particles are defined as circular. Due to this difference in the number of morphological categories in each imaging system, there were two groups analyzed with both ImageJ and MIPAR.
One analyzed fragments (combining symmetrical and irregular) and another analyzed fibers. The expected number of fibers per filter after subtracting spiked images from unspiked filters was five. Of the 40 samples collected and processed, the average number of fibers counted by imageJ was 9.025, while the average number of fibers counted by MIPAR was 5.300. Next, the expected number of symmetrical and irregular fragments after subtracting spiked images from unspiked images was 10. Again, of the 40 samples collected and processed, the average number of fragments counted by ImageJ was 83.55 while the average number of fragments counted by MIPAR was 14.4. Overcounting was seen for both imaging programs, but the degree of overcounting in ImageJ exceeded that of MIPAR (Fig. 4).

Expected fibers compared to actual fibers counted by MIPAR and ImageJ (left) and expected fragments compared to actual fragments counted by MIPAR and ImageJ (right).
To compare the performance of two separate imaging programs, ImageJ and MIPAR, in their ability to accurately quantify microplastics in a total of 40 tap water samples collected from 20 domestic homes, a Wilcoxon Rank Sum test was used. Significant differences were observed between counts of MIPAR and ImageJ fibers (p-value <0.0001), and between counts of MIPAR and ImageJ fragments (p-value <0.0001). This suggests the outputs of the two imaging software programs are not equal.
Discussion
Filtered laboratory waters
High-quality environmental testing requires laboratory water systems that provide an abundant supply of pure, filtered water. In microplastic research, a reliable water system is essential for washing and rinsing glassware and other laboratory implements. It is also used to run negative controls. Negative controls quantify contaminant particles that have been inadvertently introduced during sample collection and processing. These controls may consist of collection blanks, air blanks, and processing blanks (also known as laboratory, method, or procedural blanks).
In the case of a processing blank, a control may consist of a volume of filtered water run alongside samples, while a collection or air blank may consist of an empty beaker or petri dish set out, while an environmental sample is gathered or processed. This empty glassware is then rinsed with filtered water and run alongside samples. When sample processing is complete, the abundance of particles in negative controls is often subtracted from the abundance or particles in the environmental samples as a means to correct the unintentional introduction of particles (Kosuth et al., 2018).
However, Dawson et al. (2023) analyzed six different methods to correct environmental concentrations of microplastics from negative controls in 51 publications and determined that subtraction and mean subtraction is the least accurate way of correction, and establishing a limit of detection, or limit of quantitation (LOD/LOQ) is the most accurate way to correct environmental samples from negative controls. This work is important in all environmental contamination research, but it is especially important in microplastic research because the material plastic is extremely pervasive. Particles can be introduced by chemical reagents, such as WPO, as well as through glassware and laboratory implements, such as stir bars and gloves.
They can also be introduced by the person collecting and processing the samples from the clothing they are wearing, while processing samples. Finally, they can be present in laboratory air. Additional measures are taken to guard against the unwitting introduction of microplastic particles to environmental samples. For example, processing samples in a fume hood, wearing laboratory coats made from 100% cotton over clothing made of natural fibers, and keeping samples covered during processing and transport are all common practices. Despite these precautions, contaminant particles that were not part of the original sample can sometimes find their way into a sample and they must be accounted for. If they are not, results will be inaccurate and inflated.
According to the critical review published by Koelman et al., less than half of the studies examined conducted adequate negative controls. In addition, in these studies, it was assumed that the filtered water used to carry out negative controls was itself completely void of microplastic contaminants. In some publications, this assumption is explicitly stated (Simon et al., 2018). No study to date has compared filtered laboratory water to see if there are differences in contaminant levels between filtered water systems.
While a variety of filtering water systems exist, each unique in their components, engineering, and volume output, this investigation was designed to measure possible variations in the five laboratory water sources available in a single laboratory. As stated in the results, tap water had the highest concentration of contaminants, which was expected. The lowest concentration was found in NP water, but no statistically significant difference was found between NP, RO, and HPLC filtered waters.
However, significant differences were observed between these three filtered waters and tap water, as well as between DI water and NP water. These variations in contaminant level may have to do with the plastic component parts that make up the filtering system. For example, a study of processed cow's milk found that the two types of plastic extracted from samples, polyethersulfone and polysulfone, most likely originated from the ultrafiltration and microfiltration membranes (Kutralam-Muniasamy et al., 2020). All five water systems in this investigation contained plastic components.
The results suggest that the laboratory waters with higher contaminant concentrations may result in larger subtracted sum/average from sample concentrations, depending on the correction applied. This will result in underenumeration of contaminant particles reported in samples (Dawson et al., 2023). A full inventory of plastic components in a laboratory water filtering system coupled with chemical analysis of particles would reveal contaminant origins.
The age of the filter as well as pressure and volume of flow may also contribute to a greater number of contaminant particles. Based on these results, the authors strongly advise preliminary testing of filtered laboratory water before sample processing to ensure the lowest contaminant load. If microplastics are found in the filtered laboratory water, a LOD/LOQ must be established (Dawson et al., 2023). Results reported in this study should be considered to ensure negative controls serve their intended purpose: to quantify particles that are introduced during sample collection and processing.
An unfortunate limit to this test is the absence of chemical characterization of recovered particles. A list of plastic varieties isolated from a particular source reconciled with a complete inventory of plastic components in each system would have confirmed each contaminant's origins. Synthetic polymer fragments could originate from the filtering cartridge, tubing, or source water. However, the age of the system, the total volume of water filtered, and the pressure of piped water are variables that should be considered when measuring particle shedding. This study brings attention to the issue of potential contamination from filtered water, but identifying the absolute source is outside the scope of this investigation.
Filtering apparatus
Another important aspect of accurate reporting lies in running positive controls, which quantify the number of particles lost during sample collection and processing. Again, the critical review published by Koelman et al. found only 6.3% of microplastic research conducted adequate positive controls. According to this review, positive controls are limited in that they often isolate a single step in the analysis or only focus on a particular size range. Another shortcoming of positive controls is that they are run with an insufficient number of replicates, meaning a correction cannot be made. When they are effectively carried out, they examine recovery rates of a reference material that in size, morphology, and chemical composition represent the types of plastic expected in the sample. Typically, if a recovery rate is reported, it is rarely used to correct for lost particles.
This study examines the possible loss of contaminant particles by way of adhesion to labware during sample processing. Results show that very few particles are lost to the stir bar (0.73% of total recovered) and glass beaker (3.67% of total recovered) used during WPO and Nile red staining. A larger proportion (95.6%) was lost on the filtering apparatus as a whole, and the vast majority of that was in the filtering cup, or funnel, (89.01% of total recovered) as opposed to the filtering head, or base (6.59% of the total recovered). These results indicate that rinsing the stir bar and beaker with filtered water from a squeeze bottle is an effective technique to move contaminant particles.
Since a stir bar has a small surface area and can be held with forceps and rinsed completely, it is not surprising that it had the lowest particle adherence. The beaker, while it has a larger surface area, can be held upside down over the funnel of the filtering apparatus and completely irrigated with a pressurized stream of filtered water. However, when it comes to the filtration apparatus, despite the vacuum force applied, it is common for particles to get trapped at the base of the filtering cup where it articulates with the polycarbonate filter. Excess rinsing with a vacuum seems to do little to keep some particles from preferring the vertical surface of the filtering apparatus to the polycarbonate filter once the lower and upper portion are disengaged.
A siloxane coating was applied to the inside of the reservoir top of the glass apparatus, but no change in particle adhesion was observed. It is possible that ethanol, with hydrophilic and lipophilic properties, may serve as an effective rinsing solution, although Yang et al. (2023) tested ethanol against four other types of filtered waters and it had the highest load of contaminants. The authors suggest that the bottom of the filtering cup be examined for wayward particles. If particles are found, they should be transferred to the filter if possible. If this is not possible, they should be counted and added to the total.
Based on morphology, results show that symmetrical fragments were least likely to be lost to adherence, making up only 15% of total particles lost. Adherence of the other two morphologies, irregular fragments and fibers, was evenly split at 42.1% and 42.9% of total particles recovered, respectively.
This difference is possibly linked to the smaller size and shape of all fibers, which are uniformly 19.3 μm in diameter, and some irregular fragments, which varied in size and dimension (Supplementary Fig. S1). There were also differences between the three standard morphologies and their affinities to particular laboratory equipment. No fiber was found adhered to the stir bar and the beaker. Irregular fragments were 7 × more likely than symmetrical fragments and fiber to adhere to the filtering head. However, fibers were the most likely to adhere to the filtering cup, 1.2 × more likely than irregular fragments and 3.5 × more likely than symmetrical fragments. The dimensions of the surface area and possibly the rigidity of the fiber standards used in this study may contribute to their being trapped at the base of the filtering cup.
This study also included a comparison between two filtering apparatuses, one glass and one steel. The mechanism that holds the cup and head of the steel apparatus together is tighter and more secure than the glass, which is held together with an aluminum spring clamp. Glass filters may also have chips or imperfections in the surface where the two parts articulate, creating small gaps or cracks, giving particles the opportunity to migrate beyond the polycarbonate filter. As stated in the results, there was no significant difference found between the two filtering setups for the fiber and symmetrical fragment morphology, but a higher recovery was seen in the steel apparatus compared to glass when it involved the irregular fragment morphology. Of the three morphologies tested, fragments were the least uniform in both size and shape.
While the standard particles in this study represent three distinct morphologies, this testing is limited in that they do not represent a wide range of sizes. The purpose of this investigation is to show that particle adherence to labware occurs and that frequency may be dependent on particle morphology and the type of laboratory implement. Before investigating a new media, it is important to become familiar with the size, shape, and types of synthetic polymers encountered through preliminary tests. Once this is known, standard particles that best represent those found in environmental samples can be used to run positive controls. If a significant number of particles are lost during these positive control tests and effective improvements cannot be made, then losses should be quantified and accounted for in the final reporting.
Finally, it should be recognized that certain chemical treatments intended to reduce biofouling, such as the WPO, may potentially degrade or warp microplastic particles. The three plastic standards used in this study were imaged before and after spiking and no significant change was observed. However, Munno et al. (2018) found low recovery rates of two varieties of microbeads extracted from personal care products after WPO treatment. These findings indicate caution should be exercised when choosing a method to reduce natural organic matter and the application of positive controls ought to be extended to include chemical digestion.
Imaging software
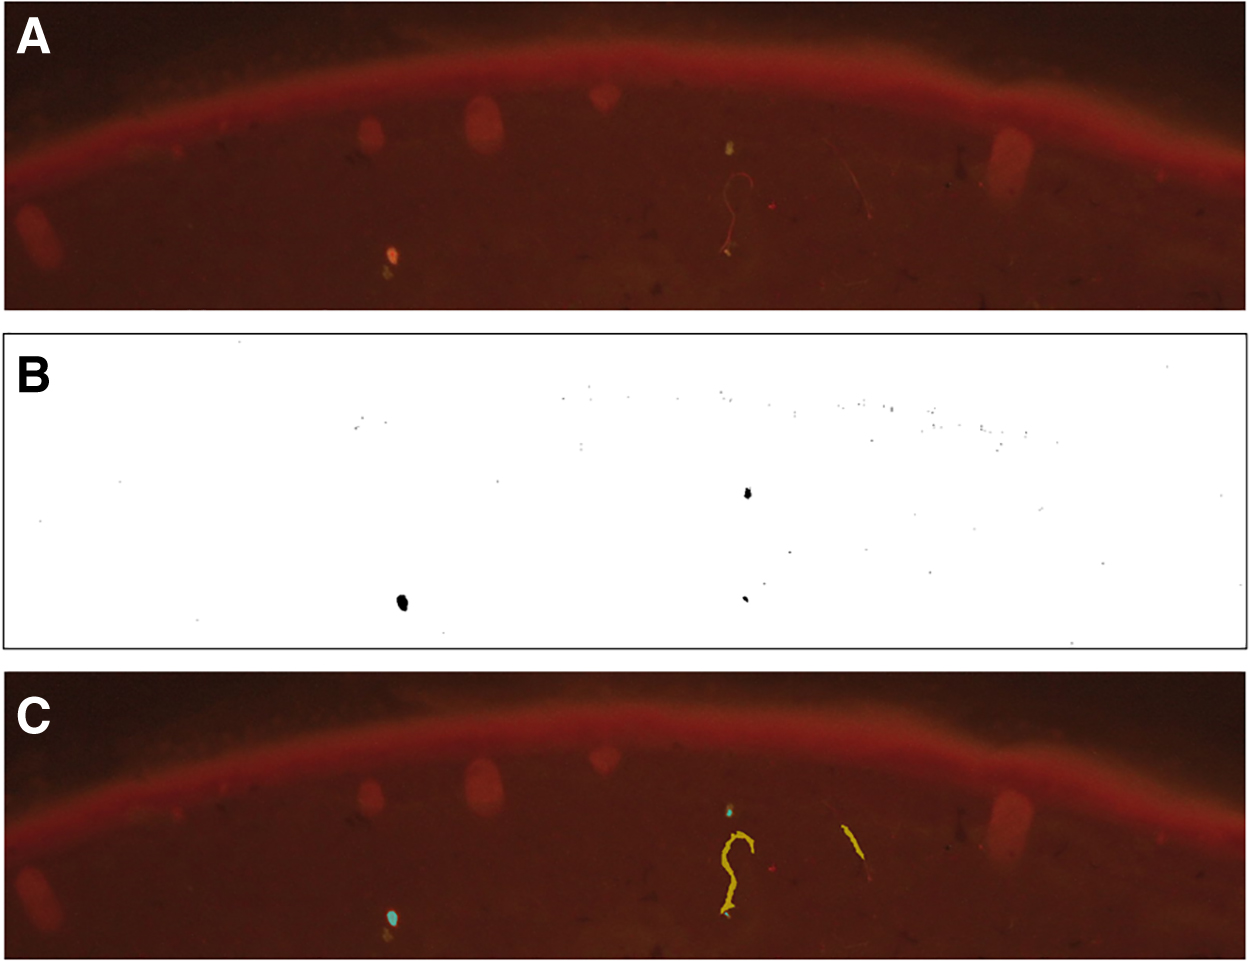
The third arm of this study examines the effectiveness of ImageJ, a popular imaging software program in microplastic research. It is commonly used for enumeration and characterization of fluorescent microplastics that have been stained with Nile red. Using a total of 600 standardized particles (40 sample filters and 15 plastic standard microplastics per filter) of three distinct morphologies, results indicate both software programs overenumerate in the fiber and combined fragment categories. However, the extent of overcounting by ImageJ far exceeds that of MIPAR. In the morphological category of fibers, MIPAR counts in excess of 6%, while with ImageJ, the average is more than 80% of what is expected. This difference is particularly extreme in the combined fragment category with an increase of 44% by MIPAR and an increase of 736% by ImageJ. One factor contributing to the inaccuracy in ImageJ is its inability to recognize the border of a particle and identify it as a uniform whole.
This is especially problematic when there is a gradation of fluorescing intensity in a single particle (Fig. 5) or when the fluorescent light reflecting off the filter creates a soft edge around a fragment. ImageJ may view this as multiple fragments or a central particle surrounded by a spattering of tiny particles, all of which are counted as individual pieces. This not only compromises the accuracy of the overall count but also skews particle size and possibly other dimensional metrics, such as aspect ratio. Another drawback to ImageJ run with the MP-VAT plug-in is its inability to consistently identify fibers. Often, a segment of a fiber fluorescing with intensity is identified as a discrete point instead of being cataloged as one part of a continuous thread.

Symmetrical polyester fragment standards, original image
While fibers in environmental samples may have a cylindrical shape, they can also show up as fine, gossamer threads that are undetected by ImageJ or tallied as multiple, unconnected points (Fig. 6). Furthermore, fibers that bend and curl over themselves are measured by area and not length by ImageJ. However, fiber length is a critical metric when it comes to understanding the fate and transport of synthetic polymers. It is also necessary in research that involves exposure through inhalation. MIPAR is able to provide a true fiber length even if the thread is not laid out in a straight line.
Original image of filter containing both particles and fibers
One limitation of MIPAR is its larger size detection threshold, set at 30 μm for particles and 200 μm for fibers. While this parameter can be shifted to include smaller fragments and fibers, an overadjustment may result in the inclusion of background noise. Care must be taken when setting limits to prevent both overcounting and undercounting. Another limitation of MIPAR is that the algorithm was designed to identify only two morphologies, particles and fibers, while ImageJ with the MP-VAT plug-in puts fluorescing contaminants into three categories: fibers, fragments, and particles.
Fibers are those with a larger aspect ratio, fragments have irregular edges, and particles are symmetrical/circular. However, this could be changed by modifying the MIPAR algorithm. In summary, ImageJ was designed for a broad application and then modified (with MP-VAT) to fit the needs of microplastic research. While both programs can be customized, ImageJ, with a macro/plug-in, must be customized by editing the programming language of the plug-in such as JavaScript.
While this can be done and users can edit the quantification constraints within the MP-VAT script to be more conservative/accurate, this may not be intuitive for those who lack coding experience. To generate a high-quality, customized algorithm for this study, over 110 images with examples of fibers and fragments of various size and circularity were used, but this process can be continually fine-tuned to improve accuracy as the program is capable of deep learning. Once an algorithm has been constructed, it can be shared by multiple users; however, a subscription to the program is necessary. While not open source, the program is inexpensive for research institutions.
The authors acknowledge that this work is continually evolving. Another factor influencing the accurate quantification and enumeration of microplastics using image analysis tools is the quality/resolution of images taken, which is controlled by a number of factors such as microscope configuration, magnification, exposure, lens quality, and camera quality. Although the authors did not investigate different microscope configurations, magnifications, exposure times, lenses, or cameras, it is important to mention that image quality also influences the accuracy of computer-driven quantification. The goal in this arm of the study is not to make recommendations or promote specific programs or equipment. Instead, the aim is to bring to light the current shortcomings of current imaging software and start an important conversation about what new technology has to offer this discipline.
Conclusion
While recent interest in microplastics initiated a surge of international investigations providing evidence of this pollutant's expansive global reach, cross-study comparisons and overall utility of published results are constrained by a dearth of QA/QC measures. This is detrimental to the discipline of microplastic research as experiments designed to examine potential links between microplastic contaminant exposure and injury to whole organisms or cell cultures hinge on reliable, real-world contaminant levels.
Filtered water is sourced from a variety of systems and no study to date has examined the potential for variability between systems. In addition, few studies in this field carry out positive controls and none has assessed performance of filters based on material or design. Finally, many studies use imaging software for total particle quantification and classification based on morphology, but it has not been properly vetted. While this article does not offer solutions to all the problems uncovered, the intention is to bring awareness and generate conversation around these and other related QA/QC issues. If these problems are not addressed, inaccurate reporting will persist in this discipline, wasting time and resources.
Footnotes
Authors' Contributions
M.K.: Conceptualization, writing – original draft, formal analysis, investigation, and methodology; C.B.S.: Conceptualization, writing – original draft, formal analysis, investigation, and methodology; M.S.: Conceptualization, writing – review and editing, and methodology.
Author Disclosure Statement
There are no conflicts of interest with this publication.
Funding Information
This work was not conducted as part of any externally funded project.
References
Supplementary Material
Please find the following supplemental material available below.
For Open Access articles published under a Creative Commons License, all supplemental material carries the same license as the article it is associated with.
For non-Open Access articles published, all supplemental material carries a non-exclusive license, and permission requests for re-use of supplemental material or any part of supplemental material shall be sent directly to the copyright owner as specified in the copyright notice associated with the article.