
Abstract
Land use changes in the wake of urbanization have arranged the urban residential sites to be encircled by anthropogenic activities, resulting in greater exposure to air pollution. There are limited studies carried out on source apportionment of urban landscape-induced air pollution and their spatial representativeness for urban residential sites, and the present study addressed this issue. Characterization, dissemination analysis, and source apportionment of particulate matter (PM)2.5 in a residential area, Lucknow have been carried out. Samples of PM2.5 were collected during mid-winter 2021–2022 at near-road-locations (viz. L1, L2, L3, and L4) of the study area. Samples of PM2.5 chemical speciation were done by inductively coupled plasma mass spectrometry and ion chromatography for 26-elements and 5-ions, respectively. Mean PM2.5 was recorded highest at L3 in the daytime and lowest at L4 in the nighttime with the values 166 μg/m3 and 76 μg/m3 respectively. ArcGIS-inverse distance weighing (IDW) simulations identified the representativeness of PM2.5 for the entire residential site. IDW mapping identified the PM2.5 propagation up to 200 m–500 m over the study area. The diversity in the concentration of PM2.5 observed within the residential area due to the influence of the respective day and night times, multiple sources mix and their spatial distribution. Chemical speciation data of PM2.5 applied to Positive Matrix Factorization version 5.0—as receptor model (PMF v5.0) run for individual sites separately and pool all four sites' data together as a single dataset, which ultimately confirmed seven factors. The PMF model outputs ascertained the mean apportionment of PM2.5 by the determined seven local sources that is, vehicular exhaust—21%, resuspended road dust—15%, cooking fuel emission—12%, waste burning—12%, diesel generator sets exhaust—10%, secondary aerosols—10%, and Construction and Demolition—7%. The remaining 13% mean contribution to PM2.5 was evidenced by unaccounted sources. The present study outcomes qualify the significance to undertake source apportionment studies in connection with urban landscape patterns for air pollution abatement specifically for rapidly changing cities.

Introduction
Most urban areas in India have a serious concern about the exceeded air pollution and relative health risks. The problem with urban air pollution has become progressively complex due to the spread of complexity and multiplicity of emission sources located in and around the city regions. In addition, increased population demands, urban sprawls as well as landscape patterns, and energy consumption are the main grounds for the adverse air quality in the metropolis. Besides, sparsely available vacant lands in the cities give rise to congested developments and multistore buildings (Goyal et al., 2021). The emerging complexity in the urban topography and also the variability in micrometrology conditions also strongly influence urban air quality trends (Ulpiani et al., 2021; Zhao et al., 2018). As a result, action plan implementation for air pollution abatement in urban areas of India has been found to end with little success (Carlsten et al., 2020; Ganguly et al., 2020; Sofia et al., 2020; UPPCB, 2019).
Among the particulate matter (PM) size range, fine-mode particulate pollution like PM2.5 (particles ≤2.5 μm size in aerodynamic diameter) has become a key menace to the health of the public (Ku et al., 2021). Air quality representativeness, principally PM2.5 has become case specific in urban regions of India as the concentration of airborne PM2.5 has not only breached national standards continually but also the levels of PM2.5 found to vary drastically in their levels within the city and city surroundings (TERI and ARAI, 2018; Mcduffie et al., 2021; Sharma and Dikshit, 2016). The main ground on the heterogeneity of ambient PM in the cities reported is rapid changes in urban landscape patterns (Goyal et al., 2021; Liang and Gong, 2020; Owoade et al., 2021; Shi et al., 2019; Verghese and Nema, 2023; Xie et al., 2019; Yadav et al., 2022). Despite secondary aerosol (SA) formation by the long-range transportation and atmospheric transformations, local air pollution sources significantly affect the concentration of primary air-borne particles to play a major role in the spatial variability with a range from <1 to 5 km (Liu et al., 2018; Yadav et al., 2022).
Determination of the predominant emission sources of ambient particle pollution (PM) requires extreme efforts because the source mix becomes complex nature in urban areas. Dense spread of unorganized fugitive and nonducted area sources, and lack of inventory about the regional and long-range elevated emission sources have intensified the problem of the identification of predominate sources.
Studies have been carried out for the identification and apportionment of sources in rural and urban areas of India (Bangar et al., 2021; Gargava and Rajagopalan, 2015; Goyal et al., 2021; Police et al., 2016). Research in source apportionment of particle pollution has been effective and successful with the application of United States Environmental Protection Agency (USEPA) receptor modeling techniques (i.e., chemical mass balance and Positive Matrix Factorization [PMF]) by the input of chemical speciation data (Belis et al., 2019; Shandilya and Khare, 2014; Liu and Gong, 2020). However, until recently, notable limitations were observed in the source apportionment studies, such as (1) a small sampling number was mostly used to cover the large urban areas and by representing all the landscape patterns; (2) chemical speciation analysis convergence was typically related to the regional level (i.e., little attention on local sources), which have high spatial variability; and (3) the studies rarely focused for land use specific and urban residential areas, which are encircled by current urban activities, mixed and localized sources.
The present work aims to address the spatiotemporal representativeness and sources apportionment of PM2.5 for a residential area in the urban region of Lucknow, the state capital of Uttar Pradesh, India. Many residential areas of Lucknow are encircled by multiple air pollution sources due to land use diversification with urban settings. Lucknow was declared as one of the nonattainment cities in India with respect to a continual breach of ambient PM2.5 than its national standard (CSIR-IITR, 2023; Ganguly et al., 2020; Sharma et al., 2023). A few studies only reported the key factor influencing the concentration of PM2.5 at residential sites in Lucknow and also rarely conducted studies on source apportionment of PM in the city (Barman et al., 2008; CSIR-IITR, 2023; Kumar et al., 2017). Furthermore, limited studies were carried out on source apportionment of urban landscape-induced fine particle pollution and their spatial representativeness for an urban residential site.
To address these issues in Lucknow, an investigation is attempted to understand spatial dissemination and intraresidential site variability of PM2.5 and identify, characterize, and quantify the potential local sources that influence PM2.5 levels of a residential site in Lucknow. The research has the urge to design the upcoming source apportionment studies with respect to landscape patterns as the prime focus.
Materials and Methodology
Study site
A reconnaissance survey was carried out in Lucknow city and identified a representative urban residential area that is encircled by four major city roads and continually experienced by typical urban activities. Sampling network of four locations, viz. L1: DIET-college, L2: DCP-office, L3: Colvin-College, and L4: State-Police-Force-Training-Center, which exist ∼100 m to 200 m distance from the road loop circumference to the residential area are chosen. The four sampling sites are considered representative receptors of the study area to understand the likely impact of local air pollution sources that are laid along the road corridors as well as within the residential site. The residential area is laid out between the latitudes: 26°51′36.87″ N to 26°52′16.64″ N and longitudes: 80°56′12.11″ E to 80°57′25.30″ E, covering the entire area of 1.57 sq.km with periphery city road length of 5.65 km. The entire study area is constituted of different urban landscapes such as residential occupancy (∼65%), markets (∼11%), hotels/restaurants and offices (∼8%), and university/college/training centers (16%). Figure 1 illustrates the study area in Lucknow and the locations of sampling sites.
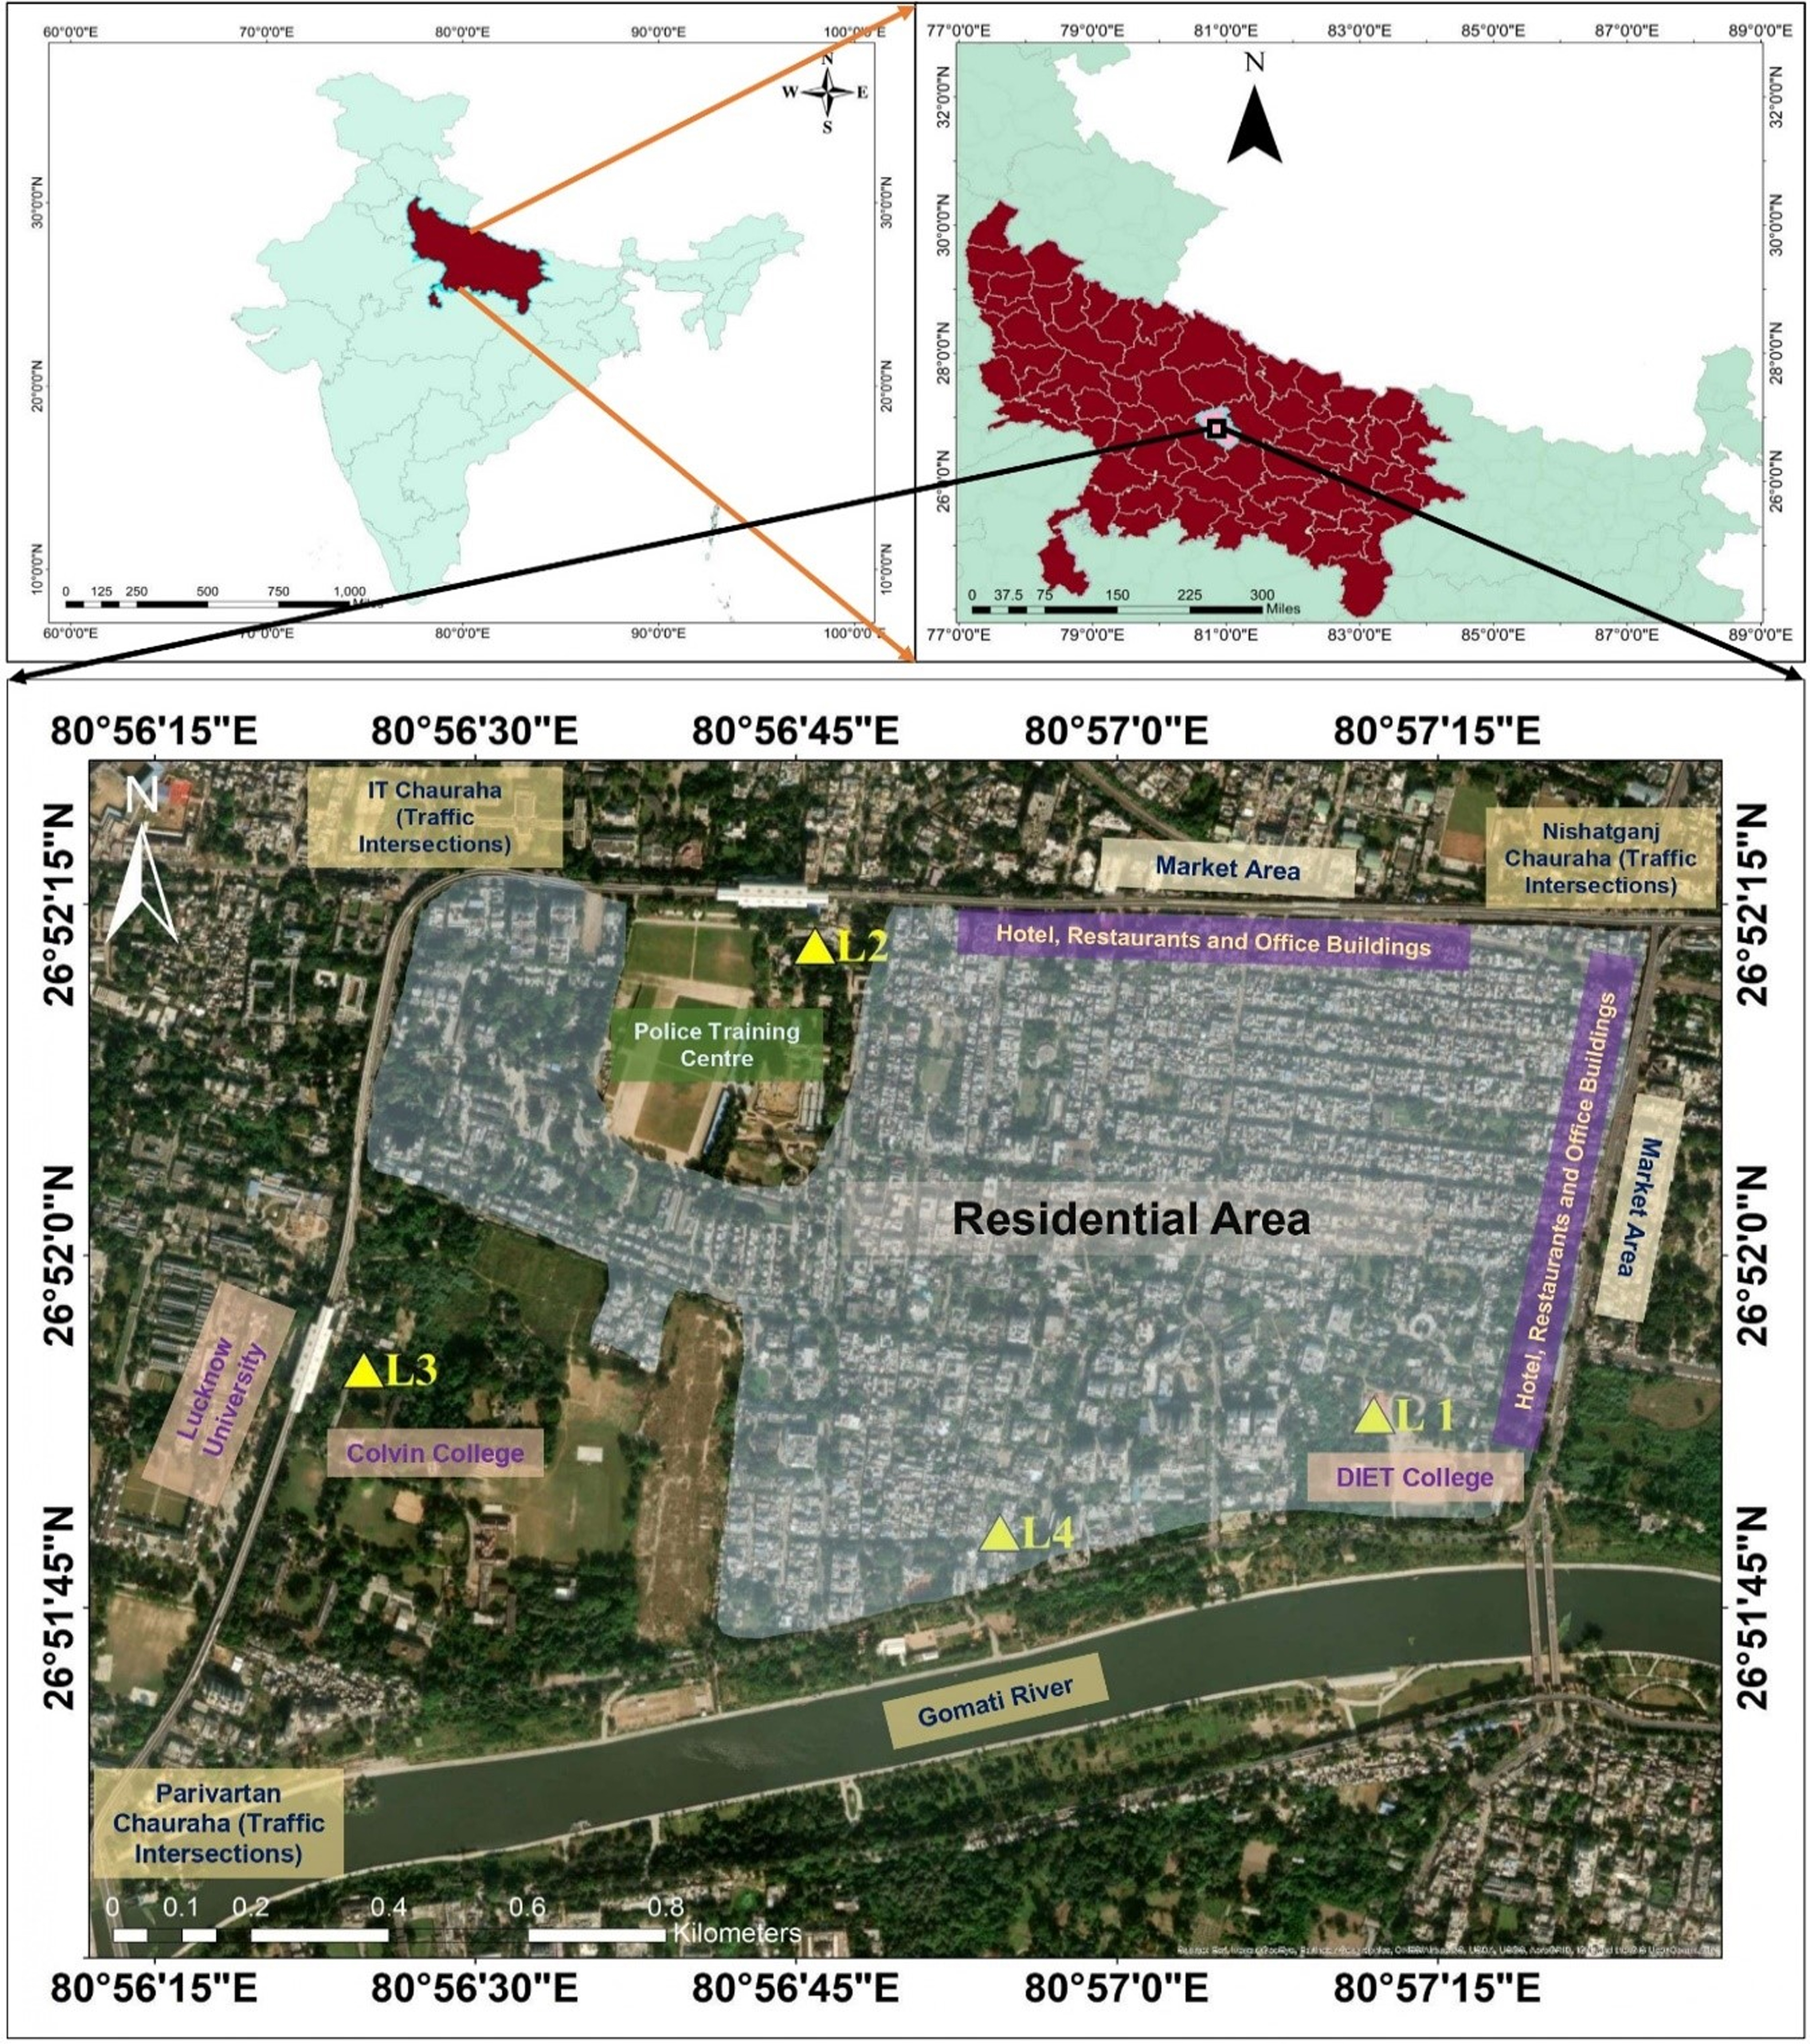
Sampling locations, land use, and land cover of the residential study area in Lucknow, India.
The traffic density of the roads adjacent to the sampling sites is divergent. The roads near L3 and L2 sites are arterial type (high traffic density road), the L1 site is near to subarterial (moderate traffic density) road and the miner local (low traffic density) road is near to L4 site.
Field sampling
Simultaneous sampling was carried out for ambient PM2.5 at four locations during the business days in the mid-winter season (i.e., from December 24, 2021, to January 08, 2022). Sampling was scheduled for 12-h intervals every day (i.e., daytime: 8 AM to 8 PM and nighttime: 8 PM to 8 AM) to cover the day as well as the nighttime influence of urban activities at the residential site. The inlet air flow of 1 m3/h was passed through a 47 mm Quartz fiber filter substrate, which was placed in the fine dust sampler (Model APM 550 of M/s. Envirotech Pvt. Ltd., India), to collect samples of PM2.5 from ambient air. The instrument was placed above 3 m from the ground and filters were baked, desiccated, and preweighed before sampling. The concentration of PM2.5 was calculated with the standard gravimetric method by using the fine dust mass collected on a filter and suctioned air volume for a 12-h sampling period, which was reported in μg/m3 (Central Pollution Control Board [CPCB], 2013; Jain et al., 2020).
PM2.5 data and chemical speciation analysis for source apportionment
Mass concentration analysis of PM2.5 was performed based on the Bureau of Indian Standards method (IS 5182 part 24, 2019 for PM2.5). A comparative assessment of PM2.5 levels between four sampling sites was carried out. Besides, Arc-GIS (Version-10.4.1) computational tool-based inverse distance weighing (IDW) simulations were carried out with site-specific day and nighttime PM2.5 observations measured at four sites. IDW technique executes spatial interpolation to estimate values for unobserved sites based on the sample size and known values from observed sites. IDW model predicts the propagation of air pollution spatially and geo-mapping the hotspots over the study area for the representativeness of air quality. Besides, the IDW air dispersion model application interprets the likely influence of site-specific sources, with respect to air pollution concentrations from observed to unobserved sites by isopleth view (Arif et al., 2015; Kumar et al., 2023; Wong and Lu, 2008).
Quality assurance and quality control and other details regarding the mass measurement calculations are rigorously followed as per details reported in Gupta et al. (2021). Furthermore, sample preparation and chemical speciation analysis for PM2.5 samples were also carried out according to the procedures cited in previous research work (APHA, 1977; Camilleri et al., 2022). Inductively coupled plasma mass spectrometry and ion chromatography of the CSIR-IITR analytical facility were used to quantify the concentration of 26 elements (viz. As, Be, B, Se, Sr, Ti, V, Mo, Ba, Fe, Co, Li, Na, Mg, Al, Ni, Cu, K, Ca, Cr, Mn, S, Cd, Zn, Sn, and Pb) and 5 ions (viz. Cl−, F−, SO42−, NO3−, and NH4+), respectively. CPCB (2007) method is followed for the elements and ion species analytical conversions with respect to the dilution factor for PM mass closure. The speciation database of the total of 64 PM2.5 samples (16 samples from 4 sampling sites covering day and night timings) for this study has the statistical significance to further perform the receptor modeling for source apportionment.
Environmental Protection Agency development of multivariate factor analysis technique PMF version 5.0 as receptor model (PMF v5.0) was applied by the input of chemical speciation database of PM2.5 samples for identifying and quantifying the relative contribution of different sources at four sampling sites individually. Furthermore, the PMF run was also carried out with a single speciation dataset by pooling together from all the different sites for representative sources' apportionment to PM2.5 in the study area. Ten percent of the filters from each batch were kept as blank and tested for the presence of ions and elements. Additionally, 10% of the samples were repeated for chemical analysis and the variability therein was used to propagate uncertainty, which was used as one of the input matrices for PMF5.0 source apportionment (Jain et al., 2020; Polissar et al., 1998). PMF model discerption and application details are broadly described in the previous studies (Belis et al., 2013; Cesari et al., 2016; Kim and Hopke, 2008; Manousakas et al., 2017; Sharma et al., 2016).
Reconstructed PM mass was calculated using IMPROVE equation (Chow et al., 2015). PM mass reconstruction has been done to investigate the mass closure between the sum of measured chemical species and gravimetric mass, with assumptions to account for unmeasured species but without double counting.
Results and Discussion
The concentration of PM2.5 at four sampling locations and its variation during daytime and nighttime are demonstrated in Fig. 2. Maximum PM2.5 concentrations were recorded during daytime at L3 (184 μg/m3) and L2 (165 μg/m3) sites in comparison to L1 (143 μg/m3) and L4 (131 μg/m3) sites due to nearby arterial-type roads, highways, and traffic intersection bottleneck emissions prevailing at L3 and L4 sites. Furthermore, mean PM2.5 was recorded as highest during daytime at L3 and lowest during nighttime at L4 with 166 μg/m3 and 76 μg/m3, respectively, because of the diversity of site-specific sources' dominance. However, the 24-h mean concentration of PM2.5 breached the CPCB limits of 60 μg/m3 at all four sampling sites. Besides, daytime PM2.5 levels were observed comparatively major than nighttime by virtue of local activities, such as trash combustion, construction/demolition (CD), domestic and open cooking, diesel generator (DG)-set run, etc. and are active majorly during the daytime.

Concentration of PM2.5 at sampling locations. CPCB, Central Pollution Control Board; DCP, Deputy Commissioner of Police; DIET, District Institute for Education and Training; PM, particulate matter.
The influence of local sources' emission impact on ambient PM2.5 at four sampling sites to the nonsampling sites of the study area was estimated through the ArcGIS interpolation IDW technique (Fig. 3). The change in the spatial distributions of PM2.5 during day and night in the study area was found significant with reference to measured PM2.5. The propagation of equivalent measured PM2.5 values from observed to unobserved sites ranged between 200 m and 500 m during daytime and nighttime, respectively. Because the study simulations have the influence of weighted average of high spatial variability in PM2.5 that occurred between four sites more during daytime than the night. This makes an appearance that the dense source mix of daytime in the study area affects PM2.5 concentration significantly large than the sparse source mix of the night.

ArcGIS-inverse distance weighing model propagations of PM2.5 concentration during daytime and nighttime in the study area.
Furthermore, the IDW model results present better representativeness of consistent PM2.5 patterns during nights than days. The diversity in the distribution of PM2.5 concentration between day and night can be attributed to diurnal and nocturnal specific air pollution activities and source mix that spread around as well as within the study area.
To investigate the ambiguity of source mix contribution to air quality in the residential area, air pollution sources identification and apportionment were carried out. USEPA PMF v5.0 software modeling was run by the input of elemental and ion composition for diurnal PM2.5 samples. Table 1 summarizes 24 h averaged concentration of PM2.5 and the mean analytics of 26 elements and 5 ion species in PM2.5 samples that were collected during the day and nights at respective 4 monitoring sites in the residential area. With respect to grouping the order of chemical speciation data as well as their average to below-average concentrations, speciation correlations were done to identify the relative local sources in the study area.
Chemical Speciation Analysis of PM2.5 Samples at Four Sampling Locations
PM, particulate matter.
The application of the PMF model identified the different urban sources around the residential site and their contribution to PM2.5. In the present study, boot-strap analyses of PMF were used and estimated the choice of optimal seven factors. The robustness and stability of the factors were assessed in terms of the ability to reproduce the gravimetrically measured PM2.5 mass (Kumar and Raman, 2020), the presence of marker species in each factor, and diurnal trends. First, individual PMF run outcomes of chemical speciation profiles and relative percentage contribution to seven factors for each sampling site are shown in Fig. 4. Furthermore, the resultant seven different sources' emission contribution to PM2.5 at four respective sampling sites are delineated in Fig. 5.

Composition and abundance of chemical species in PM2.5 to the seven factors that resulted from PMF run at four sampling sites separately. PMF, Positive Matrix Factorization version 5.0-as receptor model.
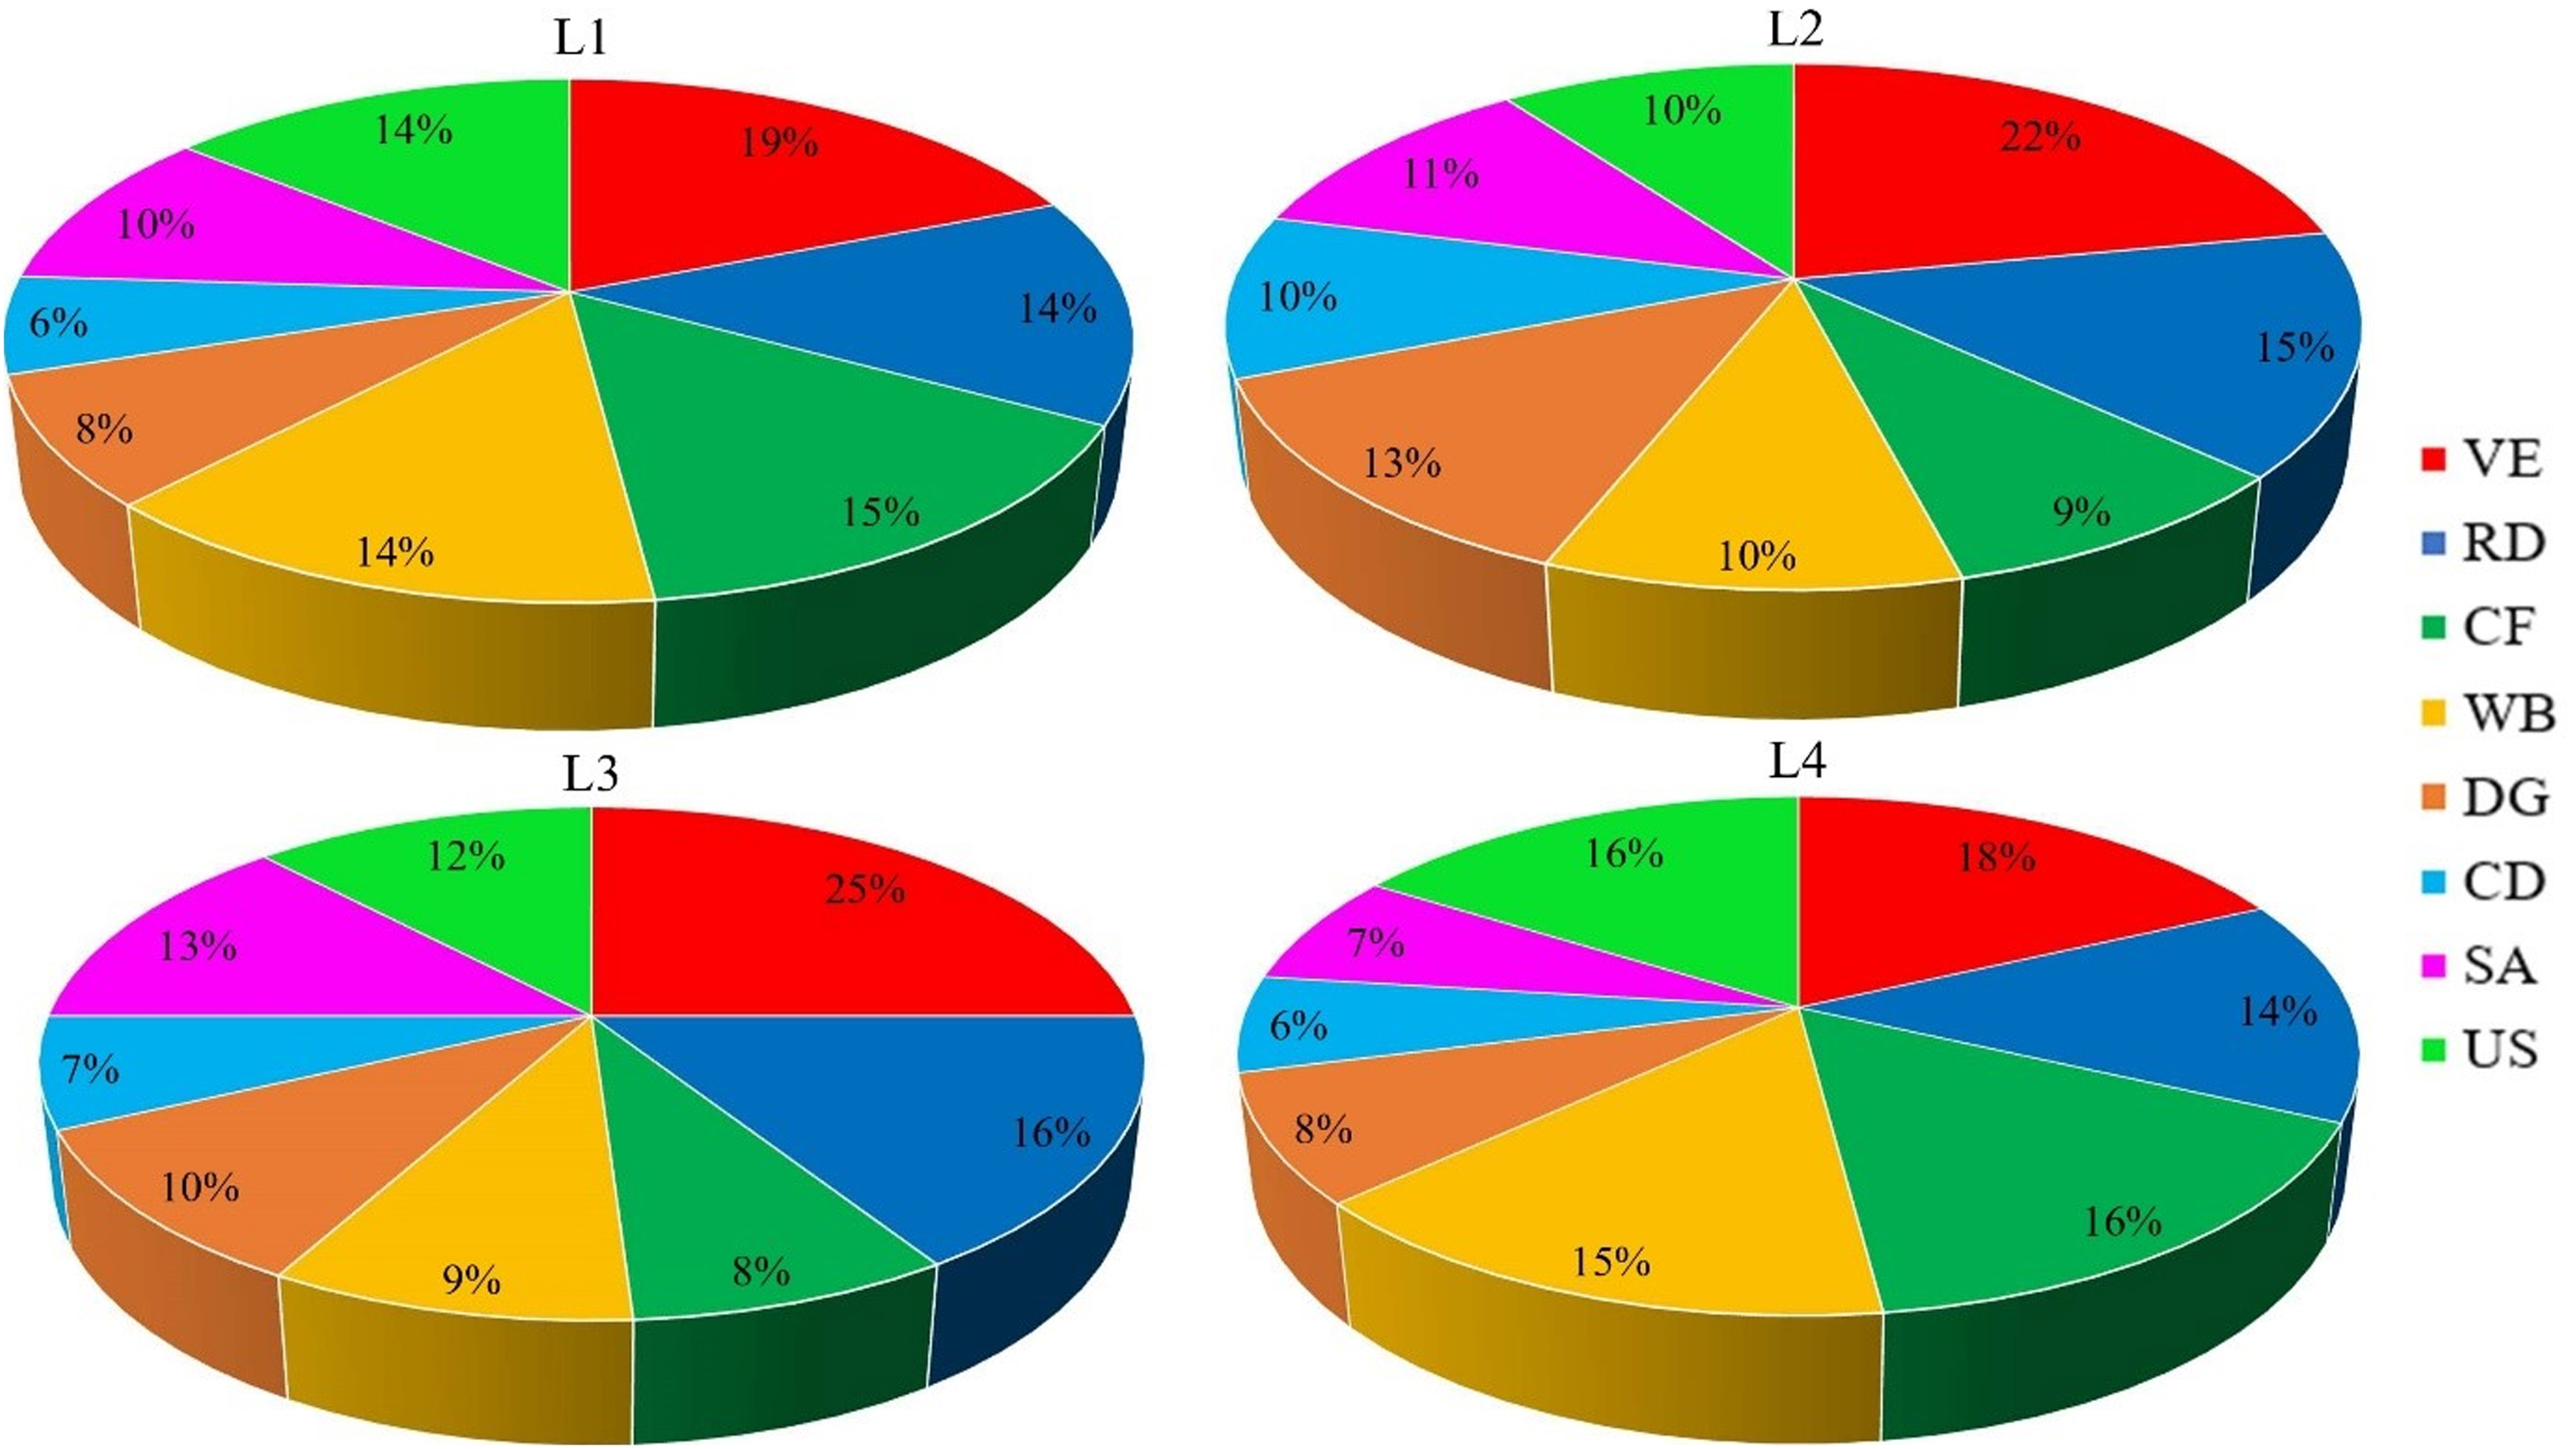
Sources contribution to PM2.5 at four sampling sites separately in the residential study area. CD, construction/demolition; CF, cooking fuels; DG, diesel generator; RD, road dust; SA, secondary aerosols; US, unaccounted sources; VE, vehicular exhaust; WB, waste burning.
Factor-1 was characterized by the highest concentration of Zn, Cu, Pb, and Mn, which defines the vehicular exhaust (VE) (Kar et al., 2010 and Sharma et al., 2016). The chemical species of VE contributed in PM2.5 was found as markers with a maximum at L3 (25%), followed by at L2 (22%), and subsequently at L1 (19%) and at L4 (18%). The contribution of VE to the residential study site is turned up as a major source due to the regular traffic bottleneck on the peripheral road loop. Past source apportionment studies for urban areas in India also reported that traffic emission influence about 20%–60% to PM2.5 at near-road residential sites and listed as a major air pollution source (CPCB, 2018; Negi et al., 1987; Sharma et al., 2014; Shridhar et al., 2010).
Re-entrained road dust (RD) or soil dust chemical profiles that is, Ca, Fe, Mg, and Al are found high in a group under Factor-2 for the sampling sites. Begum et al. (2006), Lough et al. (2005), and Sharma et al. (2014) studies also identified these groups of elements abundant in ambient particle pollution due to the dust entrainment source. In the present study, dust from the road loop with continuous traffic movement around the residential site that has a significant contribution to the fine PM samples, which are identified as higher at L3: 16% and followed by L2: 15%, and L1 and L4: 14%. The resuspended RD contribution to ambient PM, specifically for residential sites of urban areas in India, was identified with a range of 15% to 20% (CPCB, 2018; Manchanda et al., 2022).
Chemical species of Al, Se, Zn, S, Cr, and SO42− in PM2.5 samples were found abundant under Factor-3. The species combination defines the characteristics of emission from cooking fuels (CF) such as LPG, wood, and coal. Roadside street vendors, near hotels, restaurants, and bakeries, and residential domestic cooking in the study site are the causing factors of CF combustion, which contributed to ambient PM2.5. The significant contribution of CF emission to PM2.5 at each sampling site is observed by PMF model and found L4 (16%)>L1 (15%)>L2 (9%)>L3 (8%). In addition to the CF emission, there is a likely effect of near riverside crematorium activities on sampling sites. Similar mean level of CF combustion contribution to ambient PM2.5 of the residential sites was also found by CPCB (2018), Manchanda et al. (2022), Sharma et al. (2016), and Srivastava et al. (2009).
Factor-4 prevailed with a group of NH4+ and SO42− in PM2.5 samples of the study site, which indicated the emissions of waste burning (WB) (Khare and Baruah, 2010; Manchanda et al., 2022; Sharma et al., 2016; Wu et al., 2007). A major contribution from trash combustion emission to PM2.5 was found at L4 (15%) and L1 (14%) and followed by moderate influence observed at L2 and L3. The L4 and L1 sites have exposure from nearer community trash bins where local waste combustion exists. Trash combustion emission contribution to ambient particulate matter at the urban residential site was also reported at about 15% (Kumar et al., 2017; Pant et al., 2012).
Factor-5 is identified as the emission of DG set for having determined concentration of markers Cd, Cr, and V in PM2.5 samples (Nihalani et al., 2020; Shridhar et al., 2010). The residential area is also encircled by fuel stations, hospitals, and commercial offices which operate the DG-set on the standby power requirement. The contribution from DG-set emissions to PM2.5 was recorded as 13% at L2 and followed by L3 (10%), L4 (8%), and L1 (8%). DG set emission contribution to airborne fine PM was also observed in earlier studies with a range of 8%–20% (Sharma et al., 2016).
The significant association of Fe, Pb, and Ni elements under Factor-6 refers to the emission of CD activities (CPCB, 2017; Kulshrestha et al., 2009). This source contribution to PM2.5 samples was found to be maximum at L2 (10%), followed by L3 (7%), L4 (6%), and L1 (6%), respectively. The surrounding region of the L2 location has ongoing CD activities of the residential houses and a few shops in the near market. Source apportionment studies of CPCB (2018) for different Indian cities had also reported that the CD effect on particle pollution is significant.
Factor-7 represents the SA as a combination of abundant markers is NO3−, SO42−, and NH4+. The study area has the source mix of waste dumps, refuse burning, fuel combustion by DG-sets and vehicles, which emits primary precursors like ammonia, oxides of nitrogen, and oxides of sulfur in the atmosphere and consequent in SA formation in the presence of sunlight (Srivastava et al., 2022). Maximum contribution of secondary aerosol was found at L3 (13%) followed by L2 (11%), L1 (10%), and L4 (7%). Similar contributions of SA values to the residential areas were observed by Jain et al. (2020) and Sharma et al. (2016).
Besides, the PMF run output by the input of a speciation dataset that pooled from PM2.5 samples of all four sampling sites has also resulted in seven optimum factors/sources
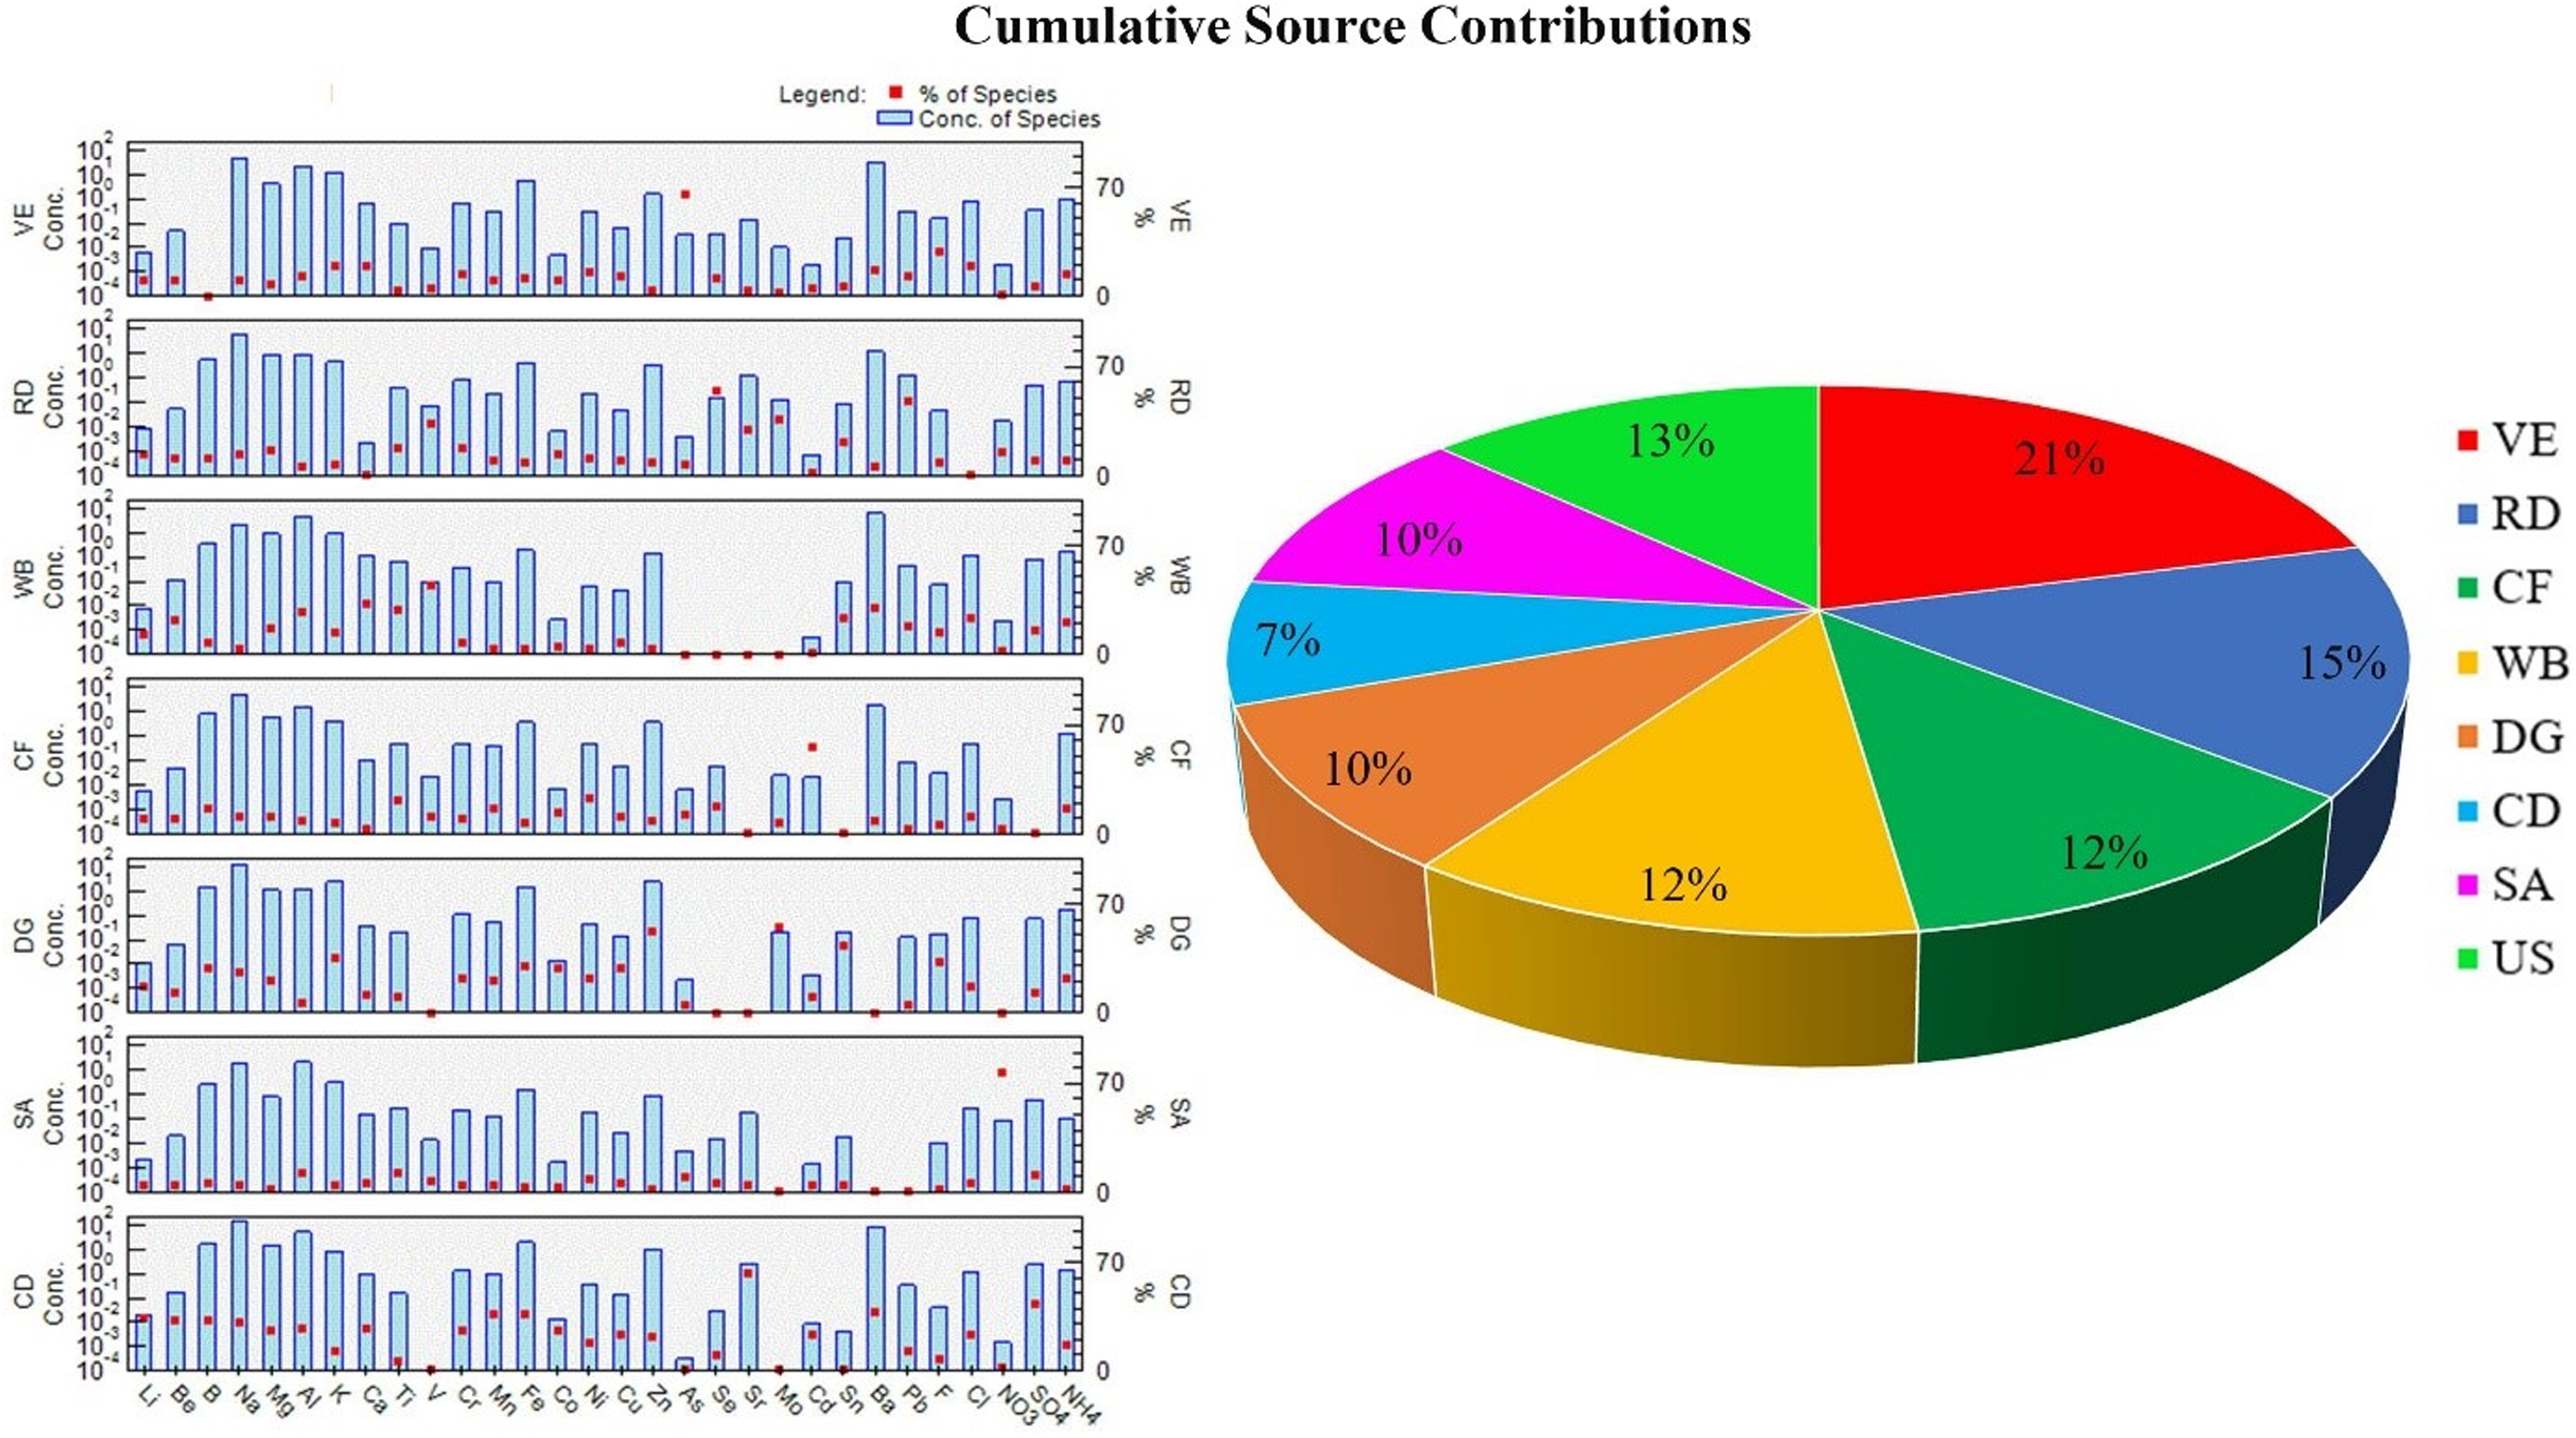
Composition, species abundance, and apportionment of seven identified sources to PM2.5 in the study area that resulted by the input of pooled speciation dataset in PMF run.
Overall, significant surplus chemical species of PM2.5 samples were observed in the PMF runs and the species group was specified as an unknown factor. The apportionment of the unknown factor at four individual sampling sites was found between the 10% and 16% range, and also a maximum of 13% contribution is observed to PM2.5 as an integrated assessment in the study area. The unknown factor that contributed to PM2.5 mass is likely to be the surrounding sources of carbonaceous aerosols, activities of small- to large-scale industries and crematoria combustions in the vicinity of the residential study area, and long-range transported dust and smoke fugitives. The significant apportionment of unknown/unidentified sources to the residential area was also described in previous studies (Jain et al., 2020; Sharma et al., 2016).
Conclusion
The present study quantified the apportionment of air pollution sources to PM2.5 particles for a residential site in Lucknow city, which is surrounded by the road loop and other urban activities along the corridors of the roads as well as within the residential study area. Among four air monitoring locations in the residential study area, the recorded concentration of PM2.5 was observed comparatively higher at two locations (L3 and L2). Furthermore, PM2.5 levels were noticed much higher during the day than at nighttime. The reason for the spatiotemporal discrimination of PM2.5 in the residential area is because of the multiple nonuniform distributions of localized source mix and encircled road corridor bottleneck emissions. The IDW simulations predicted the likely representativeness of PM2.5 in the study area. The propagation of PM2.5 was estimated for a significant distance from observed to unobserved sites, and it is also found different for the day as well as night periods. The radical change in PM2.5 was found due to the active function of diurnal and nocturnal specific air pollution sources that were laid in and around the study area.
Therefore, the attempt at site-specific and overall area base PMF model runs by the input of chemical speciation analysis data of diurnal PM2.5 samples identified seven factors. The source characterization was determined based on the correlation between the abundant group of chemical species of PM2.5 that contributed to the respective factors. The seven factors characterized the dominant sources as VE, RD entrainment, CF emissions, trash burning, DG set exhausts, SA, and CD dust. The PMF model outputs discovered the apportionment by the seven localized sources to ambient PM2.5 at all four sampling sites.
Overall, the identified mean apportionment of sources to PM2.5 of the residential study area is: VE—21%, road resuspended dust—15%, CF emission—12%, WB—12%, DG sets exhaust—10%, SA—10%, and Construction and Demolition—7%. Besides, a maximum of 13% mean contribution to PM2.5 was also observed and acknowledged for unaccounted sources that exist in the vicinity of the residential study area. Short sampling duration and unaccounted carbonaceous aerosols in PM2.5 speciation analysis are key limitations of the study and therefore considered an unaccounted source separately in the PMF results of the study.
Transboundary pollution affects, sources of carbonaceous aerosols, activities of small to large scale industries, and cremation in the near vicinity of the study area, are likely representing unaccounted sources in the study. This study revealed that the urban-specific local sources' indispensability is the major cause for facing ineffective air pollution abatement measures in urban areas. The study also encourages urban landscape-specific source apportionment research for the identification and quantification of the predominant local source mix for urban air quality management.
Footnotes
Acknowledgment
The authors acknowledge DSIR-CRTDH and Analytical Division at CSIR-IITR for providing instruments for sample collection in the field and chemical analysis in the laboratory, and data analysis and software computational modeling works of the current study.
Authors' Contributions
S.B.: Design of the research objectives, methodology, and results of the research, conceptualization, supervision of field and laboratory works, and writing—original draft, reviewing, and editing; S.S.K.M.: Field samples' collection, laboratory analysis of samples, data analysis and computational modeling, and editing of draft article; H.O.P.: Field samples' collection, laboratory analysis of samples, data analysis and computational modeling, drafting figures and tables, and editing of draft article; A.H.K.: Reconnaissance survey for selection of study area, instruments' calibration and set-up in the field and supervision for field monitoring and laboratory analysis works, and reviewing draft article; and G.C.K.: Supervision for field monitoring and laboratory analysis works, facilitation of instruments for the study, and reviewing draft article and editing.
Ethics Approval
Ethics and Scientific Vigilance Committee (SEC), CSIR-IITR has reviewed and evaluated this article and allocated publication number: IITR/SEC/MS/2022/107.
Data Availability Statement
The datasets and data analysis of the current study are reporting the original research, and most of them are already included in this article. However, all the raw-data pertaining to the article are available from the CSIR-IITR institutional repository/archives with file name ‘SreeaknthB_Pollution.rar under publication number: IITR/SEC/MS/2022/107.
Author Disclosure Statement
No competing financial interests exist.
Funding Information
The study was approved by the Research Council and Director of CSIR-IITR and financially supported by CSIR under the budget heads of MLP-022 project.