
Abstract
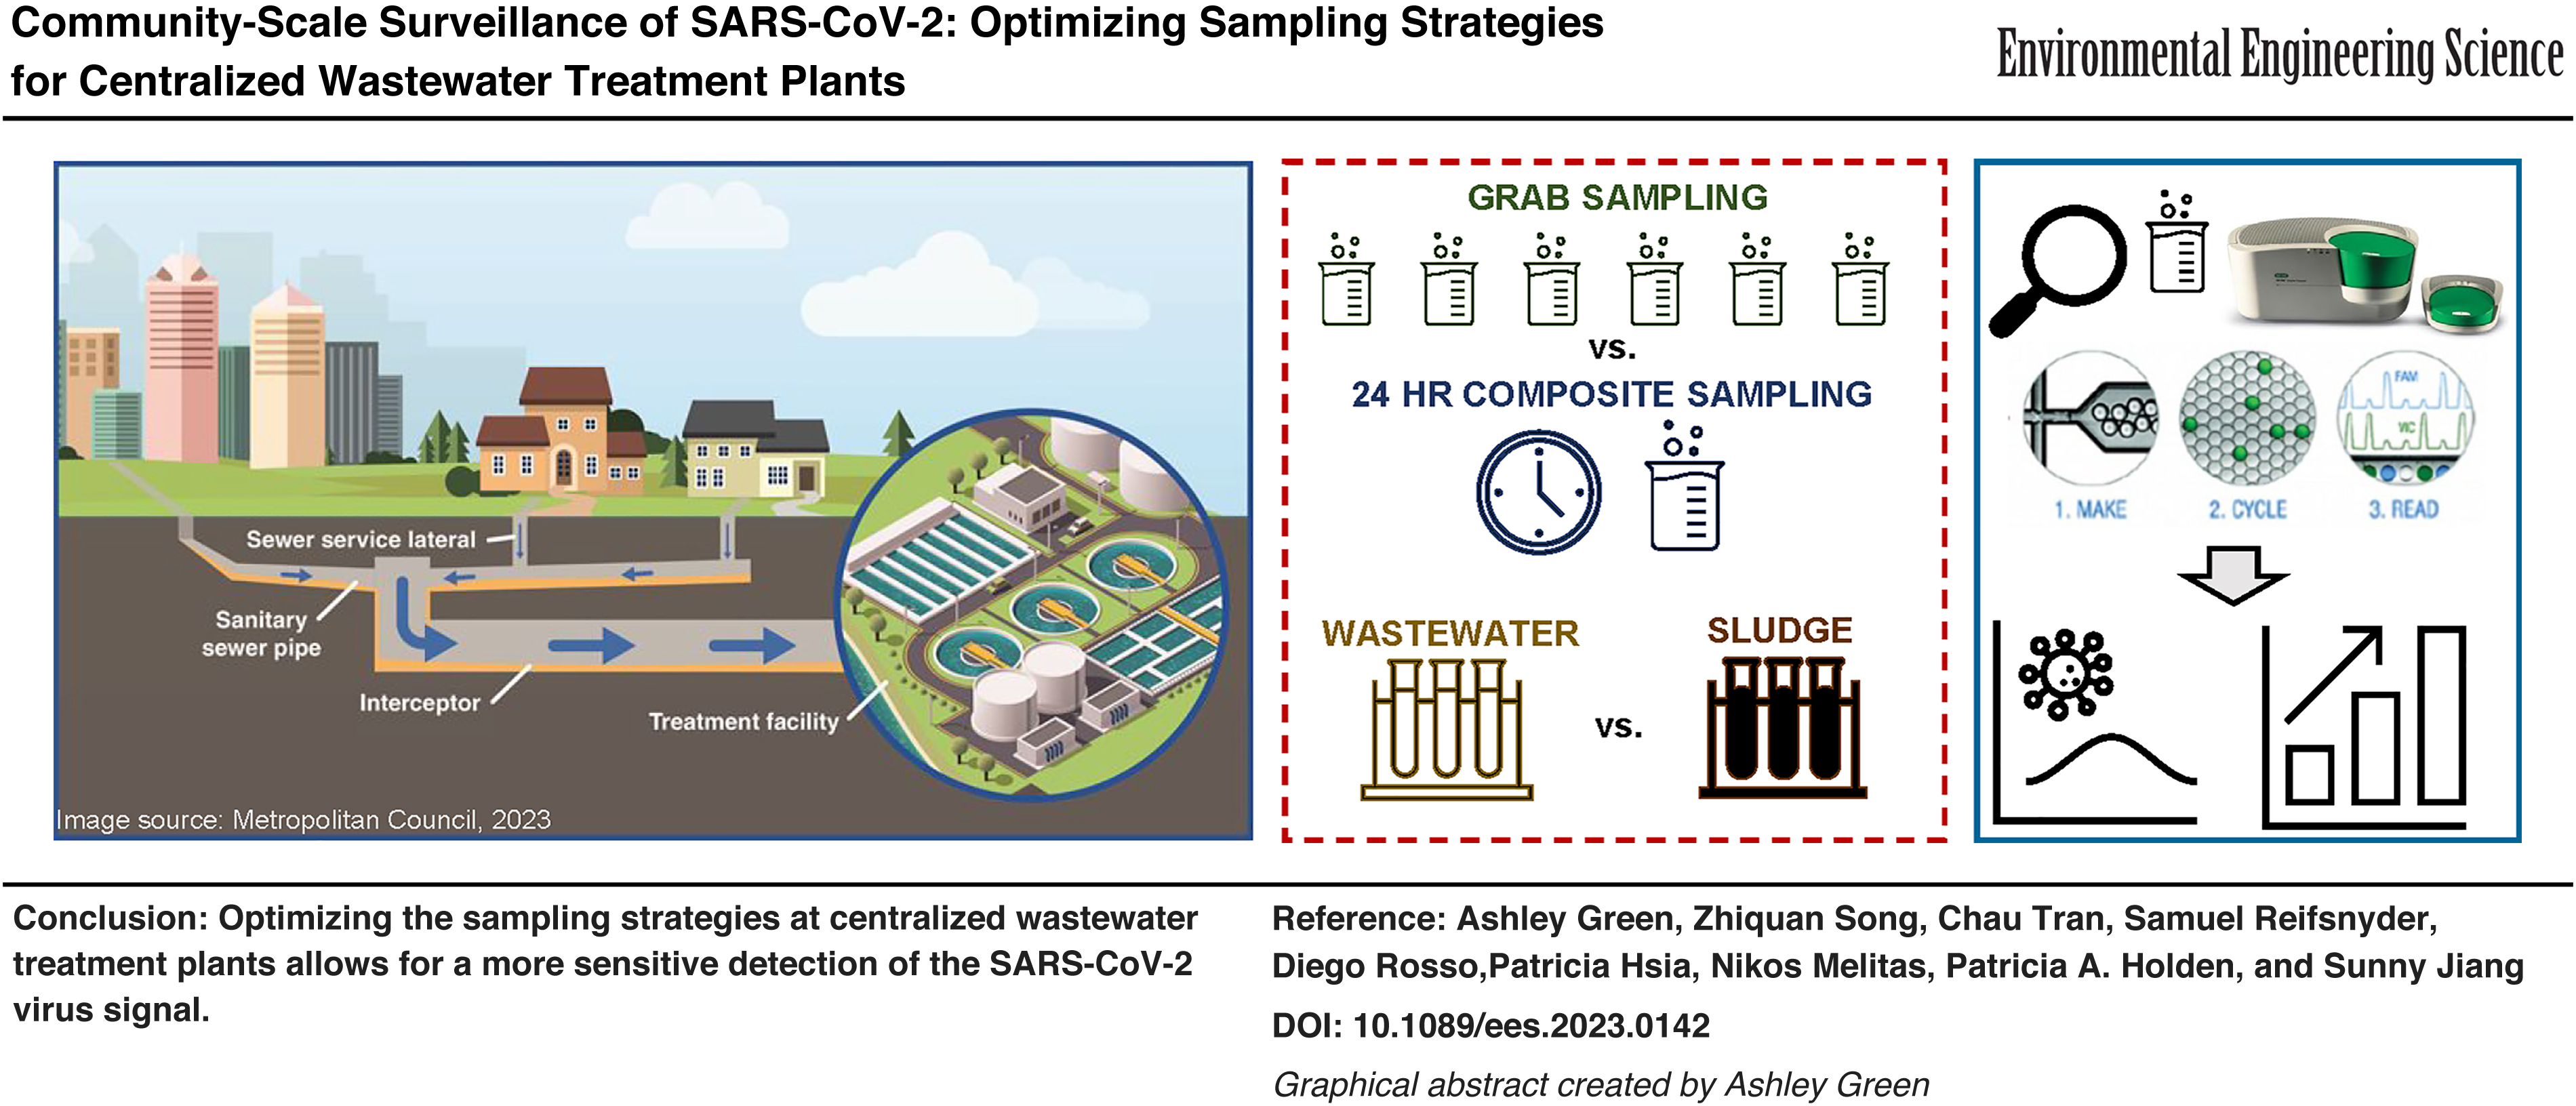
Wastewater-based surveillance (WBS) for SARS-CoV-2, the virus that causes COVID-19, is a complement to clinical testing that can provide an early warning of community infection. Applying WBS to centralized wastewater treatment plants (WWTPs), otherwise known as water resource recovery facilities, provides an opportunity to collect unbiased viral load information at the community scale. This study focuses on optimizing the sampling strategies from centralized WWTPs to best capture the signal of SARS-CoV-2 in wastewater. From November 2020 to February 2021, a total of 166 grab and 24-h composite wastewater and sludge samples were collected from 3 WWTPs in the Los Angeles (LA) County, with significant differences in size, service area, wastewater composition, and treatment technologies. Results showed that 24-h composite primary influent samples can best represent the trends of SARS-CoV-2 genome concentrations in centralized WWTPs, whereas grab samples showed significant variations in SARS-CoV-2 genome concentrations over a 24-h period. Primary sludge samples showed one log10 higher concentrations of SARS-CoV-2 genomes when compared with primary influent samples. The SARS-CoV-2 genome concentrations in primary influent samples ranged from 2.69 × 10² genome copies (GC)/mL to a high of 4.50 × 10³ GC/mL. The virus concentrations in primary sludge ranged from 6.00 × 10³ to 9.67 × 10⁴ GC/mL. Ultimately, the SARS-CoV-2 genome concentrations in wastewater and sludge collected from large centralized WWTPs were correlated, and both reflected the general trend of COVID-19 cases in the broader LA metropolitan community.
Introduction
Wastewater-based surveillance (WBS) of SARS-CoV-2 has been used since the start of the COVID-19 pandemic to support clinical testing efforts and to better understand COVID-19 trends and its spread within communities (Ahmed et al., 2020; Kitajima et al., 2020; La Rosa et al., 2020). Unlike clinical testing data, which are susceptible to biases such as test availability and willingness of asymptomatic individuals to participate in the testing (Mizumoto et al., 2020; Nishiura et al., 2020), WBS yields a relatively unbiased community-scale viral load estimate for a wastewater treatment plant (WWTP) catchment population.
Considering these benefits, there has been much support for WBS to complement clinical testing in response to the COVID-19 pandemic (Center for Disease Control and Prevention, 2022). WBS continued over time in major WWTPs has the potential to detect the resurgence of COVID-19 at the community level, which could facilitate the prioritization of communities for interventions (Sangsanont et al., 2022; Song et al., 2021).
However, the composition of wastewater and the treatment configurations at WWTPs are highly variable, and thus, where sampling occurs and how well SARS-CoV-2 is recovered for quantification will likely vary accordingly. Wastewater composition, that is, the quality of raw wastewater entering a WWTP, is determined by (1) the source of the wastewater (i.e., proportion contribution of industrial, business, and residential discharge); (2) the size of the sewershed (i.e., service area, catchment, and population served); and (3) the diurnal and seasonal variations such as wet weather infiltration and inflow that can impact water quality parameters owing to dilution effects. Further each WWTP differs in the physical unit processes applied to achieve both preliminary and primary wastewater treatments.
Such variations also affect the recovered SARS-CoV-2 content from samples taken along this most upstream treatment train, since losses of viruses with treatment are determined by the details of unit process designs and operations. Because of such potential variations, it is necessary to design sampling strategies that can best capture a representative signal of SARS-CoV-2 in wastewater to use it as an inference for the community COVID-19 epidemic. This research focused on the large metropolitan area of Los Angeles (LA) County; the WWTPs investigated are all within the jurisdictional boundaries of the Los Angeles County Sanitation District (LACSD). The LACSD has a total of 11 WWTPs that serve nearly 6 million people.
These facilities range in influent flow from 0.2 million gallons per day (MGD), serving a few 100 households, to large WWTPs with a dry weather capacity of 400 MGD capacity and wet weather capacity of up to 675 MGD that serve several million people. For this study, we chose WWTPs that were diverse in size and configurations to optimize the study coverage of varying SARS-CoV-2 signals. WWTPs of large, medium, and small size were selected with influent wastewater flow compositions ranging from purely residential to mixed municipal-industrial. In addition to variable wastewater composition, the study was designed to compare composite primary influent samples with grab samples and primary sludge samples whenever available.
Previous work acknowledges the diurnal variability of flow and residential contributions of wastewater to WTTPs, and the intraday variability of virus signals at WWTPs, thus suggesting the benefits of 24-h composite sampling (Ahmed et al., 2021a; Bivins et al., 2021; Gerrity et al., 2021). Others found no significant differences between the mean SARS-CoV-2 concentrations from grab samples versus 24-h composite samples (Augusto et al., 2022; Kopperi et al., 2021). A comparison of results from several research laboratories indicated that primary solids can have virus concentrations up to three orders of magnitude higher than concentrations in wastewater (Carrillo-Reyes et al., 2021; Chakraborty et al., 2021; D'Aoust et al., 2021; Graham et al., 2021; Kim et al., 2022; Kitamura et al., 2021; Mantilla-Calderon et al., 2022). However, such comparisons are mainly within a single WWTP, or within a single sample type across several WWTPs.
Moreover, the comparison of results from solids and liquids was not the focus of most of the studies but was presented as an anecdotal finding. A review of more than 80 articles published between late 2020 and June 2023 on SARS-CoV-2 WBS (Supplementary Table S1) suggests that more than half of the reports used composite sampling, especially for large wastewater utilities, with an increasing trend of composite sampling in the more recent reports. This is likely due to the ramp-up of installation of autosamplers at study sites in comparison with the rapid response mode in the early part of the pandemic. However, very few articles adopted sludge sampling as a strategy for detection of SARS-CoV-2, even at the periods of low prevalence. This suggests that the benefits of sludge sampling have not been fully realized by the community.
Therefore, there is still a need for a systematic analysis of the benefits and trade-offs of sampling strategies to help this research community to make future decisions for WBS practices.
What has been heretofore lacking is an orthogonal study that evaluates, for a common geographical vicinity with in-common COVID-19 case data, how differences in sampling location within WWTPs compare with differences in samples (acquired from similar within-plant locations) across WWTPs. Such understanding is needed to guide future WWTP sampling since, as is often the case, WWTPs in a clinically surveilled region vary with regard to preliminary and primary treatment design details. Knowing if such details are likely to bias SARS-CoV-2 WBS efforts is important to focus similar endeavors moving forward.
This study focused on systematically evaluating sampling strategies to best capture SARS-CoV-2 signals in wastewater in WWTPs that serve the same geographical region and to understand the spatial and temporal variability of these signals. Specifically, wastewater primary influent and primary sludge samples were collected and monitored for the SARS-CoV-2 N2 viral genome in either grab or 24-h composite influent samples, and in primary sludge samples. The concentrations of SARS-CoV-2 in different types of samples were compared and correlated with each other and other water quality parameters. The results of the study contribute to the understanding of the variability of the virus in different types of WWTPs of metropolitan regions, and how and where sampling within plants affects regional WBS across WWTPs.
Materials and Methods
Selection of WWTPs serving diverse sewersheds
This study was influenced by previous sampling efforts at WWTPs from varying contributing sewersheds in LA County (Song et al., 2021). WWTPs selected for this study were chosen based on sewershed and wastewater flow characteristics as these contribute to differences in influent qualities for which the WWTP design could account for. Thus, we used upstream collection system characteristics to determine which WWTPs would be representative of flow magnitudes (low to medium to high) and likely compositions (residential to mixed to industrial) of wastewater in the region.
In the selection of sewersheds, we considered the following criteria: (1) the sewersheds should represent diverse types of wastewater collection systems for tracking the COVID-19 pandemic at different community scales; (2) a consistent sampling plan should be followed to maximize comparability between different sets of results; (3) the samples collected from WWTPs should be able to be processed as soon as possible to avoid shipping, handling, and preservation, which introduce additional variability and affect data quality; and (4) the samples should be analyzed using established methods in a consistent manner to avoid the bias introduced by methodological variability. Three distinctly different WWTPs within LACSD's jurisdiction were thus chosen based on these criteria and the characteristics of these WWTPs and the samples collected from each are shown in Table 1. IRB approval is not required for sample collection from the plants.
Description of Wastewater Treatment Plants and the Primary Influent or Sludge Samples Collected for This Study
Downstream WWTP collects wastewater sludge and overflow of wastewater from other upstream WWTPs in LACSD.
HPO-ASP, high-purity oxygen-activated sludge process; JWPCP, joint water pollution control plant; LACSD, Los Angeles County Sanitation District; MGD, million gallon per day; NDN, nitrification/denitrification;
Sample collection, transport, and storage
Biweekly samples were collected from each WWTP between November 2020 and February 2021. At the LACSD Joint Water Pollution Control Plant (JWPCP), 250 mL samples of primary influent were collected from the effluent port of grit chambers 3 and 4 (Supplementary Figs. S1 and S2) by grab sampling every 4 h over 24 h on each sampling date (six samples per day). In addition, 500 mL 24-h composite samples were also taken on the same sampling dates as wastewater grab samples from the same effluent port of grit chambers 3 and 4. Since grit chambers 3 and 4 receive around 80% of wastewater flow through the main trunk line to the plant, this composite sample was denoted as the “main composite.” The second 24-h composite sample, labeled as the “master composite,” was prepared manually on each sampling day to include wastewater conveyance from all trunk lines to the WWTP.
This master composite combined effluent from all grit chambers, including 3 and 4, and was prepared using volumes from each effluent port (Supplementary Fig. S2) proportional to the historical flows over a 24-h period (flow-weighted). Since different grit chambers receive flows from different sewer trunk lines, comparison between the two composite samples from the same plant could offer insight into the prevalence of SARS-CoV-2 in flows from different trunk lines.
Primary sludge grab samples at the JWPCP were collected from two wet wells that represented settled solids from the primary sedimentation tanks. Every 4 h over 24 h on each sampling day (six samples per day), 250 mL sludge grab samples were taken at the same frequency as the primary influent grab samples.
At San Jose Creek East (SJCE) water reclamation plant, 250 mL grab samples were collected similarly to JWPCP—every 4 h over a 24-h period on each sampling day (six samples per day). A 500 mL primary influent 24-h flow-weighted composite sample was collected from the same primary influent sample port on the same day when the grab samples were taken (Supplementary Fig. S3). Since there is no wet well at SJCE, primary sludge samples were grabbed from a valve of a sludge discharge pipe used for troubleshooting clogs (Supplementary Fig. S4). This pipe was periodically purged, and so, there were some instances when the “sludge” samples contained very low solid content and were mostly water (Supplementary Fig. S8).
Lastly, at La Cañada Water Reclamation Plant (LCWRP), 250 mL primary influent grab samples were collected after the influent grinding step since there is no primary sedimentation, and the raw influent after grinding moves directly to activated sludge treatment (Supplementary Fig. S5). Secondary, and chlorinated secondary, effluent samples were also collected to provide insight into this unique, smaller scale treatment process (Supplementary Fig. S5). These wastewater grab samples were collected less frequently than the other larger plants and only one grab sample was collected per day at each sampling location. Neither 24-h composite samples nor sludge samples were available from this plant since no autosamplers and grit chambers were installed.
All samples were kept at 4°C during compositing, storage, and transport. The samples were transported on each sampling day, in the morning, from the WWTPs to the University of California, Irvine (UCI) laboratory for analysis. A total of 166 samples were collected, and a breakdown of all the sample types and number of samples collected at each WWTP is shown in Table 1.
Sample analysis for SARS-CoV-2
Immediately upon arrival, the samples were homogenized and subaliquoted (250 μL) to 1.5 mL sterile tubes containing 750 μL of prealiquoted Zymo DNA/RNA Shield (R1100-250; Zymo Research) to prevent the degradation of nucleic acid. The preserved samples were processed for direct RNA extraction using the Zymo Quick-RNA Fecal/Soil Microbe Microprep Kit (Cat No. R2040) following the manufacturer's protocols with minor modifications as described previously (Song et al., 2021). There was no prior sample concentration step performed besides the concentration achieved at nucleic acid extraction step. More details regarding in-house protocol modifications for the Zymo extraction kit and recovery controls are detailed in Song et al. (2021). Alternatively, samples were stored at −80°C until extraction. The TaKara NecleoSpin RNA stool kit (TaKara) was also used for extraction of a portion of the sludge samples due to a supply chain delay of Zymo extraction kits.
Before adopting the new kit, a side-by-side comparison of SARS-CoV-2 genome quantification was carried out using nine primary sludge samples seeded with known concentrations of heat-inactivated SARS-CoV-2 (BEI Resources, Manassas VA) as quality control (QC) to validate no significant difference due to extraction methods and evaluate the recovery efficiencies for each type of samples(Supplementary Table S2). The corresponding average recovery efficiency for the specific sample type by a specific extraction kit was used to normalize the assay results.
The droplet digital PCR (ddPCR) method, as reported previously (Song et al., 2021), was used for quantifying the SARS-CoV-2 N2 gene in extracted samples. In brief, ddPCR was carried out on a QX200 ddPCR System (Bio-Rad, Hercules, CA) following the manufacturer's instructions. The reaction mixture was assembled from 2 × Bio-Rad Supermix for probes (no deoxyuridine triphosphate), primers (500 nM), and probe (125 nM) mix and template (variable volume) in a final volume of 20 μL. SARS-CoV-2 N2 primers and probe sets with 5′ 6-FAM (Fluorescein), (a single isomer derivative of fluorescein) labels (2019-nCoV RUO Kit) were purchased from Integrated DNA Technologies (Coralville, IA). The method was calibrated during an interlaboratory method comparison for SARS-CoV-2 detection (Pecson et al., 2021).
The detection limit of the ddPCR assay was set to three positive droplets per reaction based on a manual setting of the fluorescence threshold. This converts to a 300 genome copies (GC)/mL quantification limit when 4 μL of cDNA was used in the ddPCR. The lower limit of detection was set at 150 GC/mL based on background analysis. The details for calculating the viral concentration in original samples were reported by Song et al. (2021). JWPCP and SJCE samples spiked with heat-inactivated SARS-CoV-2 were used as internal QC. The average assay coefficient of variation is 9.46% based on serially diluted samples in a previous study (Song et al., 2021) and was used to calculate the error of the SARS-CoV-2 results from the ddPCR assay.
Water quality data collection
Water quality data associated with wastewater samples were retrieved from LACSD. These data included wastewater flow rate, total suspended solids (TSS), biochemical oxygen demand (BOD), chemical oxygen demand (COD), and ammonia (NHx-N) of primary influent. Since water quality data were not collected daily at each plant, the data collected on the date that was closest to the sampling date were used for correlation analysis.
There is no information collected for the sludge samples by LACSD. TSS in the sludge samples were measured at the UCI laboratory following the ASTM “Standard Test Method for Filterable Matter and Nonfilterable Matter in Water.” Tests were conducted using a 1 mL volume of sludge stored in a −80°C freezer.
Statistical analysis
Correlation analyses were performed using the MS Excel program and OriginPro 2022b (OriginLab Corporation, Northampton, MA). A p-value of <0.05 was considered significant. Paired t-tests and analysis of variance (ANOVA) tests were used as tools to compare SARS-CoV-2 genome concentrations from different types of samples and WWTPs.
Results
Comparison of SARS-CoV-2 in grab and 24-h composite samples
The SARS-CoV-2 N2 viral genome concentrations in grab samples collected from grit chambers 3 and 4 at JWPCP are shown in the box plots of Fig. 1a. The daily variations over a 24-h period spanned approximately fivefold for most of the sampling dates, except for the grab samples collected on December 29, 2020, where the viral concentration ranged between 5.82 × 10² and 3.37 × 10³ GC/mL. The daily grab sample median SARS-CoV-2 genome concentrations ranged from a low of 5.55 × 10² GC/mL on February 1, 2021, to a high of 1.88 × 10³ GC/mL on December 29, 2020. The SARS-CoV-2 genome concentrations in the two 24-h composite samples (main composite and master composite) are overlaid as trend line graphs in Fig. 1. There was no statistically significant difference between the main composite and master composite (p = 0.73).

Comparison of SARS-CoV-2 N2 GC/mL detected in primary influent by grab and 24-h composite sampling at
The viral concentrations in two 24-h composite samples both peaked on December 29, 2020, which agreed with the mean values of grab samples. There was no significant difference between the main and master composite samples and the mean of the daily grab samples taken at JWPCP (p = 0.12 and p = 0.18, respectively).
The SARS-CoV-2 genome concentrations in SJCE grab samples and 24-h composite samples are shown in Fig. 1b. The largest daily variability (over 10-fold difference) was observed on December 15, 2020, at this plant. The daily grab sample median SARS-CoV-2 genome concentrations ranged from as low as 3.17 × 10² GC/mL on February 2, 2021, to 1.55 × 10³ GC/mL on December 29, 2020. A similar trend to JWPCP was observed for the 24-h composite sample peaking with the mean of the grab samples, except that this happened a week prior on December 15, 2020, for SJCE. There was no significant difference between the composite and the mean of the daily grab samples taken at SJCE either (p = 0.60).
The SARS-CoV-2 genome concentrations, although on the higher end, measured in this study align with literature, showing magnitudes of up to 102–103 GC/mL at WWTPs of a similar size to JWPCP and SJCE (Gonzalez et al., 2020; Greenwald et al., 2021). In fact, a very large range SARS-CoV-2 concentrations are presented in the literature (Supplementary Table S1). The values found in this study are within the range literature reports across wide geographic regions.
LCWRP had only one sample of SARS-CoV-2 genome concentration above detection limit. This primary influent sample from December 29, 2020, had a viral concentration of 348 GC/mL. Among a total of 15 grab samples collected at LCWRP over the 4-month sampling period, no SARS-CoV-2 over 300 GC/mL was observed in the secondary effluent or disinfected effluent samples.
Comparison across 24-h composite samples taken at JWPCP and SJCE over the same sampling period revealed no significant difference of the SARS-CoV-2 genome concentration according to ANOVA (p = 0.77) and t-test (p = 0.73 for JWPCP main vs. master composites, p = 0.63 for JWPCP master vs. SJCE composites). This shows that SARS-CoV-2 genome concentrations at two large WWTPs were not different over the study period, suggesting that WBS at these plants can reflect similar trends of the COVID-19 epidemic in the region. In contrast, only one positive detection was found at LCWRP, indicating that this small plant did not reflect the epidemic pattern of the LA region; instead, this small relatively wealthy community likely had a lower rate of COVID-19 infection during the study period.
Primary sludge samples contained significantly higher SARS-CoV-2 than wastewater samples
SARS-CoV-2 genome concentrations in primary sludge samples from JWPCP and SJCE are shown in Fig. 2. The concentrations in sludge samples from two JWPCP wet wells did not have significant differences (p = 0.66), and this is shown by overlapping of the boxplots (Fig. 2a). The JWPCP sludge median SARS-CoV-2 genome concentration was the highest on December 15, 2020, at 5.90 × 10⁴ and 4.94 × 10⁴ GC/mL in wet well 1 and 2, respectively, whereas the median SJCE sludge SARS-CoV-2 genome concentration was the highest on December 29, 2020, at 6.63 × 10⁴ GC/mL (Fig. 2b). The SARS-CoV-2 genome concentrations in SJCE sludge samples were highly variable.
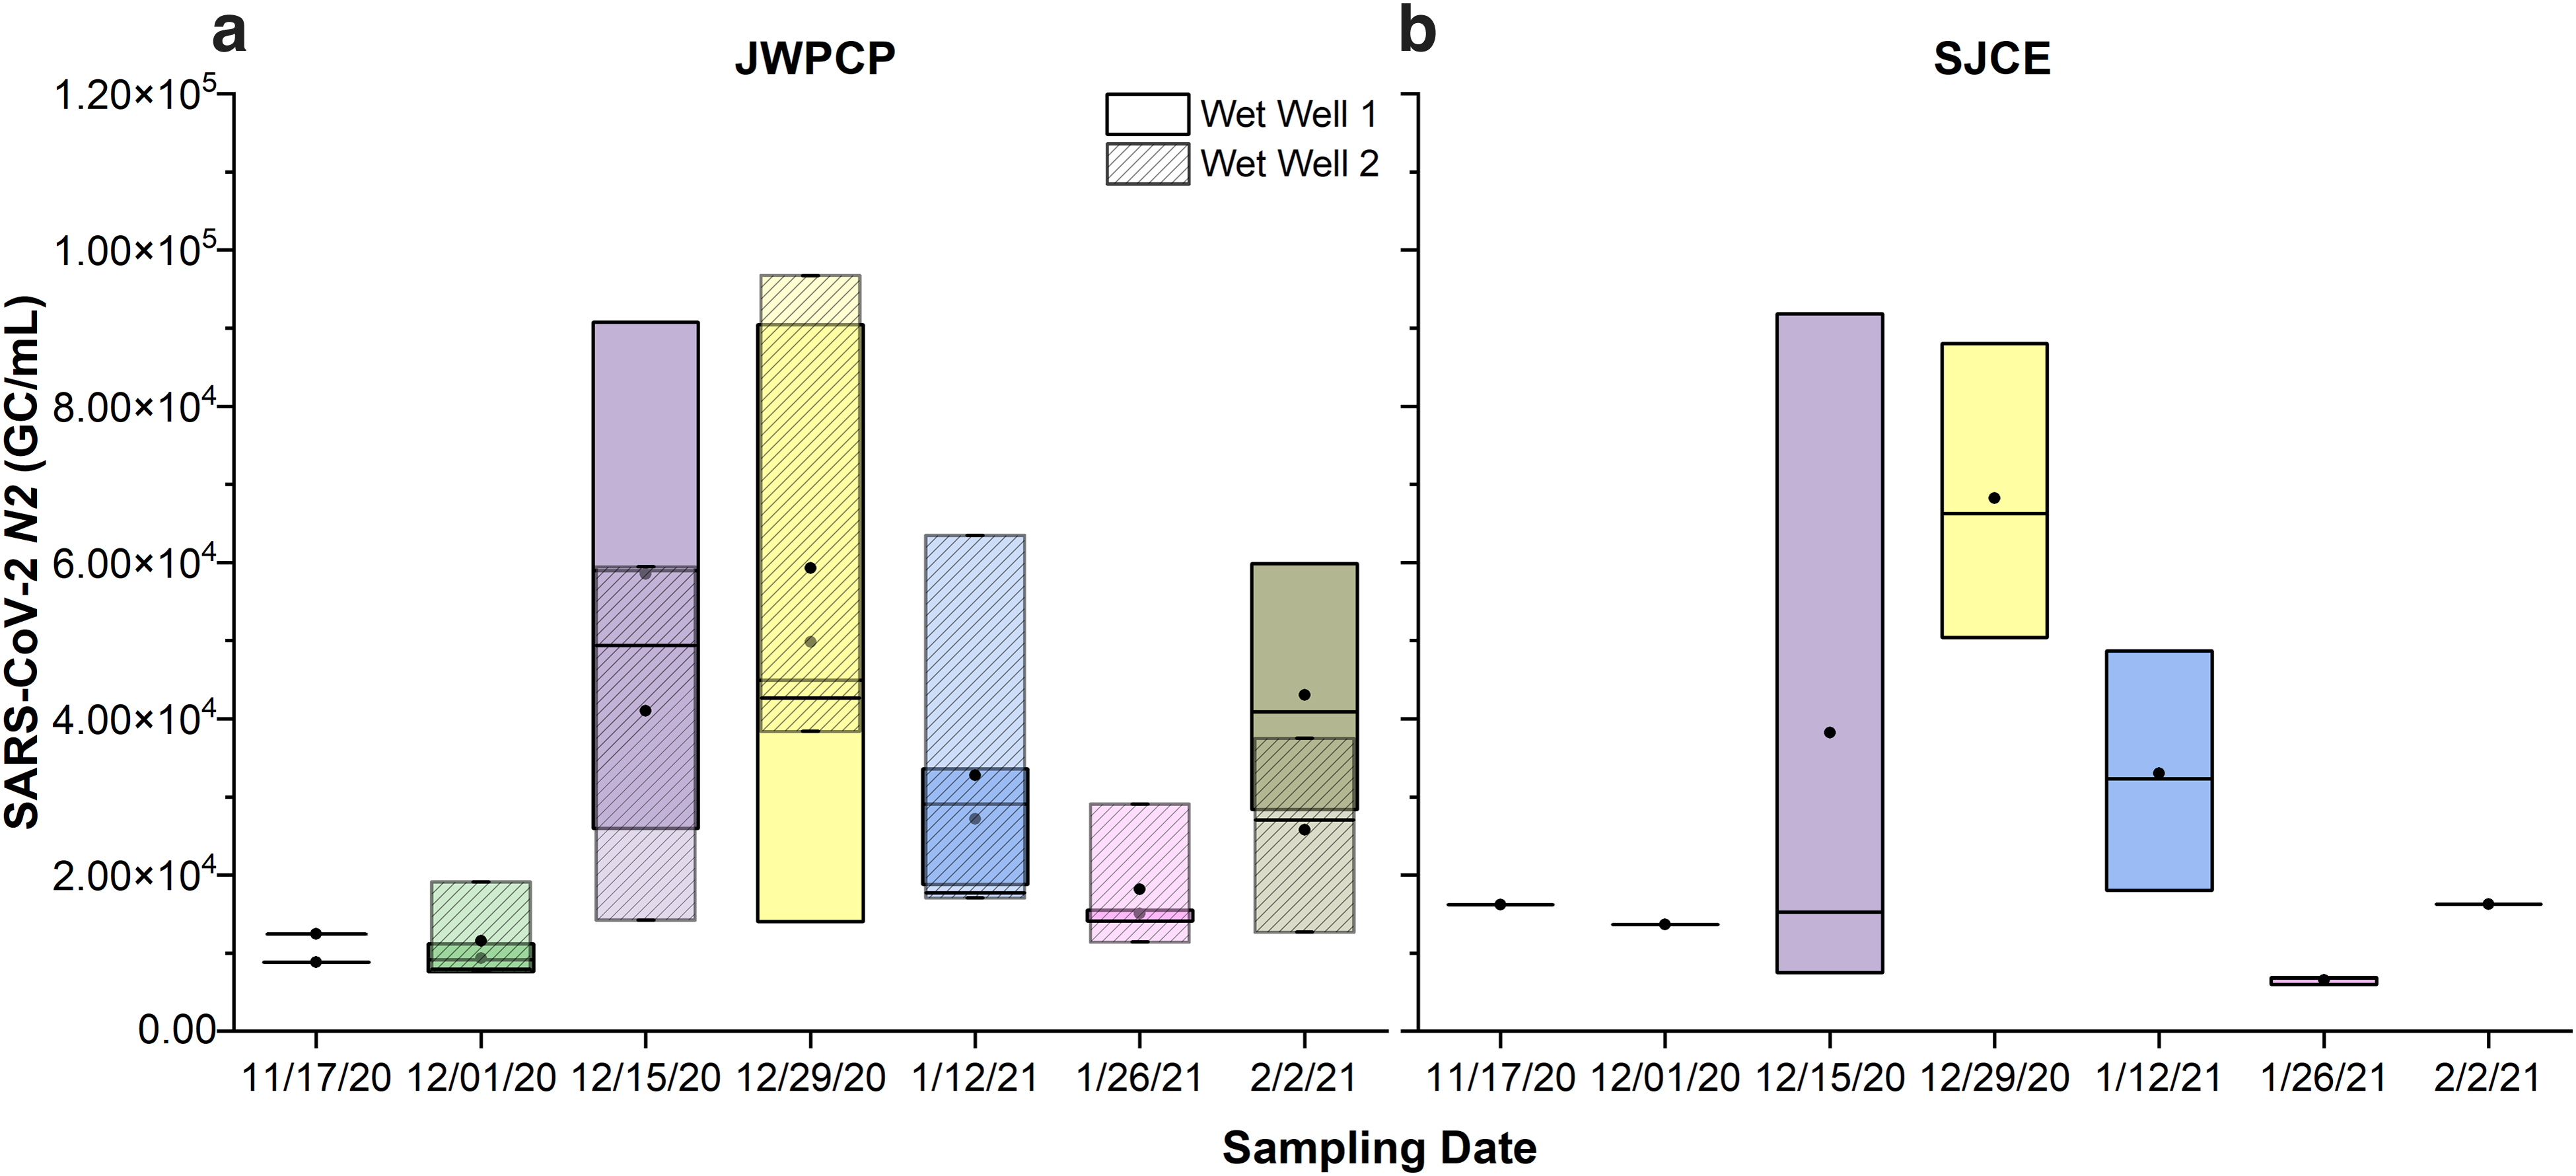
Comparison of SARS-CoV-2 N2 GC/mL detected in primary sludge by grab sampling at
A normalization of the genome concentration to TSS of the sludge could further improve the comparability of sludge data from different plants and literature values ((Boehm et al., 2022; Graham et al., 2021; Kim et al., 2022). Unfortunately, TSS was only determined in primary influent and selective sludge samples.
Some SJCE sludge samples (one of two samples collected on November 17 and two of three samples collected on December 1 and February 2) yielded results below detection. These samples also exhibited low turbidity upon visual inspection. While troubleshooting these below detection results, repeated nucleic acid extraction and viral seeding studies confirmed that PCR inhibition was not the likely cause (data not shown). Further interrogations revealed that TSS measurements in these samples were much lower in comparison with the typical sludge samples (ca. 8,000 vs. >25,000 mg/L), which meant that the below detection limit results were most likely due to the samples themselves. As mentioned in the Materials and Methods section, these sludge samples were taken from a port designed for troubleshooting clogs since no wet well was installed at SJCE. The quality of the sludge from this port was highly variable because the port was periodically flushed and cleaned out.
This resulted in some of the samples collected from this sludge port having a high proportion of water, low TSS, and not representing the typical sludge samples. These below detection results were not included in the correlation analysis with wastewater samples for these reasons.
To compare the SARS-CoV-2 concentration in primary sludge and influent wastewater, we divided the daily mean SARS-CoV-2 genome concentrations in sludge samples by that in wastewater (
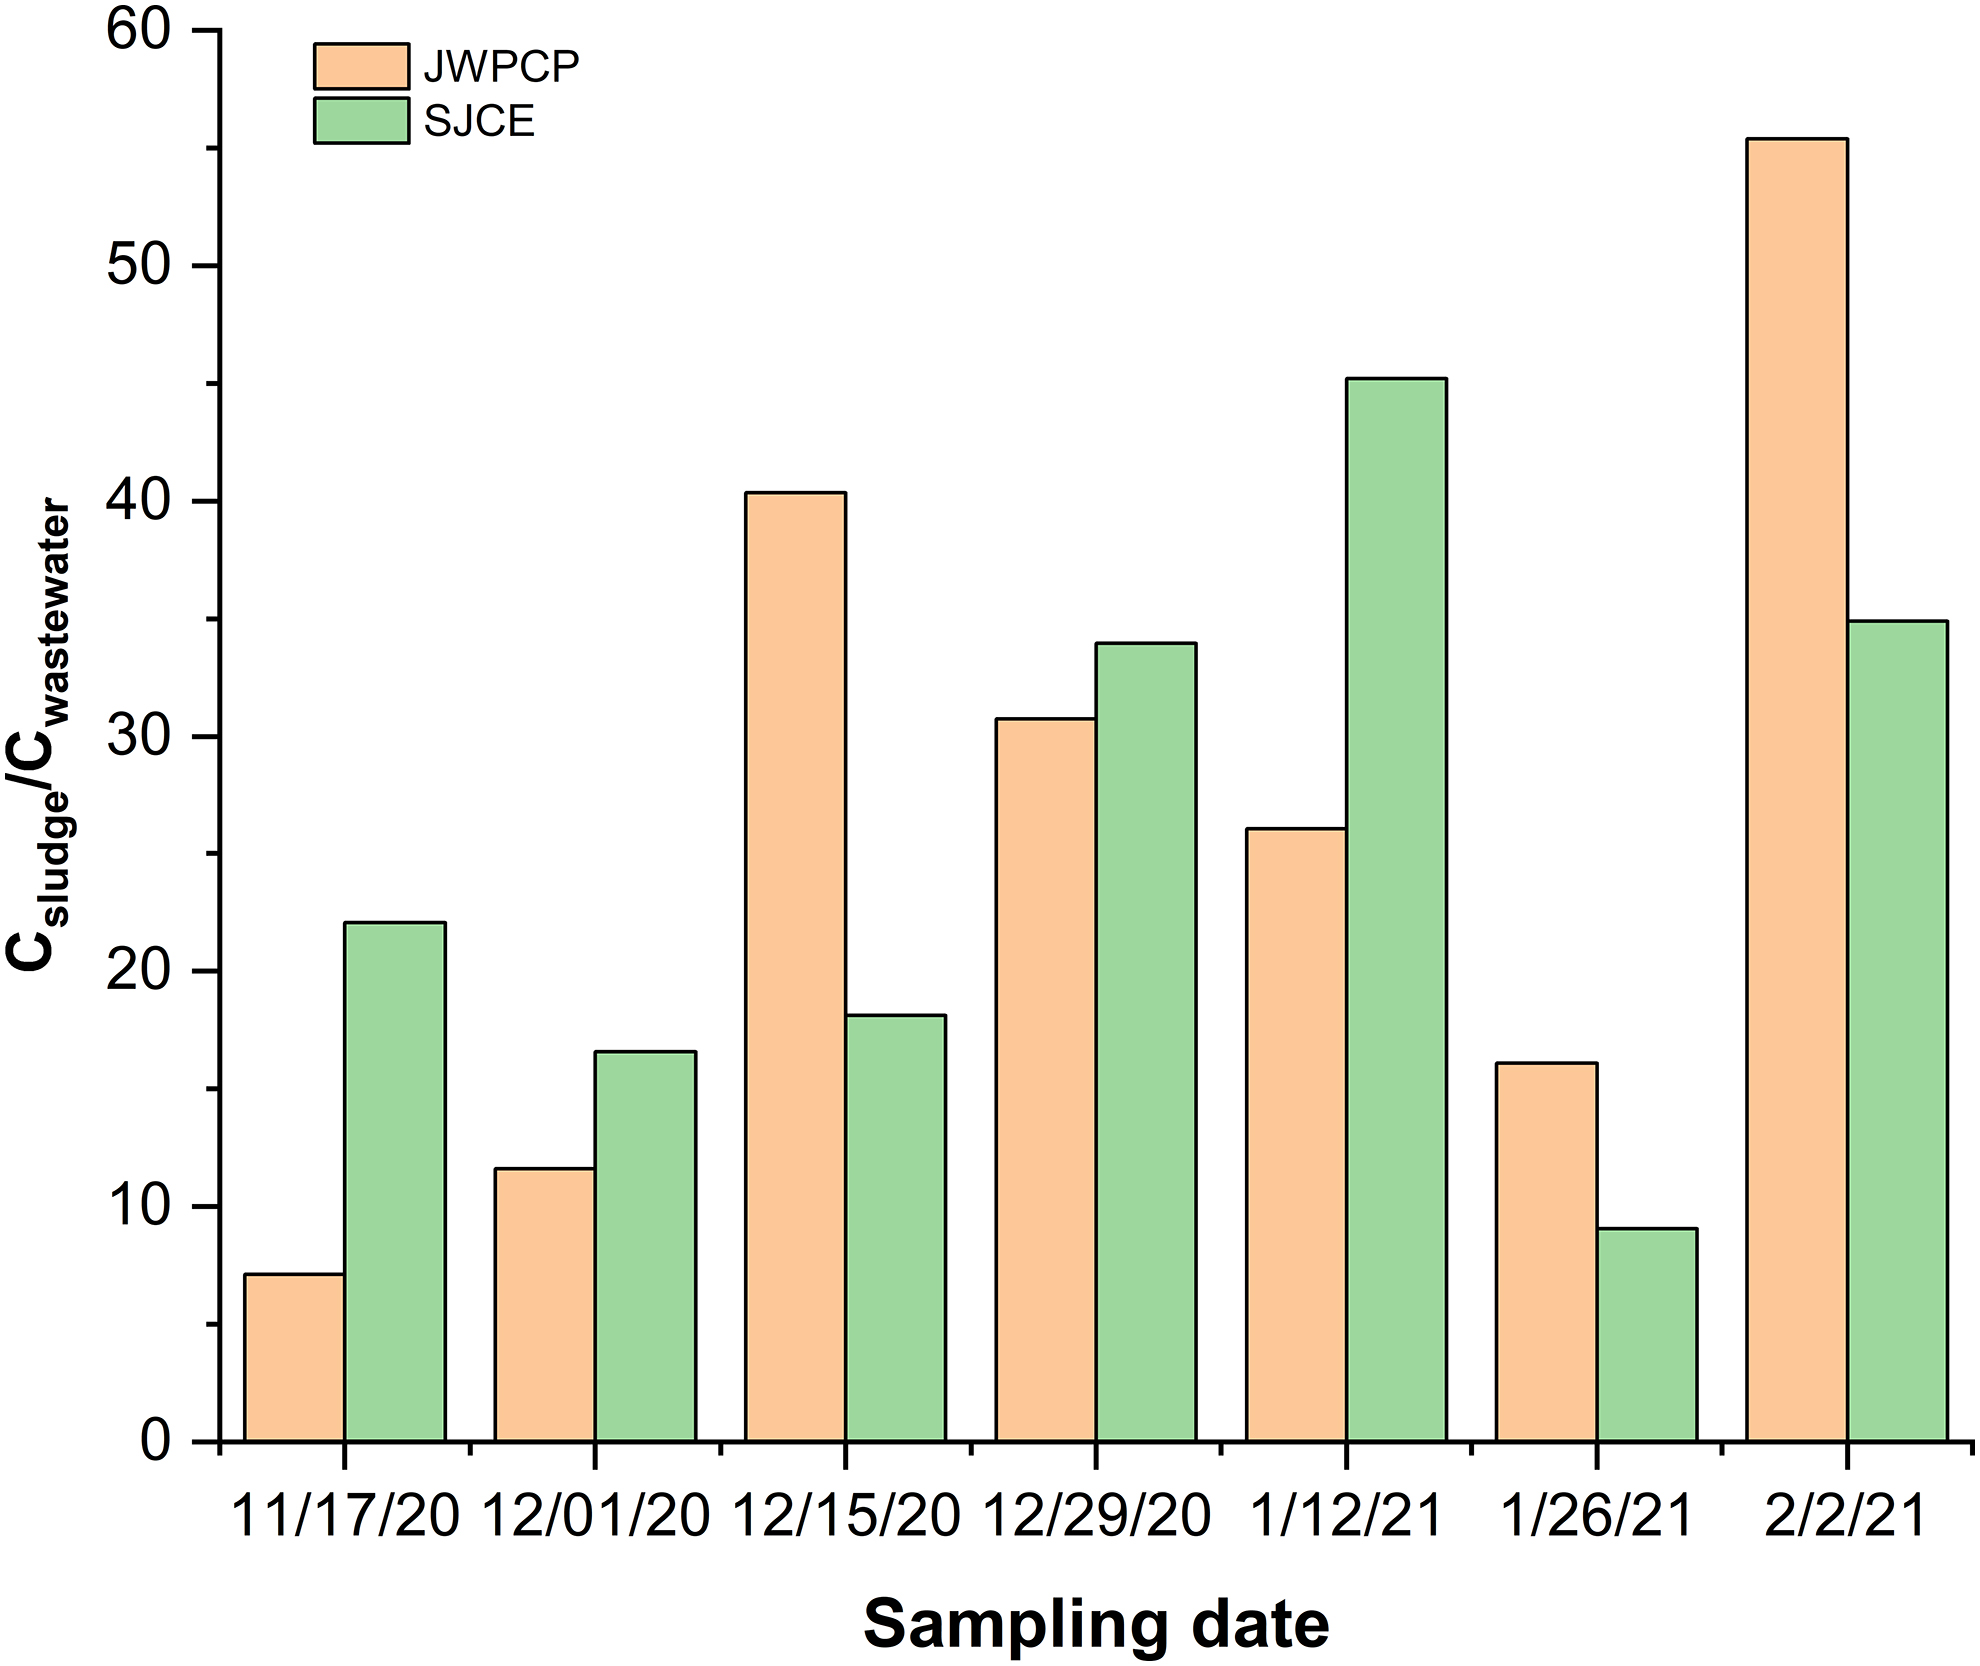
Ratio of SARS-CoV-2 N2 GC in primary sludge and primary influent collected from JWPCP and SJCE. Csludge = SARS-CoV-2 genome concentrations in primary sludge. Cwastewater = SARS-CoV-2 genome concentrations in primary influent wastewater.
Positive correlation between SARS-CoV-2 genome concentrations and COVID-19 cases
The SARS-CoV-2 genome concentrations were plotted together with 7-day rolling averages of COVID-19 case counts reported by the Los Angeles County Department of Health (County of Los Angeles Public Health, 2023) (Fig. 4). A best fit linear regression line with 95% confidence intervals shows the positive correlation between wastewater SARS-CoV-2 concentrations and LA County-reported cases. Statistically significant correlations were observed between the viral mean in sludge samples from both plants (Fig. 4a, b), where p-values are <0.05. Statistically significant relationships were also found with the viral concentration in JWPCP 24-h master composite sample (Fig. 4f) and mean of SJCE wastewater grab samples at p-values <0.1 (Fig. 4d). The higher correlation values (r > 0.8 and R2 > 0.6) were found for sludge samples than wastewater samples, and were comparative with other studies done in California at this period of sampling.

The relationship between daily mean of SARS-CoV-2 N2 GC/mL in grab samples
Increasing sampling frequency, normalizing data with flow or fecal strength markers, or reducing the complexity of sewershed as shown in other reports may improve the correlations of cases to SARS-CoV-2 genome concentrations in wastewater (0.65 < R2 < 0.96) (Kandonsky et al., 2023). Generally, correlation coefficients and/or R2 values range drastically depending on the study size, sewershed characteristics, and normalization methods used (Schill et al., 2023; Wolfe et al., 2021). Overall, the results of correlation analysis indicated that sludge samples were not only more sensitive for detection of SARS-CoV-2, but also were better correlated with 7-day rolling average of community cases.
No relationship between SARS-CoV-2 genome concentrations and water quality parameters
Lastly, the relationship between the SARS-CoV-2 genome concentrations detected in wastewater or sludge and water quality parameters was explored. Higher SARS-CoV-2 genome concentrations were postulated to coincide with high wastewater flow rates associated with high domestic use of toilets and showers. However, no correlation between the SARS-CoV-2 genome concentrations in grab samples collected at different times of the day and the wastewater flow rates to the plant was observed (Supplementary Fig. S6 and Supplementary Table S3).
Moreover, none of the WWTPs had a distinguishably higher wastewater flow rate in the morning, which is the expected high domestic water use period. The flow to the SJCE was the lowest in the early morning hours, then sharply increased and remained there for most of the day. The flow rate to JWPCP was less variable with the lowest flow in late morning, ramping up through the afternoon and evening before dropping back after midnight. The flow patterns observed in these plants suggest that the complicated sewer network alters the pattern between household water use and wastewater influent flow to WWTPs.
BOD, COD, TSS, and NHx-N data collected by the WWTPs do not match exactly with our study's sampling dates for wastewater and sludge but provided the general trend of water quality at the time of sample collection (Supplementary Fig. S7). The COD and BOD, but not NHx-N, concentrations in the JWPCP plant were roughly double that of the SJCE plant. The TSS concentrations measured in JWPCP influent were five to seven times higher than those in SJCE. These results further reflect the wastewater and sludge diversion practice in the region, with JWPCP receiving settled sludge from upstream plants that are rich in organic carbon and solids. The correlation analysis of SARS-CoV-2 genome concentrations and the water quality parameters collected during the sampling period did not reveal any statistically significant relationships (Supplementary Table S4).
The lack of correlation could be due to the mismatch of water quality data collection and sampling times and the extreme flow and diurnal variabilities at these WWTPs, each of which could be explored in future research. However, there is a benefit to understanding these water quality parameters outside of correlation analysis since these parameters have been shown to have possible interference with the stability of viruses in wastewater and the subsequent PCR amplification efficiency (Kallem et al., 2023).
Discussion
The results of this study add to the growing body of literature on the detection and quantification of SARS-CoV-2 in wastewater and its relationship to the general trend of the COVID-19 pandemic in a specific region. Since the initial discovery of SARS-CoV-2 in wastewater, much of the research has progressed from methods comparison of viral recovery from wastewater, correlating the relationship between viral concentration and clinical cases, the genetic analysis of variants, the normalization of SARS-CoV-2 GC with fecal strength markers, to the prediction of the clinical peaks (Ahmed et al., 2021b; Boehm et al., 2022; Crits-Christoph et al., 2021; Kallem et al., 2023; Kitamura et al., 2021; Li et al., 2022; Pecson et al., 2021; Wu et al., 2020; Zhan et al., 2022; Zhu et al., 2021).
A list of literature is compiled for reports between late 2020 and June 2023 in Supplementary Table S1. The list of 86 reports is not intended to be a complete literature study or a metadata analysis (which is beyond the current scope of this study). A review of this mainstream literature indicates a systematic comparison of sampling strategies at WWTPs that serve sewersheds with different wastewater properties as a research gap. The study focused on testing a working hypothesis that sewershed complexity can have important implications for the interpretation of WBS. SARS-CoV-2 concentrations at different sized WWTPs from the same region were vastly different when sampled side by side (Song et al., 2021). A review by Bertels et al. (2022) identified that sampling strategies, such as sampling frequency and sampling mode, and within-wastewater factors, such as wastewater characteristics, present as gaps in WBS (Bertels et al., 2022; Sangsanont et al., 2022).
Grab sampling is the simplest way of sample collection as it does not need expensive equipment and installation; as such, grab sampling can be performed at almost any wastewater access point. Grab sampling strategy has also proven useful for wastewater monitoring at sewer manholes (Schmitz et al., 2021) and could be applied to decentralized systems such as septic tanks. In WWTPs, flows are constantly incoming and display diurnal patterns, and the patterns of SARS-CoV-2 viral loading are inconsistent and staggered (Bertels et al., 2022). The large ranges of SARS-CoV-2 genome concentrations throughout a 24-h period were found in the two large WWTPs sampled, although the median grab sample concentration correlates with the trend of the 24-h composite samples.
Since the SARS-CoV-2 genome concentrations from grab sampling every 4 h cannot be attributed to specific peaks of COVID-l9 in the community, there is most likely no added advantage of more frequent sampling. The 24-h composite results can capture the viral load in 24 h as indicated by the relationship between the viral genomes detected in composite samples and the mean values of six grab samples taken over the same 24-h period. Ahmed et al. (2021a) and Babler et al. (2023) similarly reported that a 24-h composite sample is adequate for SARS-CoV-2 quantification in WWTPs.
In addition to the sampling interval, the selection of WWTPs is also critical for WBS outcomes. Significant variabilities of SARS-CoV-2 genome concentrations were found across nine different WWTPs in Southern California in a previous study (Song et al., 2021). This suggests that there is a significant influence of sewershed characteristics on quantifiable SARS-CoV-2 genome concentrations in wastewater samples. As shown by the results from sampling at JWPCP and SJCE, large- and medium-sized WWTPs can capture the general trend of COVID-19 cases by forming a natural composite of the community through the mixing of wastewater from a diverse sewer network. However, the results from these WWTPs are unable to pinpoint the sources of viral shedding by any specific community.
Conversely, while sampling a small community plant such as LCWRP could be useful in pinpointing outbreak locations, viral data from LCWRP do not correlate with the general trend of COVID-19 cases in LA County. More frequent sampling and using 24-h composite sampling should be considered to detect outbreaks or to track infections for a small community.
Lastly, this study shows the benefit of sampling sludge from WWTPs since sludge has nearly an order of magnitude higher concentration of SARS-CoV-2 than primary wastewater influent in the same plant. Furthermore, this phenomenon has been reported previously (Graham et al., 2021; Kitamura et al., 2021), and may mean that the virus has a greater affinity to particles and/or is more stable in particle-attached form. Targeting sludge strategically would be especially useful for sampling efforts during low periods of infection. However, sludge sampling may not be applicable to all WWTPs since not all facilities install wet wells for primary sludge collection. For instance, at SJCE, raw sludge samples are typically not collected, which led to our sampling from a valve used for troubleshooting clogs.
An improved correlation of sludge SARS-CoV-2 genome concentrations and 7-day rolling average of community cases was observed. This suggests that sludge sampling can be a useful tool to track community outbreaks. Conversely, Wang et al. (2023) inferred that sludge analysis may not be able to pinpoint the beginning of an outbreak because the sludge retention time is often greater than three days. However, they did not test the sludge samples when community cases were low, and SARS-CoV-2 was below detection in wastewater. In fact, sludge samples may enrich SARS-CoV-2 shed by patients for multiple days and provide sensitive earlier detection than wastewater to identify the onset of outbreak when the case numbers are low. Future studies can design sampling strategies to test this hypothesis.
Conclusion
Overall, the results of study indicate that WBS at large, in contrast to small, WWTPs that naturally composite wastewater from a large geographic area and population is the best representation of the trends of regional COVID-19 case levels. This study shows that 24-h composite primary wastewater sampling via autosamplers at these large WWTPs is the most effective strategy to detect COVID-19 at the regional level, and composite sampling at small-scale community plants such as LCWRP has the potential to improve the coverage of viral detection for a specific community.
Contrastingly, grab sampling can highlight the significant temporal variabilities of SARS-CoV-2 genome concentrations found in WWTP influent over a 24-h period if this outcome is desired. Primary sludge samples were shown to have roughly 10 times the SARS-CoV-2 genome concentration of primary influent samples. Adding sludge sampling and testing, when possible, can significantly improve the sensitivity of SARS-CoV-2 detection and potentially detect low levels of epidemic in the community. As a period of less frequent mass testing initiatives is approached in the United States, continued WBS can provide information regarding the public health and episodic severity of SARS-CoV-2 in communities served by WWTPs (Fernandez-Cassi et al., 2021; Hong et al., 2021; Kumar et al., 2021; Randazzo et al., 2020).
Footnotes
Acknowledgments
The authors acknowledge the generous support from the staff of the Los Angeles County Sanitation Districts for wastewater sample collection, water quality data acquisition, and discussion of sampling strategies. They also thank the training and technical support provided by the University of California, Irvine Genomics High-Throughput Facility staff for ddPCR assay of SARS-CoV-2.
Authors' Contributions
A.G.: Investigation, data curation, formal analysis, visualization, writing—original draft, and writing—review and editing. Z.S.: Methodology, investigation, and data curation. C.T. and S.R.: Investigation. P.H. and N.M.: Resources and supervision. D.R., P.A.H., and S.J.: Conceptualization, investigation, writing—review and editing, supervision, project administration, and funding acquisition.
Author Disclosure Statement
No competing financial interests exist.
Funding Information
Funding for this research was provided by the Water Research Foundation (WRF5093), the U.S. National Science Foundation (CBET 2027306), the University of California, Irvine Clinical Research Acceleration and Facilitation Team (CRAFT), and the University of California, Irvine COVID-19 initiative.
References
Supplementary Material
Please find the following supplemental material available below.
For Open Access articles published under a Creative Commons License, all supplemental material carries the same license as the article it is associated with.
For non-Open Access articles published, all supplemental material carries a non-exclusive license, and permission requests for re-use of supplemental material or any part of supplemental material shall be sent directly to the copyright owner as specified in the copyright notice associated with the article.