




Abstract
Microplastic pollution poses a significant threat to the ecosystem, encompassing not only aquatic organisms but also plants and human health due to their capacity for bioaccumulation, driven by their minute size and persistence. Although previous research predominantly centered on the effects of microplastics in ocean environments, it is vital to recognize that their ultimate destination is often rivers and estuaries, serving as more precise point sources for analysis. This research focuses on a comprehensive investigation involving the monitoring and modeling of microplastic distribution and concentration within the Delaware estuary. Grab and net sampling methods were employed across Philadelphia, Camden, and Wilmington, Delaware, to examine the distribution, concentration, and characteristics of these pollutants. The findings indicate that microplastic’s diameters varied from 90 µm to 1000 µm along the Delaware River, with 71% of particles in grab samples under 500 µm. In contrast, 66% of particles in net samples exceeded 500 µm. Moreover, concentrations in grab samples ranged from 0.24072 to 7.08 particles/m3, whereas net samples showed significantly lower concentrations, ranging from 0.000059 to 0.00268 particles/m3. The investigation discovered a range of plastic compounds, most notably polyester, polypropylene, and polyethylene, with fibers being the most common shape. Furthermore, the concentration and composition of microplastics were closely linked to urbanization, population density, and industrial activities. Analysis using the Delaware River Basin Commission’s 3D hydrodynamics model revealed that microplastics predominantly stayed in upper water layers for up to 20 days and moved toward the opposite bank from their release point, influenced by current dynamics. These findings not only enhance our comprehension of microplastic pollution in freshwater ecosystems but also establish a foundational framework for future research aimed at developing effective management and remediation strategies, particularly for ecosystems near to the Delaware estuary. This study provides essential data that can inform policy decisions and conservation initiatives designed to reduce the environmental impact of microplastics.
Introduction
In recent years, the growing problem of plastic contamination has emerged as a significant threat to both marine and freshwater ecosystems. Plastic polymers, commonly referred to as plastics, are materials that primarily use polymers as their main ingredient. These are widely favored in various industries because of their exceptional versatility and durability (Silva-Cavalcanti et al., 2017). Given the prevailing escalation in plastic consumption, it is predicted that we would produce about 33 billion tons of plastic globally by 2050 out of which, by 2060, 155–265 million tons are estimated to enter the natural environments (Wang et al., 2022). Most of the plastic in surface water consists of microplastics, which are small synthetic polymers with a particulate size of less than 5 mm (Mccormick et al., 2016). Despite their small size, microplastics infiltrate every level of the aquatic food chain, impacting wildlife from the surface to the sea floor (Rochman, 2018). Microplastics have significant physical impacts on aquatic biota in the form of entanglement, ingestion, and suffocation. The fact that microplastics are found in large quantities in freshwater, oceans, equator, poles, wastewater treatment facilities, and even drinking water increases the threat posed by them (Wang et al., 2022). Toxic substances and additives derived from industrial operations, as well as persistent contaminants, are transported by these entities. These substances have the potential to pose serious threats to human beings (Su et al., 2022). Consequentially, the persistent bioaccumulation of microplastics in the environment endangers not only wildlife and the environment but also human health (Parolini et al., 2023).
Microplastics accumulation has been reported in various freshwater organisms including insects, clams, worms, fish, and birds. Moreover, due to uncontrolled tipping sites, poor waste management, and human activities, these microplastics could leak into the terrestrial environments affecting soil quality and eventually crop production (Hale et al., 2020). Their large surface-to-volume ratio and chemical composition also make microplastics particularly prone to accumulating waterborne contaminants including metals and persistent bio accumulative toxic compounds such as polybutylene terephthalate (PBT) (Cera et al., 2020). Microplastics can pollute freshwater systems either as primary microplastics, which originate from products such as cosmetics, cleaning agents, and coatings, or more frequently as secondary microplastics. These are created from the breakdown of larger plastic items due to weathering, ultraviolet radiation, or physical abrasion (Lehtiniemi et al., 2018).
Multiple factors are believed to affect the quantity of microplastics in freshwater including human population density proximal to water body, size of water body, proximity to urban centers, residence time, waste management system, and amount of sewage overflow (Eerkes-Medrano et al., 2015). There is a close correlation observed between urban land cover and microplastic abundance due to factors such as inefficient sewage management, further leading to elevated microplastic levels in nearby watersheds. It was also observed that the microplastic concentration increased with increasing proximity to urban or industrial sectors (Yuan et al., 2021). A study in the Great Lakes (USA) focusing on the effect of urbanization found that particle concentrations ranged from 280,947 to 466,305 particles/km2 for highly populated Detroit and Cleveland metropolitan areas. On the contrary, in areas where the shorelines are less influenced by the presence of major urban centers, such as Lake Huron with particle concentrations estimated from sampling were significantly lower, ranging from 456 to 6541 particles/km2 (Horton et al., 2017). For any piece of microplastic, it is difficult to determine its point source, so a source-apportion analysis is performed wherein the size, color, shape, and polymer type of the piece is examined. This can help predict what product the microplastic comes from, allowing for its toxicity to also be assumed. For instance, microplastics, roughly 3 to 5 mm in size, with a cylindrical or oval shape are generally industrial pellets. Spherical microbeads identified as polyethylene via spectroscopy generally originate from personal care products. Finally, colorful polyester microfibers likely originated from synthetic clothing or other textiles (Gouin, 2020).
The main obstacles in detecting microplastics involve the collection of plastic particles from water or sediment samples, the subsequent separation of plastic fragments from other organic and inorganic substances, and the identification of the composition of these microplastics (Li et al., 2020). In the identification of microplastics, many methods have traditionally relied on visual identification. However, this approach is susceptible to sampling error, bias, and the potential omission of particles with specific size or density characteristics (Razeghi et al., 2021). Consequently, the outcomes obtained using this method tend to be qualitative in nature rather than quantitative. Contemporary qualitative studies combine various analytical techniques such as Fourier-transform infrared spectroscopy (FTIR), Raman spectroscopy, pyrolysis-gas chromatography/mass spectrometry, and liquid chromatography (Li et al., 2018).
According to existing sampling endeavors with nonstandardized methodologies, microplastics have been detected globally, with the highest levels of water pollution observed in Southeast Asia and Europe. Sediments in North Africa and North America were also found to exhibit significant contamination (Eerkes-Medrano et al., 2015). Although the initial documentation of these microplastic particles dates to the early 1970s, comprehensive investigations regarding their levels of concentration and associated effects did not commence until 2004. Despite the estimation that freshwater runoff accounts for approximately 70–80% of microplastics found in the marine environment (Napper et al., 2015), a significant portion of research efforts has been directed toward investigating marine microplastics. According to a search in the journal database, only 13% of microplastic studies are focused on freshwater contamination (Wong et al., 2020). This gap in research motivated our study, aimed at addressing the lack of comprehensive data on the distribution, concentration, and dynamics of microplastics in such ecosystems. By identifying these gaps, this study sets the stage for targeted future investigations and underscores the urgent need for data that can drive environmental management and policy decisions. Limited information is available regarding the distribution, concentration, and impact of microplastics in the upper estuary of the Delaware River and its tributaries. However, there have been studies conducted on the distribution of microplastics in Delaware Bay and nontidal rivers (Cohen et al., 2019).
The primary objective of this study is (a) to examine the upper section of the Delaware River estuary, with a specific focus on areas impacted by urbanization; (b) to develop and implement an effective methodology for gathering data on the distribution and quantification of microplastics within the estuary, which is crucial for targeting cleanup initiatives and remediation in regions exhibiting high concentrations of microplastics; (c) to enhance our understanding and data regarding microplastics by monitoring and modeling their distribution and concentration in the Delaware estuary; and (d) to contribute to the broader objective of mitigating plastic contamination in freshwater systems and raising public awareness regarding the environmental risks associated with microplastics.
Materials and Methods
Sample collection
Surface water samples were collected from 14 distinct locations within the Delaware estuary and its tributaries in 2019. These locations encompassed various areas in Philadelphia (PA), Camden (NJ), and Trenton (NJ), as well as the northern regions of Delaware. Two distinct methodologies were used to gather samples, as shown in Figure 1: Grab Sampling and Neuston Net Sampling. Ten‐liter grab samples were collected at nine tributary locations and five mainstem Delaware River locations directly into glass bottles. At tributary site, samples were collected from bridges directly into amber glass sampling jars using a weighted sampler. At mainstem Delaware River sites, a modified Niskin sampler was used to collect samples near surface and near bottom. Grab sampling is a versatile method and permits filtration at the micron scale (Barrows et al., 2017). At a subset of sites, we also collected samples using a neuston net which entails passing a substantial volume of surface water through a net. Nets were deployed for approximately 4–5 h at each site, and stream flow was estimated before and after the deployment to calculate the volume of water that passed through each net. Flows at the Delaware River at Trenton ranged from 523.861 to 671.108 m3/h and were generally declining during sampling. Total volume of water sampled at each site ranged from 17 to 510 m3. Owing to the logistics of the net sampling setup, net samples could only be collected at sites that were wadable and had little tidal influence. A net sample blank was collected by rinsing tap water through the net for several minutes. The effectiveness of this approach is based on the pore size of the net, which is 153 µm in this study. The Neuston net allows for sampling of much larger volumes of water. Sample collection was performed by the Delaware River Basin Commission. Samples were maintained at 4°C until microplastic concentrations were determined.

Geographic distribution of the 14 sampling sites for microplastics in the Delaware River estuary and its tributaries.
Sample processing
Sieving
The net samples and grab samples experienced similar processing procedures. The sequential sieve method was used to separate microplastic particles from surface water samples. Multiple sets of mesh sieves with pore sizes of 1000 µm, 500 µm, 250 µm, and 90 µm were used in this procedure. The sieves were firmly secured to a stable metal stand and positioned in descending order of mesh size, starting at 1000 µm at the top and finishing at 90 µm at the bottom. Following that, 10 liters of surface water were meticulously poured over the sieves. This setup permitted the systematic separation of microplastic particles based on their size, allowing for a thorough examination of the various microplastic dimensions present in the analyzed water.
Chemical digestion
To eliminate any residual organic matter that may have been present in the sieves along with the particulates, a 30% solution of hydrogen peroxide (H2O2) was used to rinse the sieves. To ensure the removal of natural organic matter, the 30% H2O2 solution was systematically filtered through each sieve in the following order: 1000 µm through 90 µm, 500 µm through 90 µm, 250 µm through 90 µm, and finally 90 µm if required (Zhou et al., 2022). Following this, the sieves were labeled, enveloped in aluminum foil, and dried under a fume chamber for at least an overnight period.
FTIR analysis
A careful visual sorting procedure was conducted on the materials that retained on the sieves. The initial step was the visual separation of objects, preferably through direct observation without the aid of any optical devices. Subsequently, the particles were observed using a light microscope at magnifications of 40× and/or 60× to differentiate between debris and possible microplastic particles. The particles were subjected to microscopic analysis to determine their structure, shape, and color. Infrared spectroscopic analysis of various rubber materials was carried out using Perkin Elmer FT-IR Spectrometer—Spectrum 100, DE, USA. The spectral range of the instrument was configured between 3850 and 850 cm−1, and the resolution was set at 8 cm−1. FTIR analysis was conducted with the plastics and polymers library, and spectral matches exceeding 95% were considered valid.
Quality assurance/quality control
To ensure the integrity and reliability of our research findings, rigorous quality assurance/quality control measures were implemented throughout the study. To keep track of and account for any possible contamination that could have happened during sample collection, preparation, and analysis, blanks were routinely processed alongside samples. There were three types of blanks: field blanks, equipment cleaning blanks, and laboratory blanks (made with deionized water). Periodically, control samples were examined to confirm the accuracy and uniformity of the analytical techniques (Kosuth et al., 2023). To reduce variability and avoid contamination, standardized protocols were followed during the collection of each sample. Between samples, the sampling apparatus was thoroughly cleaned and rinsed with filtered water. Before conducting this study, method validation was performed using established procedures from a previous study on microplastics in municipal wastewater. This validation included testing the effectiveness of sample digestion using 30% H2O2, which was found adequate for our sample matrix. In addition, alternative methods such as flotation and Nile-red dye staining were evaluated, but FTIR analysis provided the most reliable and reproducible results (Meyers et al., 2022). The flow rate of the Delaware River was continuously monitored during sampling. In addition, the volume of water filtered through the Neuston Net was calculated to quantify the total amount of water sampled, which is critical for accurately estimating microplastic concentrations.
Microplastics fate and transport
The Environmental Fluid Dynamics Code (EFDC) was used to model hydrodynamics and transport processes of microplastics in Delaware River. EFDC, which operates within a curvilinear and orthogonal horizontal coordinate system that adjusts vertically to align with bottom topography and surface displacement, resolves the three-dimensional, vertically hydrostatic equations for turbulent flow. The EFDC’s quality assurance/quality control has been established through analytical solutions, lab experiment simulations, and verified field applications, ensuring its effectiveness in simulating water and water quality constituent transport in dynamically complex environments (Sinha et al., 2012). This section of our study does not yet provide a complete simulation of microplastics dynamics but sets the stage for future research.
Results
Microplastic shapes
During the sampling process, a diverse range of plastic forms were collected, including fibers, fiber bundles, films, pieces, and spheres. Supplementary Figure S1 presents an assortment of microscopic photos, obtained at a magnification of 60×, showing various sorts of particles that were collected on the sieves. Fibers had the highest prevalence over a significant majority of the surveyed locations. The net samples showed a more uniform distribution of shapes, with fragments ranking second in abundance after fibers. Grab samples were predominately composed of fibers, which accounted for 88% of the total particles detected. The distribution of microplastic shapes in the Delaware estuary can be seen in Figure 2.
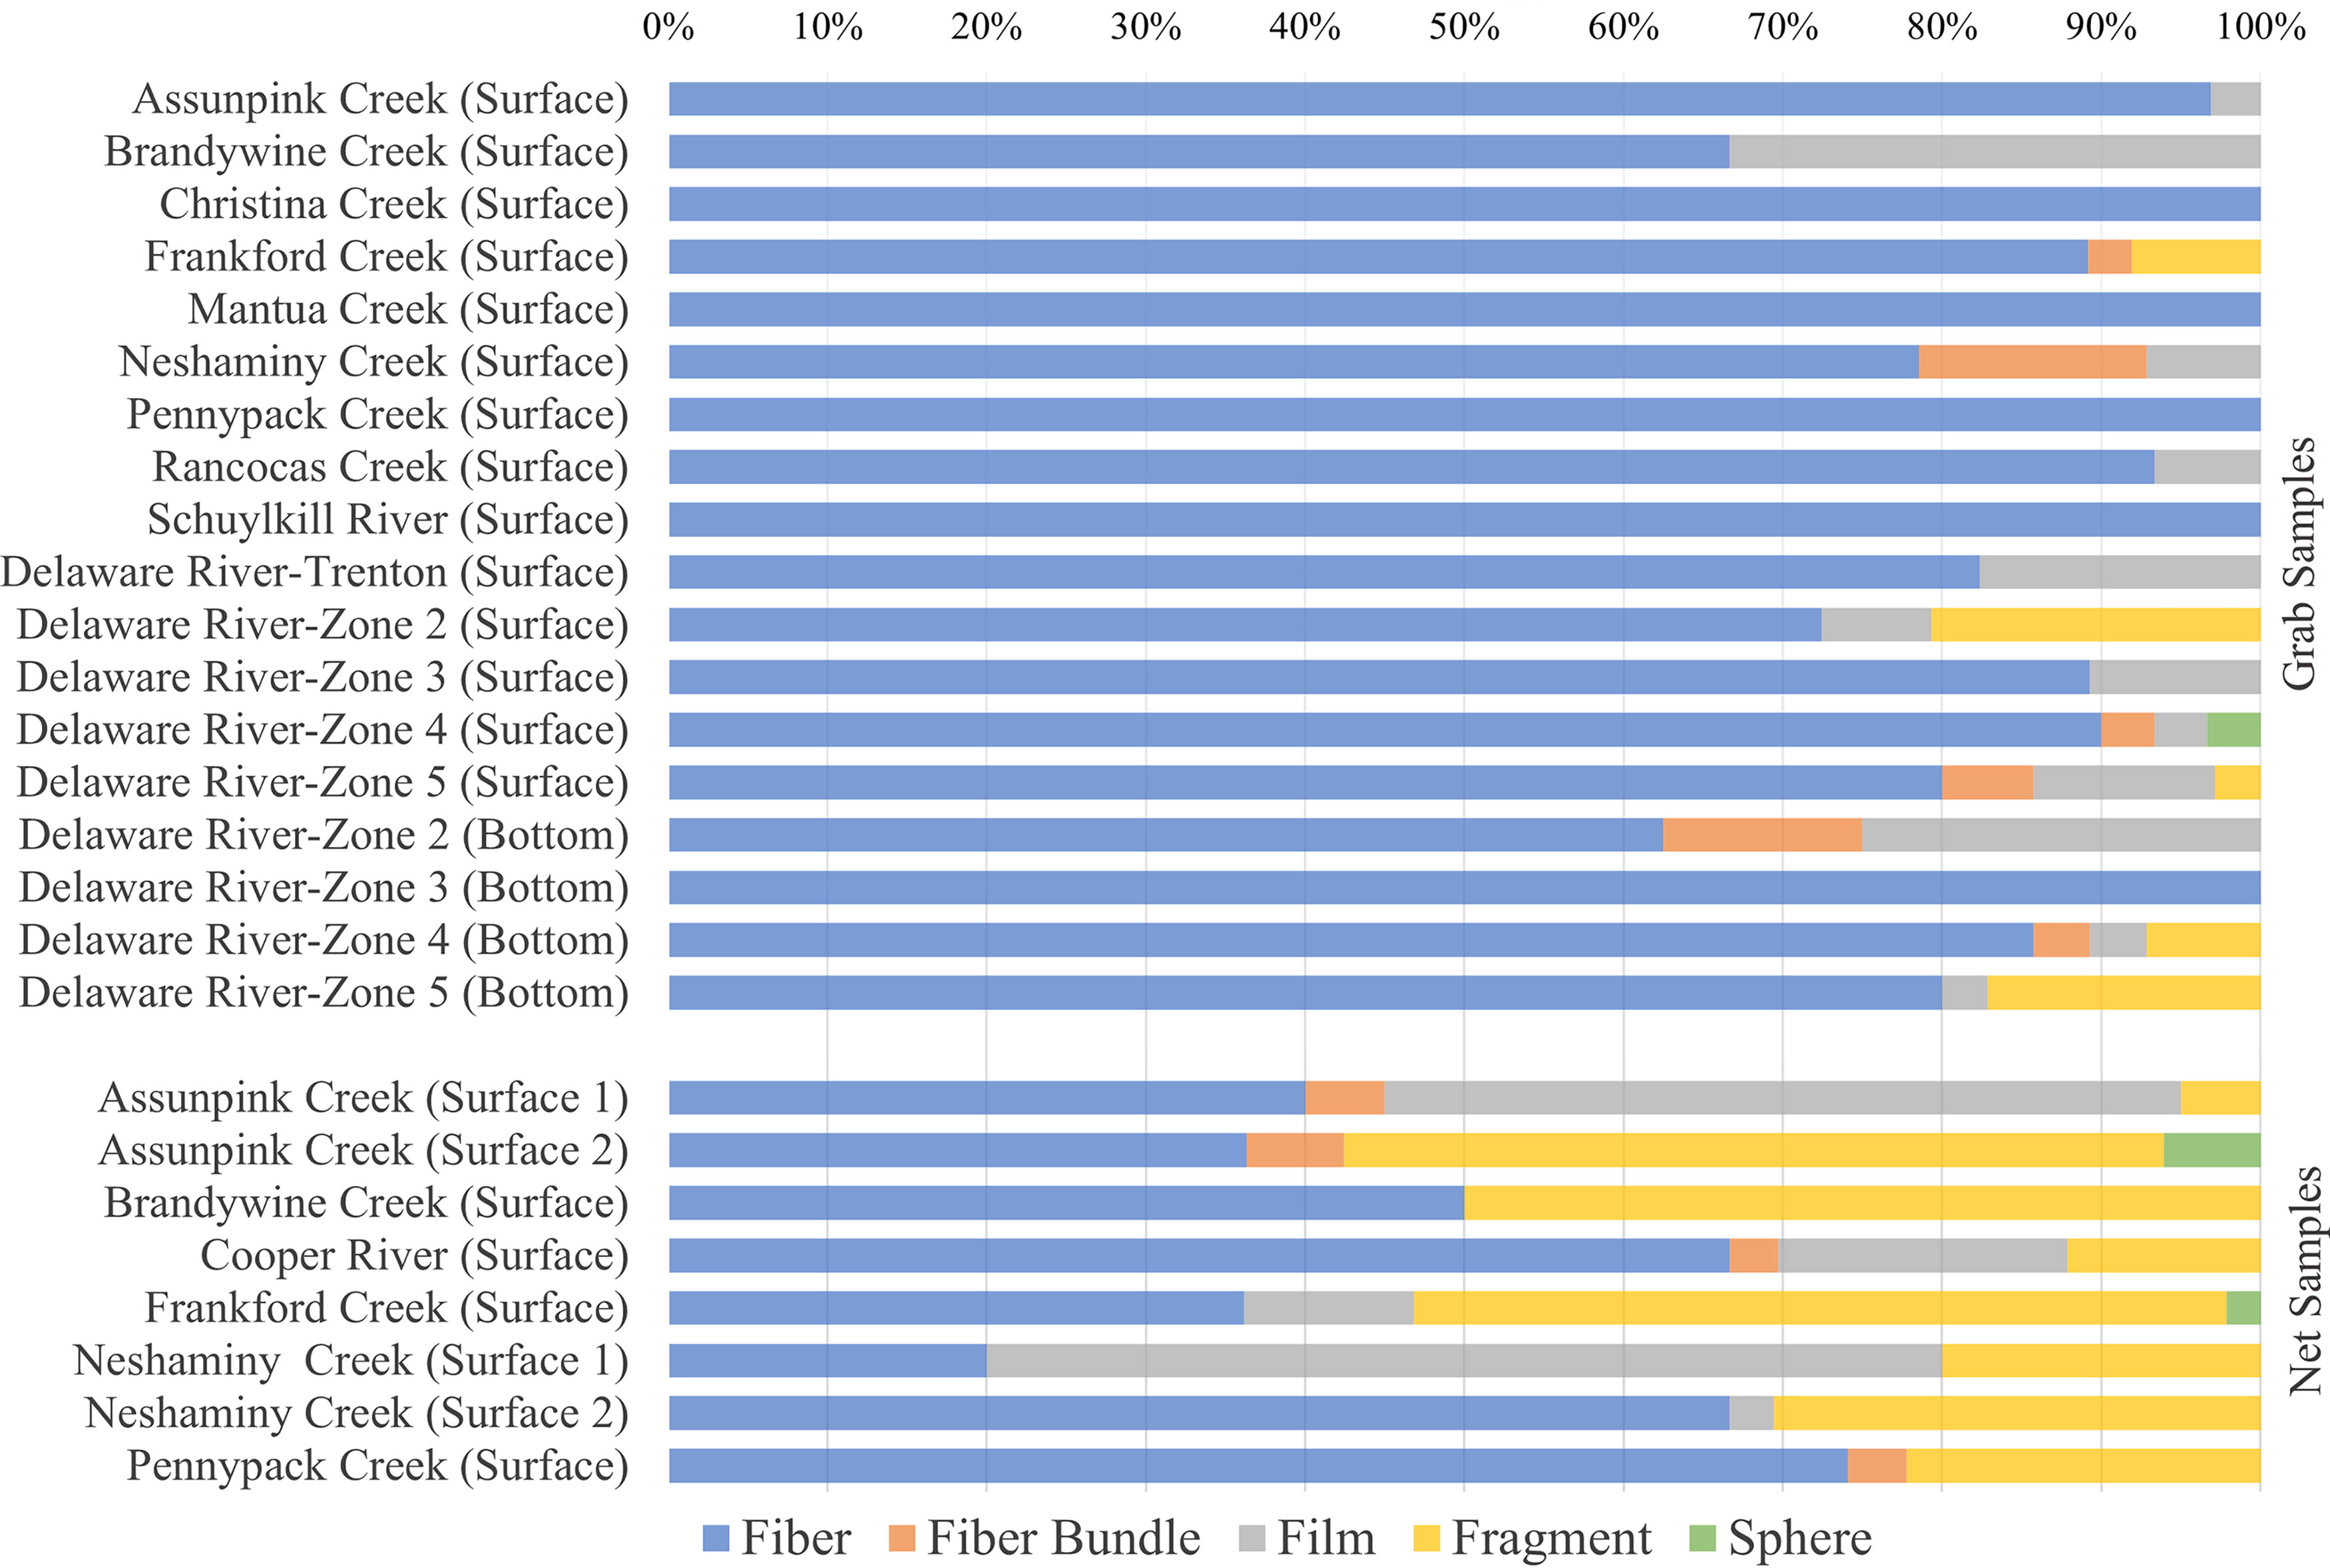
Variability in microplastic shapes observed at sampling sites within the Delaware estuary and its tributaries.
Microplastic dimensions
Microplastics were found in diameters ranging from 90 µm to 1000 µm, and their dimension range varied across different locations along the Delaware River, as shown in Supplementary Figure S3. Most particles in grab samples were smaller than 500 µm, comprising 71% of the total. The particle size of the net samples was found to be >500 µm for 66% of the particles. As the sampling net’s 153-µm mesh would permit smaller particles to travel through, this difference was anticipated. Furthermore, the samples were dominated by fibers, which may have also been able to pass through the net’s mesh. Figure 3 shows the comparative sizes of microplastics collected from various sampling locations along the Delaware River.
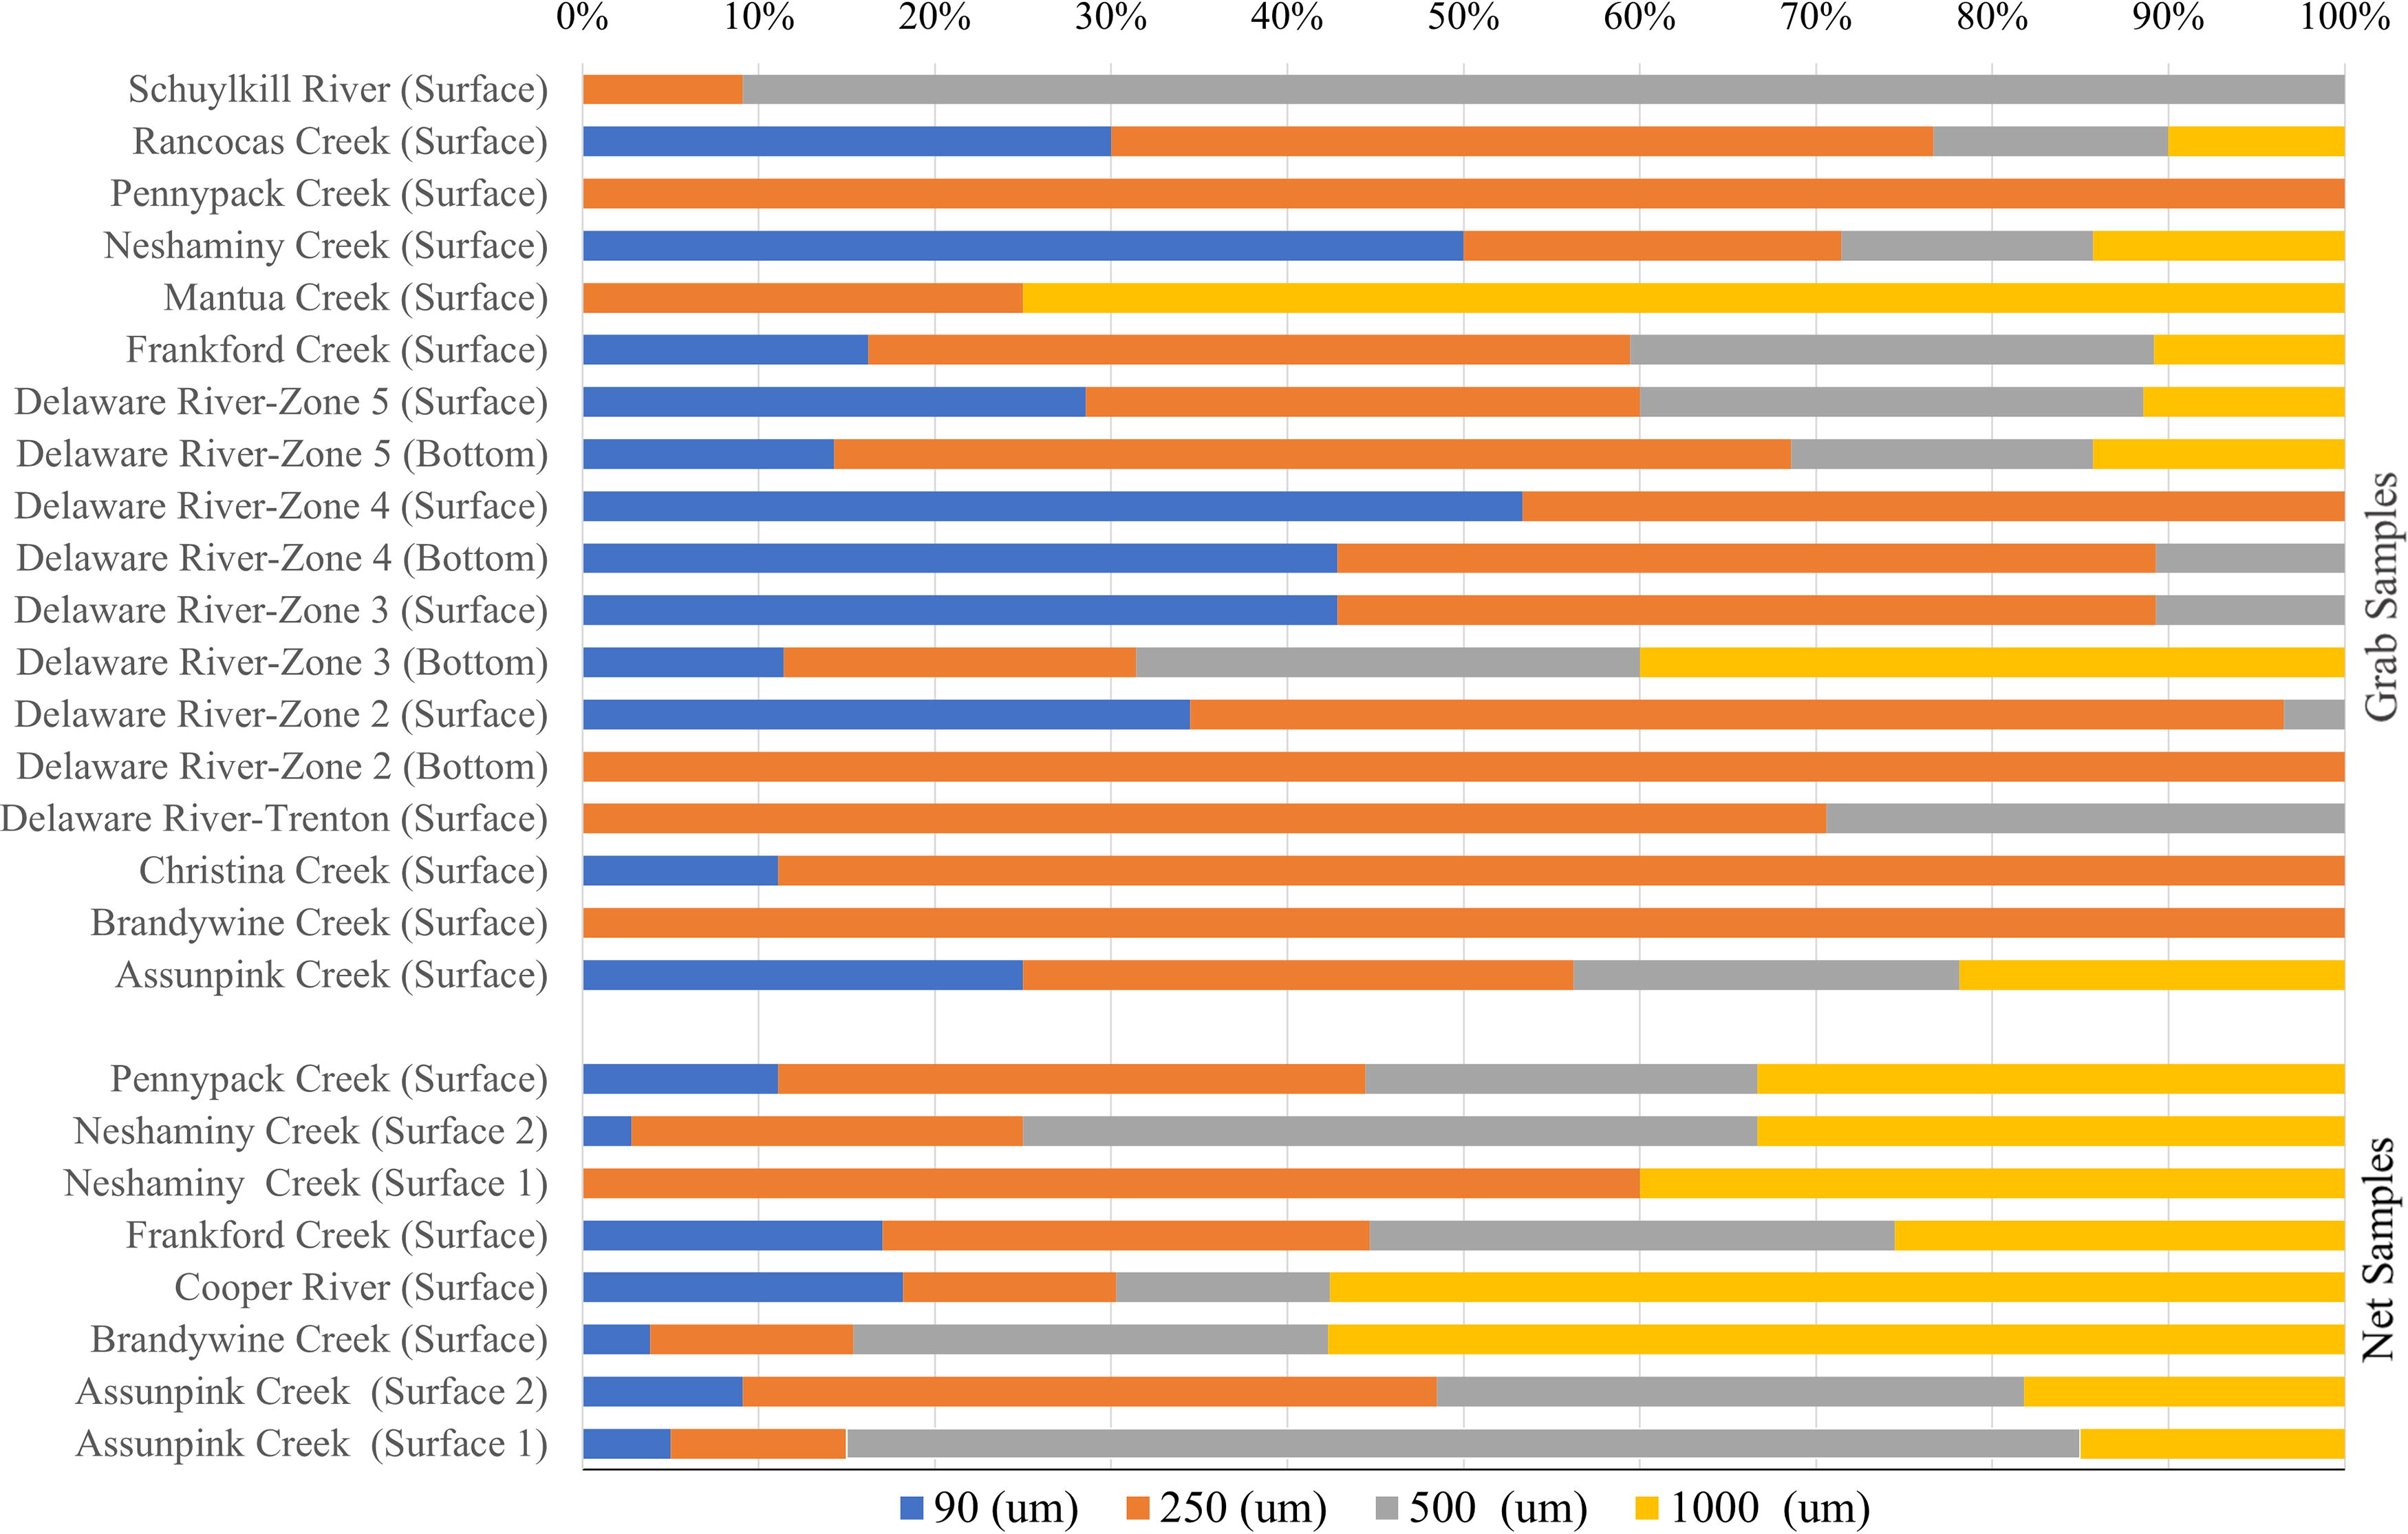
Size distribution (in µm) of microplastics collected at various sampling sites within the Delaware estuary and selected tributaries.
Microplastic colors
A diverse spectrum of colors of microplastics, including clear, pink, purple, red, orange, yellow, green, black, brown, gray, and white, were detected in samples collected from the Delaware estuary (Supplementary Fig. S2). As shown in Figure 4, the collected samples showed a prevalence of clear particles, with a majority consisting of fibrous materials. The color distribution of net samples was more uniform, with a preponderance of clear, blue, and black particles. The predominant colors of microplastics varied across sampling sites along the Delaware River, as illustrated in Supplementary Figure S4.

Color of microplastics collected at sampling locations in the Delaware estuary and selected tributaries.
Microplastic composition
The samples consisted of a diverse range of plastic materials (Fig. 5). The most prevalent types observed in the samples were polyester, rayon, and polyethylene. A variety of plastic materials was present in most sampling areas. The composition of microplastics at net sample sites predominantly consisted of polyester, polypropylene, and polyethylene, whereas grab sample sites showed a higher prevalence of polyester and rayon.
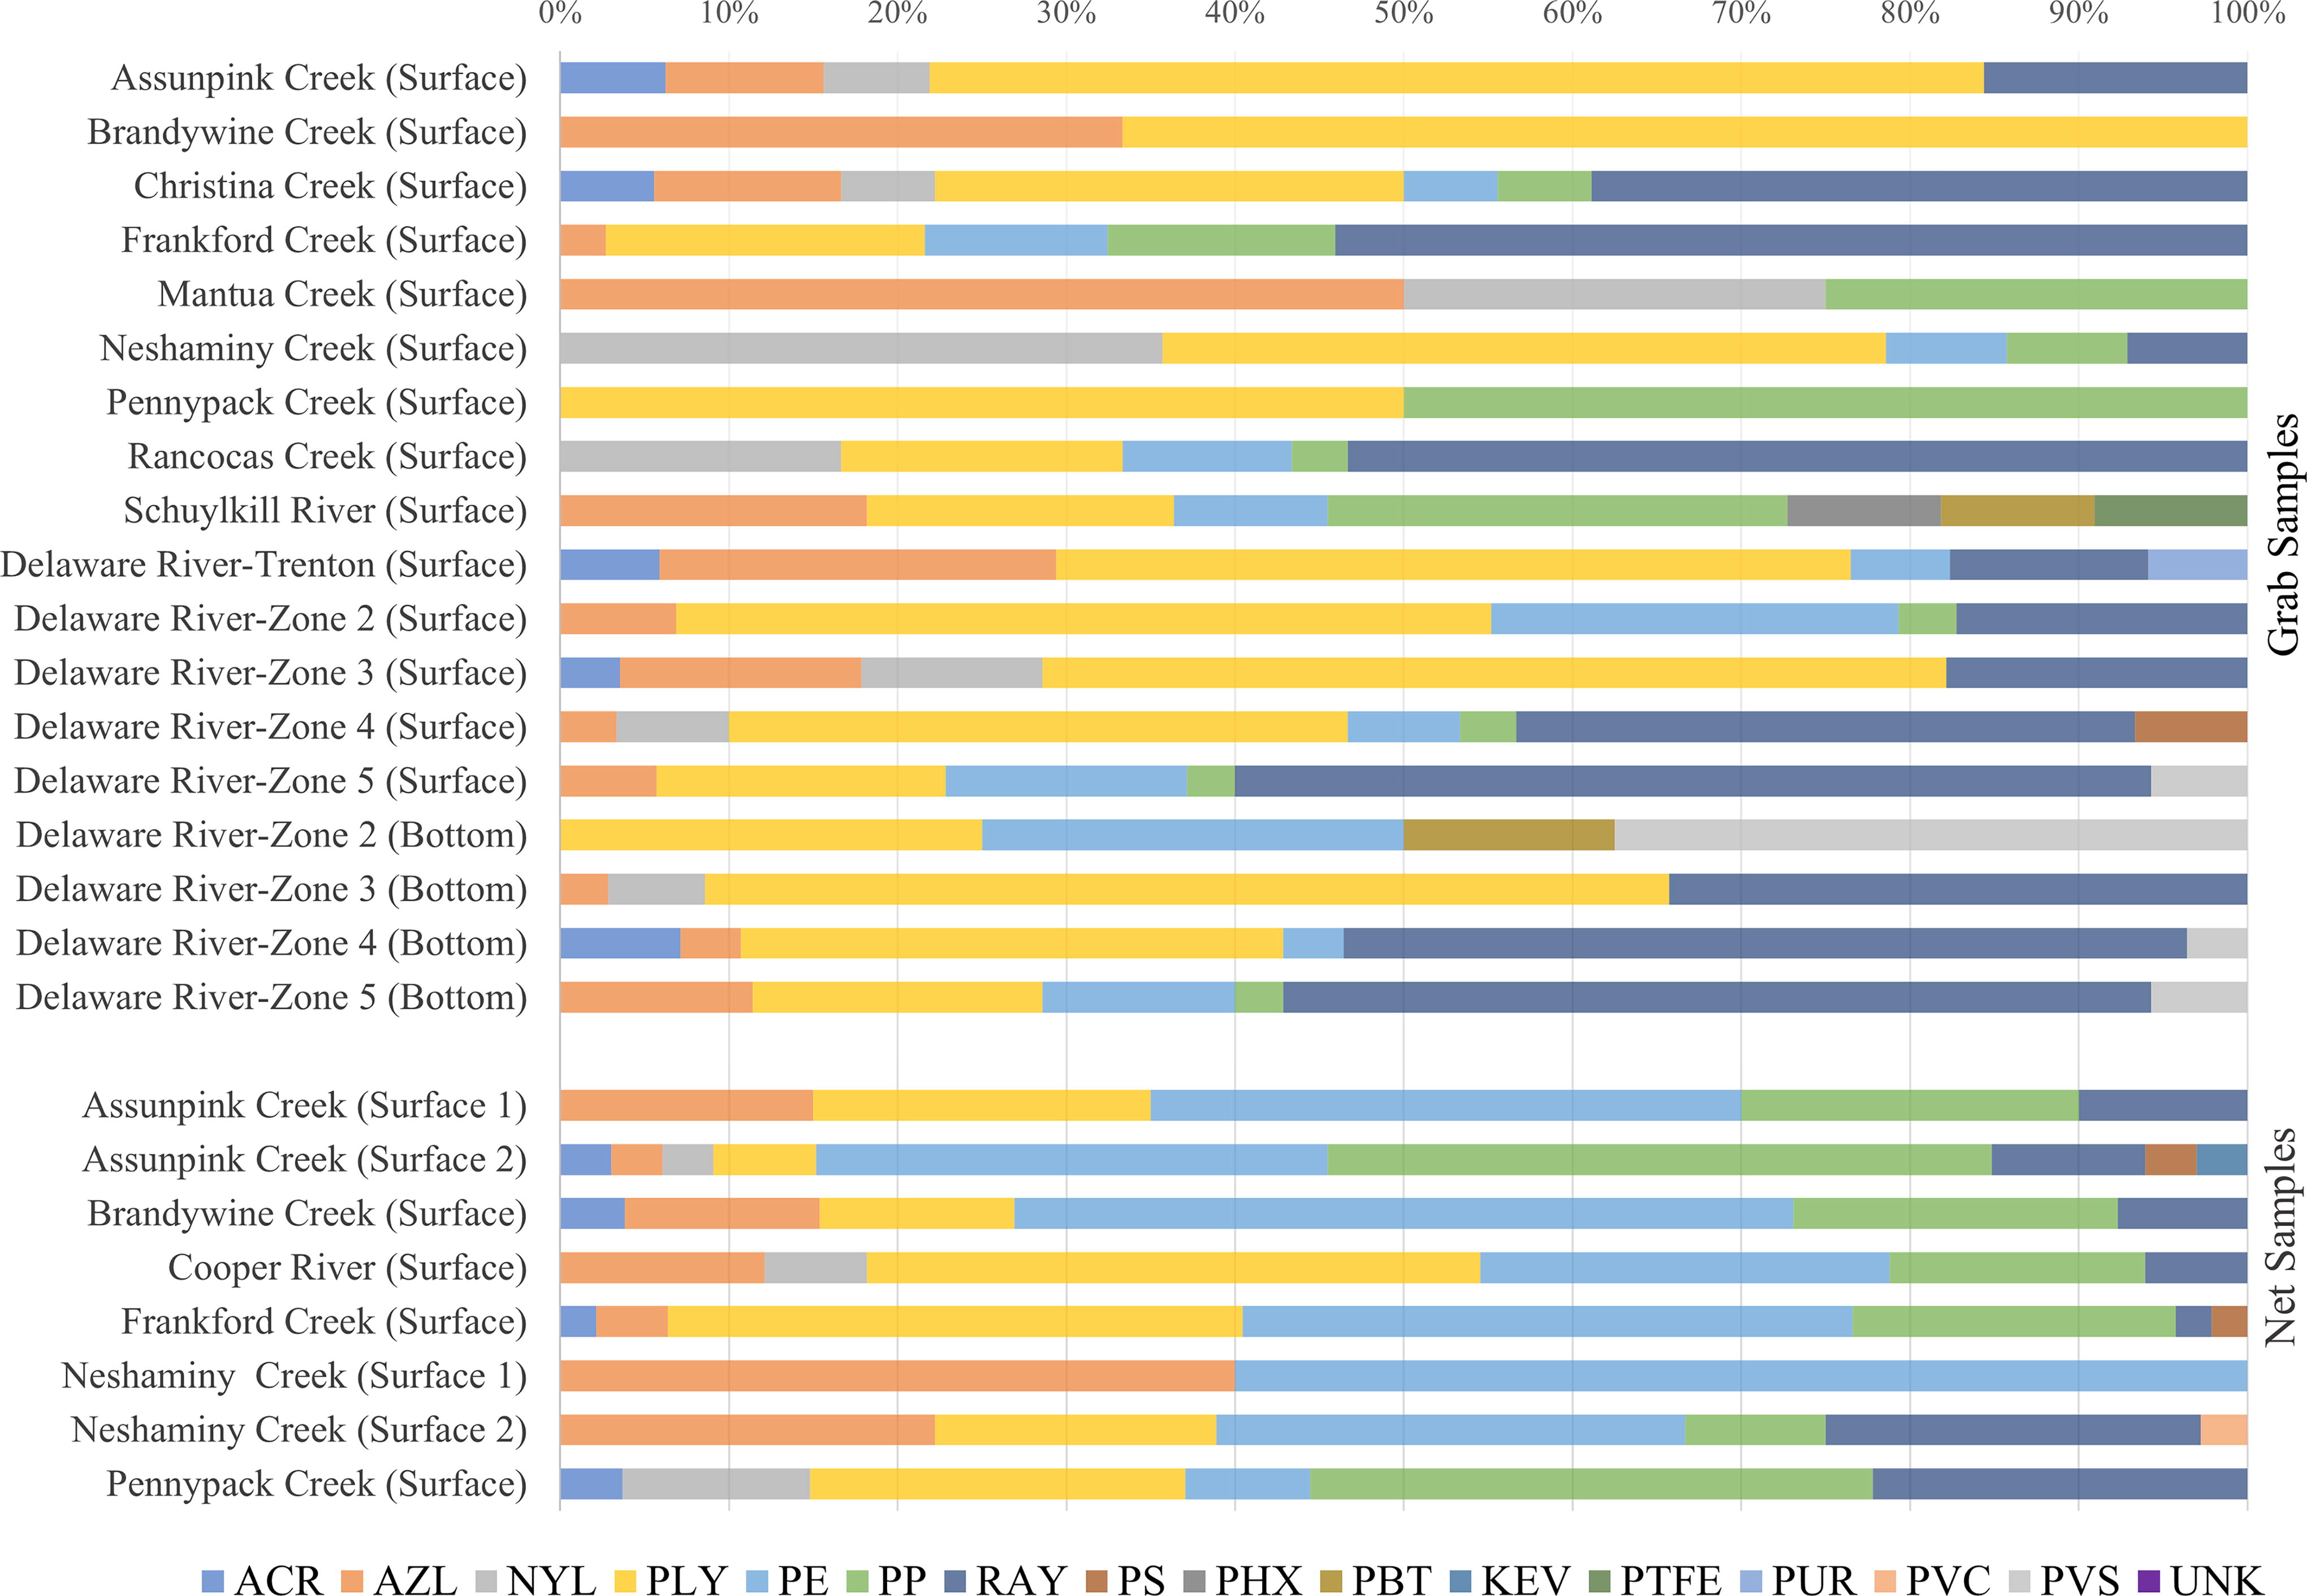
Composition of microplastics collected at sampling locations in the Delaware estuary and selected tributaries. ACR, acrylic; AZL, azlon; KEV, kevlar; NYL, nylon; PBT, polybutylene terephthalate; PE, polyethylene; PHX, poly-hexamethylene; PLY, polyester; PP, polypropylene; PS, polystyrene; PTFE, polytetrafluoroethylene; PUR, polyurethane; PVC, polyvinyl chloride; PVS, polyvinyl stearate; RAY, rayon; UNK, unknown.
Microplastic concentration
Microplastic particles were detected in all the samples. A disparity was seen in the levels of plastic concentrations based on the technique of collection. The grab samples showed elevated levels of plastic concentrations in comparison with the net samples. The concentrations of grab samples (Table 1) varied from 0.24072 to 7.08 particles/m3, with the highest concentrations observed in Rancocas Creek. Mainstem Delaware River grab samples generally indicated moderate to high concentrations of microplastics, and similar concentrations were observed in both surface and bottom collections. In contrast, net samples exhibited significantly lower microplastic concentrations compared with grab samples (Supplementary Fig. S5). The range for net samples was 0.000059 to 0.00268 particles/m3, with the highest concentrations found in the Cooper River. Notably, the Cooper River was not sampled using grab samplers, preventing a direct methodological comparison at this site.
Microplastic Concentrations (Particles/m3) in the Delaware Estuary and Selected Tributaries
Not Performed.
Discussion
Microplastics were detected at all studied locations through different collecting methods. Nonetheless, several distinctions were seen in terms of microplastic size, shape, color, concentration, and composition between the grab and net approaches. There appears to be a correlation between the shape of a microplastic particle and its content. For example, a spherical microplastic is typically polyethylene that often derives from cosmetic and personal care products (Napper et al., 2015). The study of composition is a crucial element in comprehending microplastics, since it enables the identification of the specific types of plastics that are being consumed and discarded within a given region. Based on the available data, it can be inferred that polyester emerges as the predominant microplastic seen in all analyzed samples. Polyester, commonly seen in the form of fibers or fiber bundles, is derived from synthetic textiles (Hernandez et al., 2017). Synthetic textiles are chemically synthesized materials that are typically derived from petroleum and designed to mimic natural fibers. Polyester is a frequently used synthetic polymer in the production of various textile products, including clothing and household materials such as blankets, bedsheets, pillowcases, and curtains (Hernandez et al., 2017). This can be suggestive of high anthropological activities and household sewage from nearby populations being the primary source of microplastics runoff into the river. Moreover, the production of fibers, specifically through the laundering process of synthetic textiles, results in their presence in washing machine effluent. likewise, the presence of industrial runoffs from nearby textile mills near the sampling locations, as shown in Supplementary Figure S6, could potentially be a contributing factor. The proximity of textile mills around Frankford, Pennypack, and Neshaminy sampling locations appears to be a potential contributing factor to the presence of polyester contamination (De Falco et al., 2019).
Furthermore, it is common for pellets present in personal care products, including exfoliants, to be detected in household wastewater. There have been found connections between residential areas and the presence of microplastic particles, where sources such as household wastewater, the construction of new residential buildings, and road networks contribute to the introduction of microplastics into aquatic ecosystems (Razeghi et al., 2021). Regarding the elevated amounts of polypropylene and polyethylene, Supplementary Figure S7 shows the presence of packaging and manufacturing firms located near the Delaware River. These sectors offer a range of products, including polyethylene and sealing materials. The observed phenomenon might be associated with the elevated levels of microplastics composed of polyethylene and polypropylene found in the analyzed samples.
The evaluation of microplastic concentration at a specific location enables the identification of areas that are more susceptible to contamination, hence facilitating the investigation into the underlying factors contributing to such contamination. The number of microplastics in freshwater bodies is thought to be influenced by several factors, including human population density near water bodies, the size of the water body, proximity to urban areas, water residence time, waste management systems, and the extent of sewage overflow (Eerkes-Medrano et al., 2015). The highest net sample concentration levels observed in Cooper River, and 100% of the net samples fell in the lower range of microplastic concentrations. The collected grab samples showed the highest particle concentrations in the vicinity to Rancocas Creek. The possible cause of this phenomenon may be related to the high population in the Rancocas Creek (Supplementary Fig. S8), which was recorded at roughly 6600 individuals according to the 2020 census. This could lead to increased residential discharge of contaminants, particularly in the case of pellets.
Grab samples had a more uniformly distributed range of microplastic concentrations, with low to mid-high concentrations. The least concentrated grab sample came from Pennypack Creek and the least concentrated net sample came from Neshaminy Creek. Pennypack Creek and Mantua Creek both run through the Pennsylvania suburbs outside of Philadelphia. These patterns are also evident in various waters across the globe, as previously noted. In the Great Lakes of North America, the densely populated Lake Erie exhibited pelagic microplastic counts of 1101 particles in tow of 3.87 kilometers (466305 particles/km2). In contrast, the less populated Lakes Huron and Superior recorded 15 particles in a tow of 3.76 kilometers (6541 particles/km2) and 15 particles in a tow of 1.94 kilometers (12645 particles/km2), respectively (Zbyszewski et al., 2014). These results indicate that the proximity of bodies of water to urban centers impacts the concentration of microplastics.
The observed information may have broad implications for microplastics research in freshwater environments. The effects of microplastics on fresh bodies of water are widely understudied. The accumulation of microplastics is a significant concern for the health of freshwater organisms, soil quality, and ultimately, crop production. The investigation into the potential adverse impacts of microplastics on both animals and humans is a matter of concern that has only recently come to light. Some studies have detected microplastics in feces, which show they can be ingested or inhaled and then excreted by animals and humans. Despite the potential for excretion, the distribution of microplastics throughout the body is dependent upon their size. Particles with a reduced size have a greater chance of entering the pulmonary alveoli, intestines, and potentially the brain (Qu et al., 2023). An unknown factor that could help mitigate microplastic accumulation is their origin source. Determining the primary source of a given microplastic segment is a challenging task. Instead, a source-apportion analysis is performed wherein the size, color, shape, and polymer type of the piece are examined (Rochman et al., 2019). This information helps predict the origin of microplastic particles. Using this formula would allow you to predict which sites are most affected by what products, thus being able to begin mitigating microplastic accumulation. In addition, comprehending homo aggregation, the behavior of microplastics that controls their mobility, distribution, and bioavailability, is an additional critical element that significantly influences microplastic distribution (Qu et al., 2023). We were able to make assumptions regarding the causes and sources of microplastic accumulation based on the outcomes of this investigation before applying the method. This research has the potential to lay the groundwork for future efforts aimed at comprehending the impact of microplastics in the Delaware estuary.
Future Modeling Study
This project represents an ongoing effort at the Delaware River Basin Commission (DRBC) to develop a modeling tool to investigate the transport dynamics of microplastics in the estuary (DRBC, 2022). The objective is to foresee and monitor the distribution of these particles within the ecosystem. The Delaware River Basin Commission developed a 3-D hydrodynamic model for the Delaware estuary using the USEPA-supported EFDC. The 3-D hydrodynamic model simulates hydrodynamics and transport processes with the degree of accuracy and confidence needed to support modeling objectives. The current model simulations serve as a preliminary proof of concept; however, certain crucial physical and chemical processes were not considered. Notably, the simulated conservative dye tracer lacks buoyancy and decay mechanisms in its representation. For this study, a release was simulated by mass release of 1 metric tons of conservative tracer over 24-h period at seven selected locations during a wet month (May 2019) and a dry month (September 2019). Majority of the microplastics were transported through the system in the surface and near-surface layers, and simulated concentrations in the surface layer are higher. For given scenario simulation, simulated microplastics concentration at the water surface were normalized by the maximum concentration at the release location and presented as percent of the maximum concentration to inform the trajectories, the relative concentration pattern, and footprint extent of microplastics being released into the Delaware estuary within a 5-day time window following the release.
The logarithmic color scale was used, and the red-to-pink color range represents a relative concentration of at least 0.1% of the maximum concentration observed in the simulation at one of the release locations (Fig. 6). According to these calculations, rapid dilution happened in a short amount of time, and concentration dropped by two to four orders of magnitude around the release location. Despite rapid dilution, microplastics concentration remained quite visible (more than 0.1%) for an extended period (10–20 days), depending on flow conditions. Under high-flow conditions, the concentration dissolved significantly faster, implying a shorter transit time and a greater microplastics footprint. The simulation also revealed some lateral variations, with the MP plume tending to move down the west bank (or east bank) if it was released from the west bank (or east bank) in the vicinity of the release site. The logarithmic color scale figures for additional locations are available in the supplementary information (Supplementary Fig. S9–Supplementary Fig. S15).

Modeled release at Neshaminy Creek at
Although this model has successfully calibrated key hydrodynamic parameters such as water surface elevation, current velocity, water temperature, and salinity, the component for simulating microplastic fate and transport remains under development. The microplastics fate and transport component have not been fully integrated or tested within our model. This is primarily because of the lack of comprehensive data necessary for effective model validation and to ensure accurate microplastics behavior predictions. As such, this section of our study does not yet offer a complete simulation of microplastic dynamics, but rather outlines ongoing and future studies using a numerical model that could greatly enhance our understanding of microplastic transport in Delaware Bay.
Conclusion
This study provides critical insights into microplastic contamination in the upper Delaware estuary, emphasizing the critical need for ongoing monitoring and appropriate management solutions to address this growing threat. The shape, size, color, content, and quantity of microplastics were studied across numerous sampling locations in this study. Our data show that polyester is the most prevalent microplastic composition, with fibers being the most common morphology—which may indicate the breakdown of polyester-based clothing materials disposed along the river. Although this study offers insightful information about the distribution and properties of microplastics in the Delaware estuary, it should be noted that it has some limitations. The application of one-time sampling, which might not adequately capture temporal variations in microplastic pollution, is the main drawback. Seasonal variations and event-driven spikes in microplastic deposition can be ignored by this snapshot method. In addition, the types of analytical techniques used placed limitations on the study; for example, the instrumentation available did not allow for the analysis of particles smaller than 50 µm. To further understand the dynamics of microplastic pollution, future research should consider longitudinal studies that involve multiple sampling events over various seasons. Furthermore, using advanced analytical methods like laser direct infrared spectroscopy could provide more comprehensive data on smaller microplastics. To obtain a more comprehensive understanding of the distribution and origins of microplastics, the study’s geographical scope could be extended to encompass additional regions of the river system.
The used hydrodynamic model demonstrates that microplastics primarily remain in upper water layers, diluting over time but detectable for up to 20 days, and their distribution is affected by flow conditions. This study not only improves our understanding of microplastic contamination in the Delaware estuary but also lays the groundwork for future programs focused on investigating the consequences, distribution, bioaccumulation, and sources of microplastics. It emphasizes the importance of best management techniques to reduce microplastic dispersion and urges for more data collection in freshwater inputs to improve our understanding of microplastic pathways and fates in coastal ecosystems.
Footnotes
Acknowledgment
Opinions, findings, and conclusions expressed in this paper are those of the authors and do not necessarily reflect the views of Temple University or DRBC. Also, we would like to acknowledge the contributions from the poster presentation at the 2023 Delaware River Watershed Summit, which formed a foundational basis for some aspects of this research. The poster, entitled “Assessment of Microplastic Pollution in the Delaware River,” provided preliminary insights that have been further explored and expanded upon in this study. A full citation of the poster is as follows: Bransky, jake. (2023). Assessment of Microplastic Pollution in the Delaware River. Poster presented at the Delaware River Watershed Summit. Retrieved from  .
.
Authors’ Contributions
E.A.: Writing—original draft. L.P.: Methodology. T.S.: Writing—original draft. R.S.: Writing—review and editing. S.J.: Sampling, sample processing, data analysis, and resources. J.B.: Sampling, resources; and review and editing. F.C.: Modeling, software, review and editing. G.A.: Data analysis, data processing, conceptualization, writing—review and editing, and funding acquisition.
Authors Disclosure Statement
The authors declare that they have no competing interests, including but not limited to personal financial interests, funding sources, employment affiliations, or any other relationships that may inappropriately influence the integrity of work reported in this paper.
Funding Information
This project was funded by the
References
Supplementary Material
Please find the following supplemental material available below.
For Open Access articles published under a Creative Commons License, all supplemental material carries the same license as the article it is associated with.
For non-Open Access articles published, all supplemental material carries a non-exclusive license, and permission requests for re-use of supplemental material or any part of supplemental material shall be sent directly to the copyright owner as specified in the copyright notice associated with the article.
