
Abstract
The stability of calcium alginate beads for microalgae immobilization in wastewater treatment has been a concern due to the potential exchange of Ca2+ ions from the bead surface with the environment. To overcome this constraint, adding biopolymers might improve the properties of alginate gel. The purpose of the study is to immobilize Chlorella vulgaris in blends of sodium alginate with carboxymethylcellulose (CMC) or pectin in different concentrations (1%, 1.5%, and 2%) to evaluate the microalgae growth and nutrient removal from culture media. The microalgae growth was assessed by cell counting and chlorophyll content using a fluorescent excitation–emission matrix. Nutrient removal was conducted by measuring the phosphate and nitrate concentration using ion chromatography. The characterization of beads, such as size, shrinkage degree, swelling ratio, water content, and dry weight, was also investigated. Compared to alginate-only beads, the results present better performance for cell growth and, similarly, for removing nutrients in the presence of pectin and CMC blends. Microalgae in alginate with 1.0% of pectin grew 26% more than in alginate-only beads on day 8. The blends with CMC showed faster removal of nutrients compared to pectin blends and alginate-only in only 3 days. For phosphate, the highest removal was by immobilized microalgae of 95% for 2.0% of CMC and 86% for 2.0% of pectin. For nitrate, the immobilized microalgae removed 100% in 1.0% and 1.5% of CMC and 98% in 1.0% of pectin.

Introduction
Cell immobilization in biopolymers is a well-established approach in industries such as medicine, cosmetics, and food processing. It is used to immobilize whole cells, algae, bacteria, and for medication delivery. This method has been extensively researched because it involves biopolymers derived from natural resources that are nontoxic to all living cells, prokaryotic cells, and eukaryotic cells. The commonly used biopolymers are calcium alginate, agarose, chitosan, k-carrageen, cellulose, etc. In addition, it has shown promising to preserve microalgae biomass and remove nutrients (Ruiz-Marin et al., 2009; Zhang et al., 2012).
However, the immobilization in calcium alginate during the application still shows limitations such as cell leaking and disruption/dissolution (Banerjee et al., 2019; Faafeng et al., 1994; Mohseni et al., 2021; Travieso et al., 1996; Wang et al., 2016). Therefore, the blend of biopolymers could increase properties and be a good solution.
In studies, calcium alginate beads demonstrated limited resistance when applied to different types of wastewaters, resulting in beads changing their shape or dissolving (Cruz et al., 2013; Kube et al., 2018). The main reason for bead dissolution is the exchange of calcium ions for chelator ions 2+ presented in cultivation solution or wastewater (Wiederschain, 2007). To avoid the dissolution, the researchers have investigated an excess of calcium added to the cultivation, and therefore, it could raise the shrinkage of beads (Bajpai and Sharma, 2004; Davidovich-Pinhas and Bianco-Peled, 2009). The researchers have studied methods to enhance alginate beads, focusing on factors such as the type of alginate, the concentration of alginate and calcium chloride, and the size of the beads. The types of alginate examined were medium viscosity, low viscosity, and food grade. The results showed the beads made with food grade and lower viscosity did not lose strength or change size. In addition, lower viscosity alginate showed high microalgae biomass content (Kube et al., 2019). Another study analyzed the variation of alginate concentration, resulting in the lower concentration of alginate showing the highest surface pore size and porosity. However, it presented more suitable for cell leakage (Banerjee et al., 2019). Even though increasing the concentration of alginate and calcium chloride still observed cell leakage from the beads (Wang et al., 2016). The optimal bead size for removing nutrients and cell viability is 3.5 mm for Chlorella Vulgaris immobilized in alginate beads (Lee et al., 2020).
For this reason, adding biopolymers could be an option to enhance cell viability and strength. It could reduce ion exchange and prevent swelling or shrinkage of the beads, allowing their application in wastewater treatment. Pectin and carboxymethylcellulose (CMC) are suitable biopolymers for this purpose. These two biopolymers are dissolved at low temperatures, so cell viability is unaffected. It is an advantage over other biopolymers that requires a high temperature to dissolve, such as agarose and chitosan (Gasperini et al., 2014).
Alginate, a water-soluble polysaccharide, and pectin, a polysaccharide extracted from plant cell walls, are commonly used in the cosmetic and medical industries as functional drug delivery carriers, gelling agents, and stabilizers. The gelation mechanism is the same as alginate (egg-box model), which describes two antiparallel polyuronate chains that form egg-box dimers with Ca2+ and further aggregate laterally to form multimers (Cao et al., 2020). Adding pectin to alginate beads improved stability against physical and chemical denaturants (Matto and Husain, 2006). The blend of alginate and pectin has only been studied in enzyme applications, indicating the potential for further exploration in microalgae applications.
Another water-soluble polysaccharide is CMC, derived from celluloses. The addition of this biopolymer in alginate beads has shown good mechanical and thermal properties and avoids antimicrobial activities. This blend to immobilize C. vulgaris showed favorably cell growth and lipid content in microalgae in 10 days of application in the cultivation medium (Abu Sepian et al., 2019). However, the researchers have only investigated the CMC blend with a mix of alginates and in one concentration. It leaves ample opportunity for further investigation into its impact on microalgae growth.
This study aims to evaluate the concentration of the biopolymers pectin and CMC in alginate gel to improve properties and the mechanical performance of the C. vulgaris beads, such as the morphology, degree of shrinkage and swelling ratio, and maintain the viability of the microalgae evaluating the concentration of cell during the cultivation, chlorophyll, and removal nutrients.
Material and Methods
Cultivation procedure
C. Vulgaris (CS-42) was obtained from the CSIRO Australian National Algae Culture Collection and cultured in Jaworski’s medium. The microalgae were grown in 500 mL Erlenmeyer flasks in a temperature cycling chamber incubator (Labec, Australia) subjected to aeration, light control of 16/8 h light/dark cycle, with associated temperature control at 21°C and 16°C, respectively.
The harvested microalgae were when the microalgae concentration achieved the exponential phase. The cells samples were centrifuged for 5 min at 5000×g at room temperature.
Preparation of blend beads
A sodium alginate solution stock was prepared with low-viscosity sodium alginate (Sigma-Aldrich 71238) in purified (Mili-Q) water in a concentration of 4 g.L−1. The solutions of CMC (Sigma-Aldrich 9004324) and pectin (Sigma-Aldrich 9000695) were made in three concentrations. The harvested cells were added to the solutions and diluted twice in volume, resulting in sodium alginate 2% plus the CMC (1%, 1.5%, 2%), ACMC, or Pectin (1%, 1.5%, 2%), APECT. The blend solution of ACMC or APECT and microalgae was added in a burette of 50 mL and dropped into a 0.2 M CaCl2 solution in constant stirring (Ruiz-Marin et al., 2009). The beads were kept in this solution for 2 h to promote crosslinking and bead hardening (Riddle et al., 2004). Before the application, the beads were washed twice in purified (Mili-Q) water. The control beads were prepared by adding harvested cells to a sodium alginate suspension, which was diluted to a final concentration of 2% (v/v) sodium alginate, and formed and hardened following the same procedure used for the other bead preparations.
Experimental setup
The beads, 1000 units, were added in 400 mL of Jaworski media and subjected to the same conditions of cultivation procedures described above. Samples of 20 beads and 20 mL of media were collected after days 1, 3, 5, and 8 to analyze the cells, beads, and media for characterization. These days represent the microalgae growth phase based on the microalgae growth curve in the microalgae cultivation (data not shown in this study).
Cells characterization
The cell concentration was measured by dissolving 5 or 10 beads in NaCO3 2% w/w and counted through the light microscope with a hemocytometer (Covarrubias et al., 2012). The samples to measure the chlorophyll fluorescence were made of 2 mL of dissolved beads and 2 mL of the cultivation media and were analyzed by fluorescence spectroscopy using a Horiba Spectrophotometer.
The samples were analyzed to obtain a fluorescence excitation–emission matrix (EEM) using a modified method described by Hambly et al. (2010). The fluorescence EEM landscapes were acquired by recording the emission spectra from 200 to 800 nm, and excitation wavelengths were between 200 and 800 nm. Both excitation and emission slits were set at 5 nm. All the measurements were carried out at room temperature (25.0 ± 0.5°C) in the dark.
The suspended cells samples only were dissolved in the cultivation media when the cells were in a high concentration. The beads were cultivated for 8 days, and the experiments were carried out in triplicate.
Beads characterization
The characterization of beads was performed by measuring diameter size, dry weight, water content, swelling ratio, and shrinkage degree parameters to evaluate stability. A sample of 10 beads was added to a Petri dish, and images were taken with a camera. The images were analyzed by ImageJ®. The shrinkage degree (1) was measured through the rate of bead size at the beginning (
Nutrients uptake
The media samples, appropriately diluted before, were measured by ion chromatography. The nutrient removal rate (NRR) is calculated in Eq. 4:
Statistical analysis
All experiment results were given as mean ± standard deviation (SD) from three replicates. The influence of blends of biopolymers or alginate-only, the effect of the microalgae concentration, and the removal of nitrate and phosphate were evaluated statistically by repeated measures ANOVA followed by Tukey HSD pairwise comparison analysis using SPSS Statistics 26.0. This study considered the level of significance of the value of p < 0.01.
Results and Discussions
Influence of microalgae growth in the blends
Table 1 presents the initial and final concentration of cells for all blends and the cell growth rate. The growth curves of the C. vulgaris immobilized in alginate-only or the blends are presented in Figure 1 and correspond well with the exponential growth model.
The Initial and Final Concentration of Chlorella Vulgaris Immobilized in Alginate-Only and Blends of Alginate and Pectin or CMC in Three Concentrations (1.0, 1.5, and 2.0 %) and Growth Rate
Results are presented by mean ± SD, n = 3. Means followed by the same letter in a column did not differ significantly, Tukey test, p < 0.01.
CMC, carboxymethylcellulose; SD, standard deviation.

Plot of concentration and chlorophyll fluorescence in Chlorella vulgaris immobilized in alginate-only, CMC, and pectin blends cultivated in Jaworski’s medium with constant aeration, light control of 16/8 h light/dark cycle, with associated temperature control of 21/16°C for 8 days. All plotted data were mean ± standard deviation of n = 3, except for chlorophyll fluorescence. CMC, carboxymethylcellulose.
The results showed the initial and final concentration of cells and the growth rate affected by the blend of biopolymers (p < 0.01). Microalgae on blends beads presented the highest initial cell concentration compared to alginate-only (A) and APECT 2.0%. The higher initial concentrations were in APECT 1.0% and ACMC 1.5%, 1.49.10+6 ± 2.78.10+4 cells.bead−1 and 1.45.10+6 ± 1.25.10+4 cells.bead−1, respectively. The lowest initial concentration was APECT 2.0%, with 9.82.10+5 ± 6.68.10+4 cells.bead−1, which has a lower concentration at the end of the experiment, 3.52.10+6 ± 7.22.10+5 cells.bead−1.
As shown in Figure 1, the difference in results between the CMC concentrations and alginate-only is noticed on day 8. The microalgae concentration was more elevated in the alginate-only beads (A) than in CMC blend beads. It demonstrated that the concentration of CMC in the blends affected the microalgae growth (p < 0.01). In comparison with ACMC concentrations, ACMC 1.5% showed higher growth of cells than ACMC 2%.
For pectin concentrations, specifically in APECT 1.5% and APECT 2%, the microalgae in alginate-only (A) beads have grown more than in these pectin concentrations (Fig. 1). On the other hand, in APECT 1%, the microalgae grew over 25% compared to cells in alginate-only beads. It suggests that cell growth depended on the concentration of APECT (p < 0.01); moreover, it is only noticed on day 8. For APECT 1%, the maximum concentration of cells achieved was 1.81.107 ± 5.69.106 cell.bead−1, for 1.5% it was 9.27.106 ± 1.54.106 cell.bead−1, and for 2% it was 3.52.106 ± 7.22 105 cells.bead−1. Overall, the cell growth was constant across all concentrations on the other days.
Other studies support the current findings that observed lower concentrations of cells in the alginate/pectin blend (Voo et al., 2011). The probiotic cells in the blends were investigated compared with alginate-only, which had a high concentration of cells. A high biopolymer concentration may reduce cell growth space or increase the mass transfer limitation. The combination of biopolymers could add more flexibility. However, it could limit cell growth due to the specificity of the additive, such as its viscosity and pH. Furthermore, other parameters, such as the microstructure porosity and the average size of encapsulated carriers, are essential for maintaining cell viability (Zamani et al., 2012).
The chlorophyll content in the blend compared to the microalgae growth is shown in Figure 1. The higher peak was λem= 687 nm corresponding to chlorophyll wavelengths (Moberg et al., 2001). The highest intensity of chlorophyll is in alginate-only (A) beads and APECT 1% beads, supporting the highest concentration of cells at the end of the experiment. In other blends of biopolymers, this intensity is lower than five relative fluorescence units (RFU).
In Figure 2, the ACMC 2% and APECT 2% showed weaker intensity of green coloration in contrast with other blends and concentrations. The cell growth results are also supported by the intensity of chlorophyll content in the beads, which increased for all experiments. However, some differences are observed. The biopolymers influenced the chlorophyll content. In alginate-only, the chlorophyll intensity is over 10 RFU; for the others, it is lower than 5 RFU, except for 1% of pectin, which was around 7 RFU. Two principal factors related to chlorophyll production by microalgae cells are light, macronutrients (nitrogen, carbon, and phosphorus), and micronutrients (da Silva Ferreira and Sant’Anna, 2017).
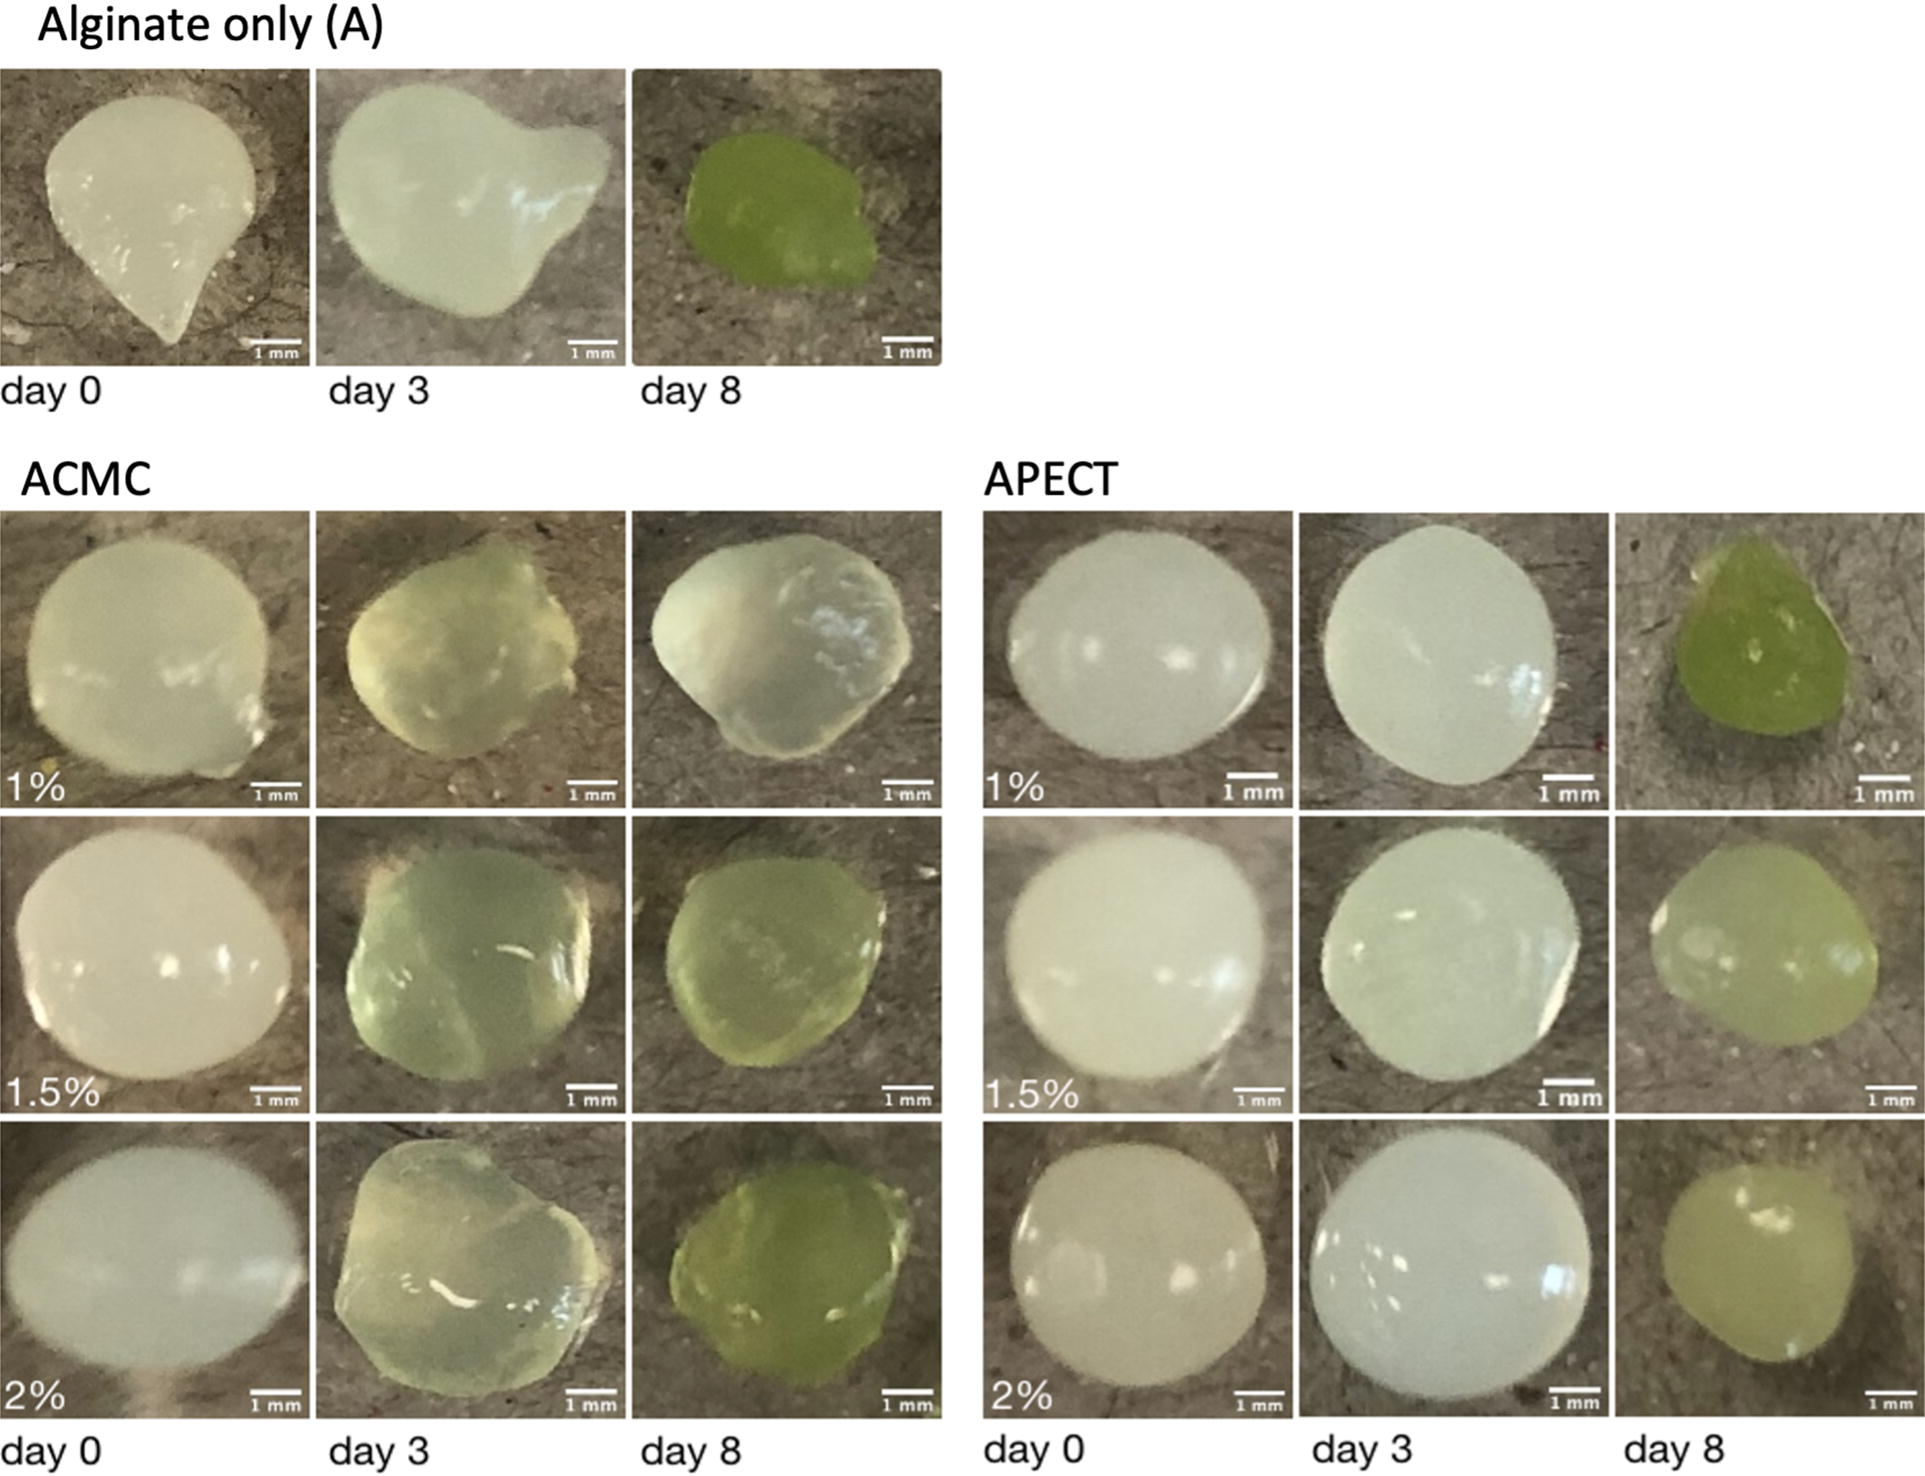
Beads of Chlorella vulgaris immobilized in alginate-only and alginate blends with 1–2% of CMC and with 1–2% of pectin for 8 days. CMC, carboxymethylcellulose.
Furthermore, obtaining the maximal photochemical efficiency and productivity is related to the density of cultivated cells (Peña et al., 2009). These factors are usually controlled in cultivation. However, in the cultures with immobilized microalgae, the interference of light and temperature is not well investigated. Alginate-only (A) and APECT 1% demonstrated apparent flexibility and photosensitivity for cells, allowing for cell growth and photosynthesis. On the other hand, in the first days, the immobilized cells demonstrated a limitation in chlorophyll production and, consequently, a lower output of cells.
Influence of physical characteristics of the biopolymer additives on the blends
The physical characteristics are important for observing the effects of additives on the alginate matrix and their influence on the performance of microalgae. The structure of beads is considered unstable when more than 10% of the total beads lose their shape due to disruption or dissolution of the matrix (Moreira et al., 2006). The stability of beads was measured by bead swelling and shrinkage. The measurements of bead diameter, bead dry weight, water content, swelling ratio, and shrinkage degree are shown in Table 2.
Characterization of Alginate-Only and Blend Beads
Results are presented by mean ± SD, n=3. Means followed by the same letter in a column did not differ significantly, Tukey test, p<0.01.
Comparing all blends and alginate-only, blend beads initially appeared light green, gradually darkening over time, similar to those with alginate-only, as shown in Figure 2. It suggests the cell growth inside the bead, supporting the previous chlorophyll finding. Analyzing the alginate-only (A) beads, the shape of beads had a format of a tear with a tale that remained during the experiment time and similarly was for ACMC 1%. As the concentrations of the additives increased, the beads took on a round shape. However, this shape changed during the course of the experiment. The beads showed the same format for all experiments with APECT 1% and APECT 2%. The viscosity of the biopolymer solution appears to relate to the shape of the beads. The sodium alginate used in this study was in lower viscosity, which contributed to forming tails in the beads, as seen in alginate-only (A) beads (Ching et al., 2017).
The diameter of the beads increased with the addition of additives (Table 2). The average bead size of alginate was 2.42 mm, and due to the addition of 2% of CMC and 2% of pectin, the diameter rose by around 20%. Consequently, the weight of beads increased with adding additives, around 0.06–0.09 g, except for the ACMC 1%. It agrees with a study that has already been developed, which mixed gelatin in alginate beads to immobilize osteoblastic cells (Li et al., 2019). The viscosity of the biopolymer solution, the diameter of the burette role, and the distance between the solution to the exit point from the gelling bath affect the size of the beads (Lee et al., 2013). The only distinction was that when the additive was added to the alginate solution, the viscosity increased. Furthermore, the alginate type is also related to the viscosity and the size of the beads (Kube et al., 2019).
The water content in the beads is consistent at around 95%, regardless of biopolymer type, and this determines the oxygen diffusivity (Omar and Rohani, 2015). In addition, the alginate beads, with a water content of 95%, have a diffusion coefficient of oxygen magnitude of ×10−6 cm2s−1 (Elsayed et al., 2014).
The shrinkage degree and swelling degree indicate the capacity of the beads to reduce and expand the volume. Adding CMC in alginate beads compared to the alginate-only beads increased the swelling degree. In contrast, the shrinkage ratio decreased with the addition of CMC. The concentration of pectin reduced the ability of beads to swell and contract. APECT 1% and alginate-only beads have shown similar swelling ratios and shrinkage degrees. Shrinkage is expected for alginate and other gels (Santagapita et al., 2012; Teixeira et al., 2014). It is also related to shape deformation and pore formation (Vargas et al., 2018). Furthermore, this phenomenon can explain the different physicochemical characteristics of the biopolymers.
Nutrients uptake
The initial concentrations of nitrate and phosphate in Jaworski media were 67.189 ± 2.38 mg.L−1 and 34.692 ± 6.60 mg.L−1, respectively, for all experiments. The nutrient concentration decreased during the experiment, as illustrated in Figure 3 for nitrate and Figure 4 for phosphorus. Table 3 shows the removal of the nutrients and removal rate by the microalgae immobilized in alginate-only and blends.
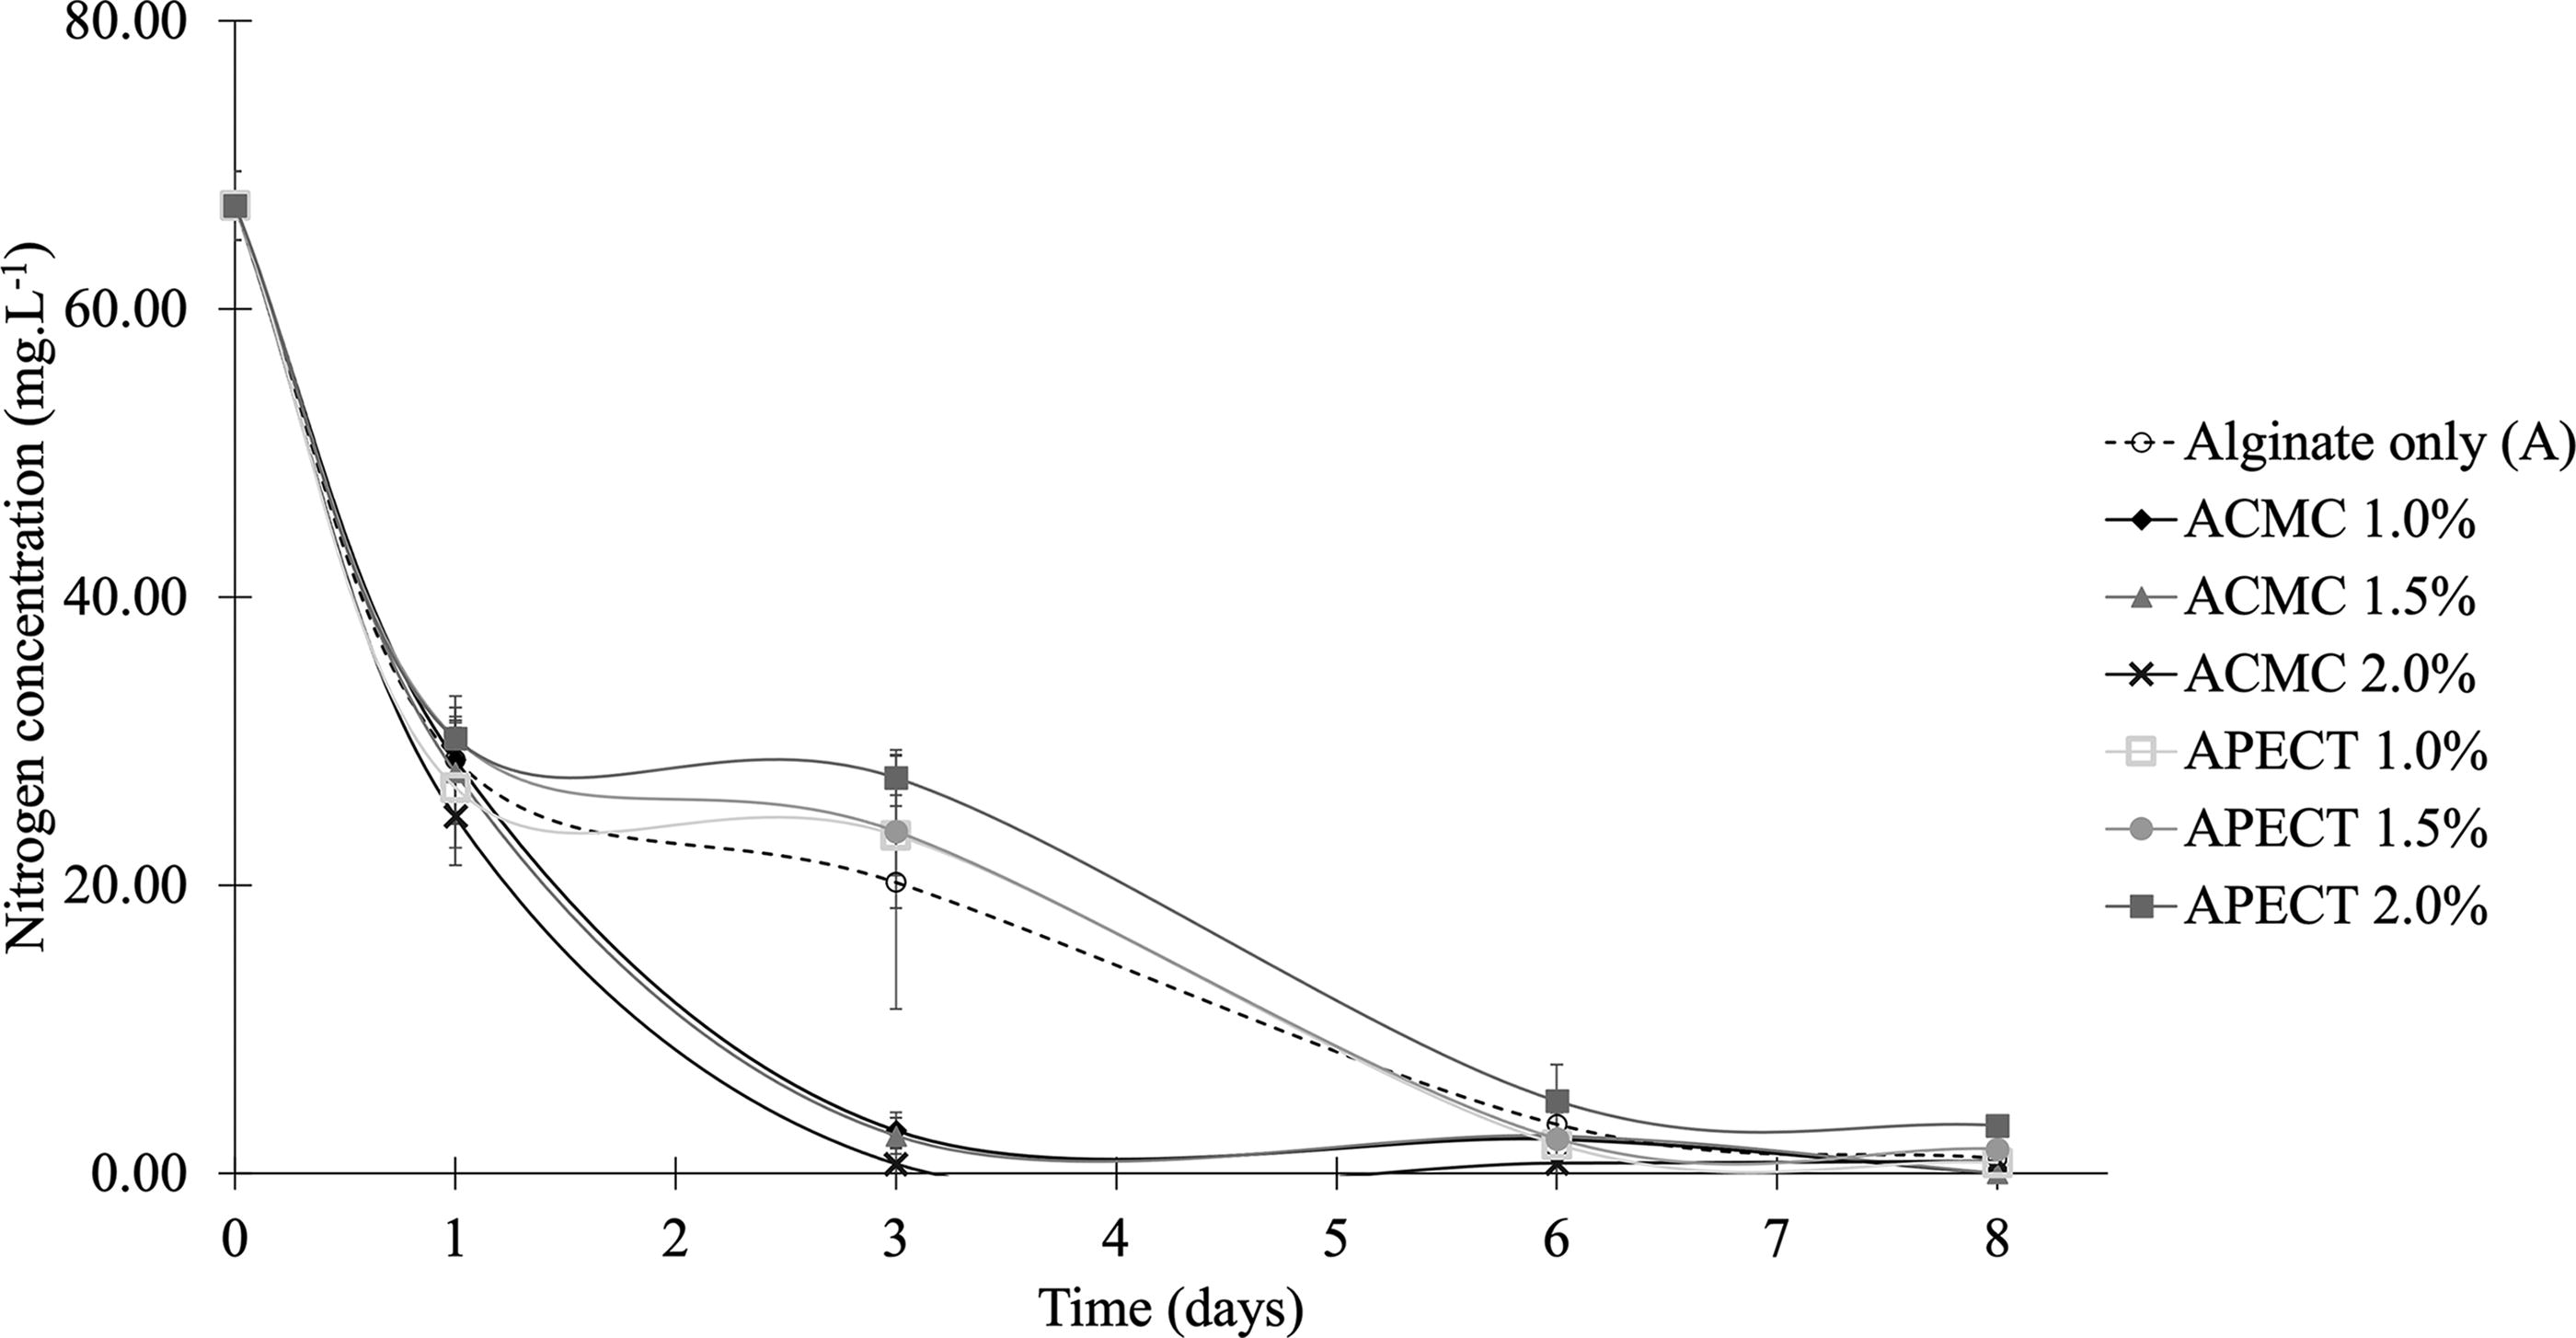
Nitrate concentration is by alginate-only, and blend beads in mg.L-1 for 8 days.
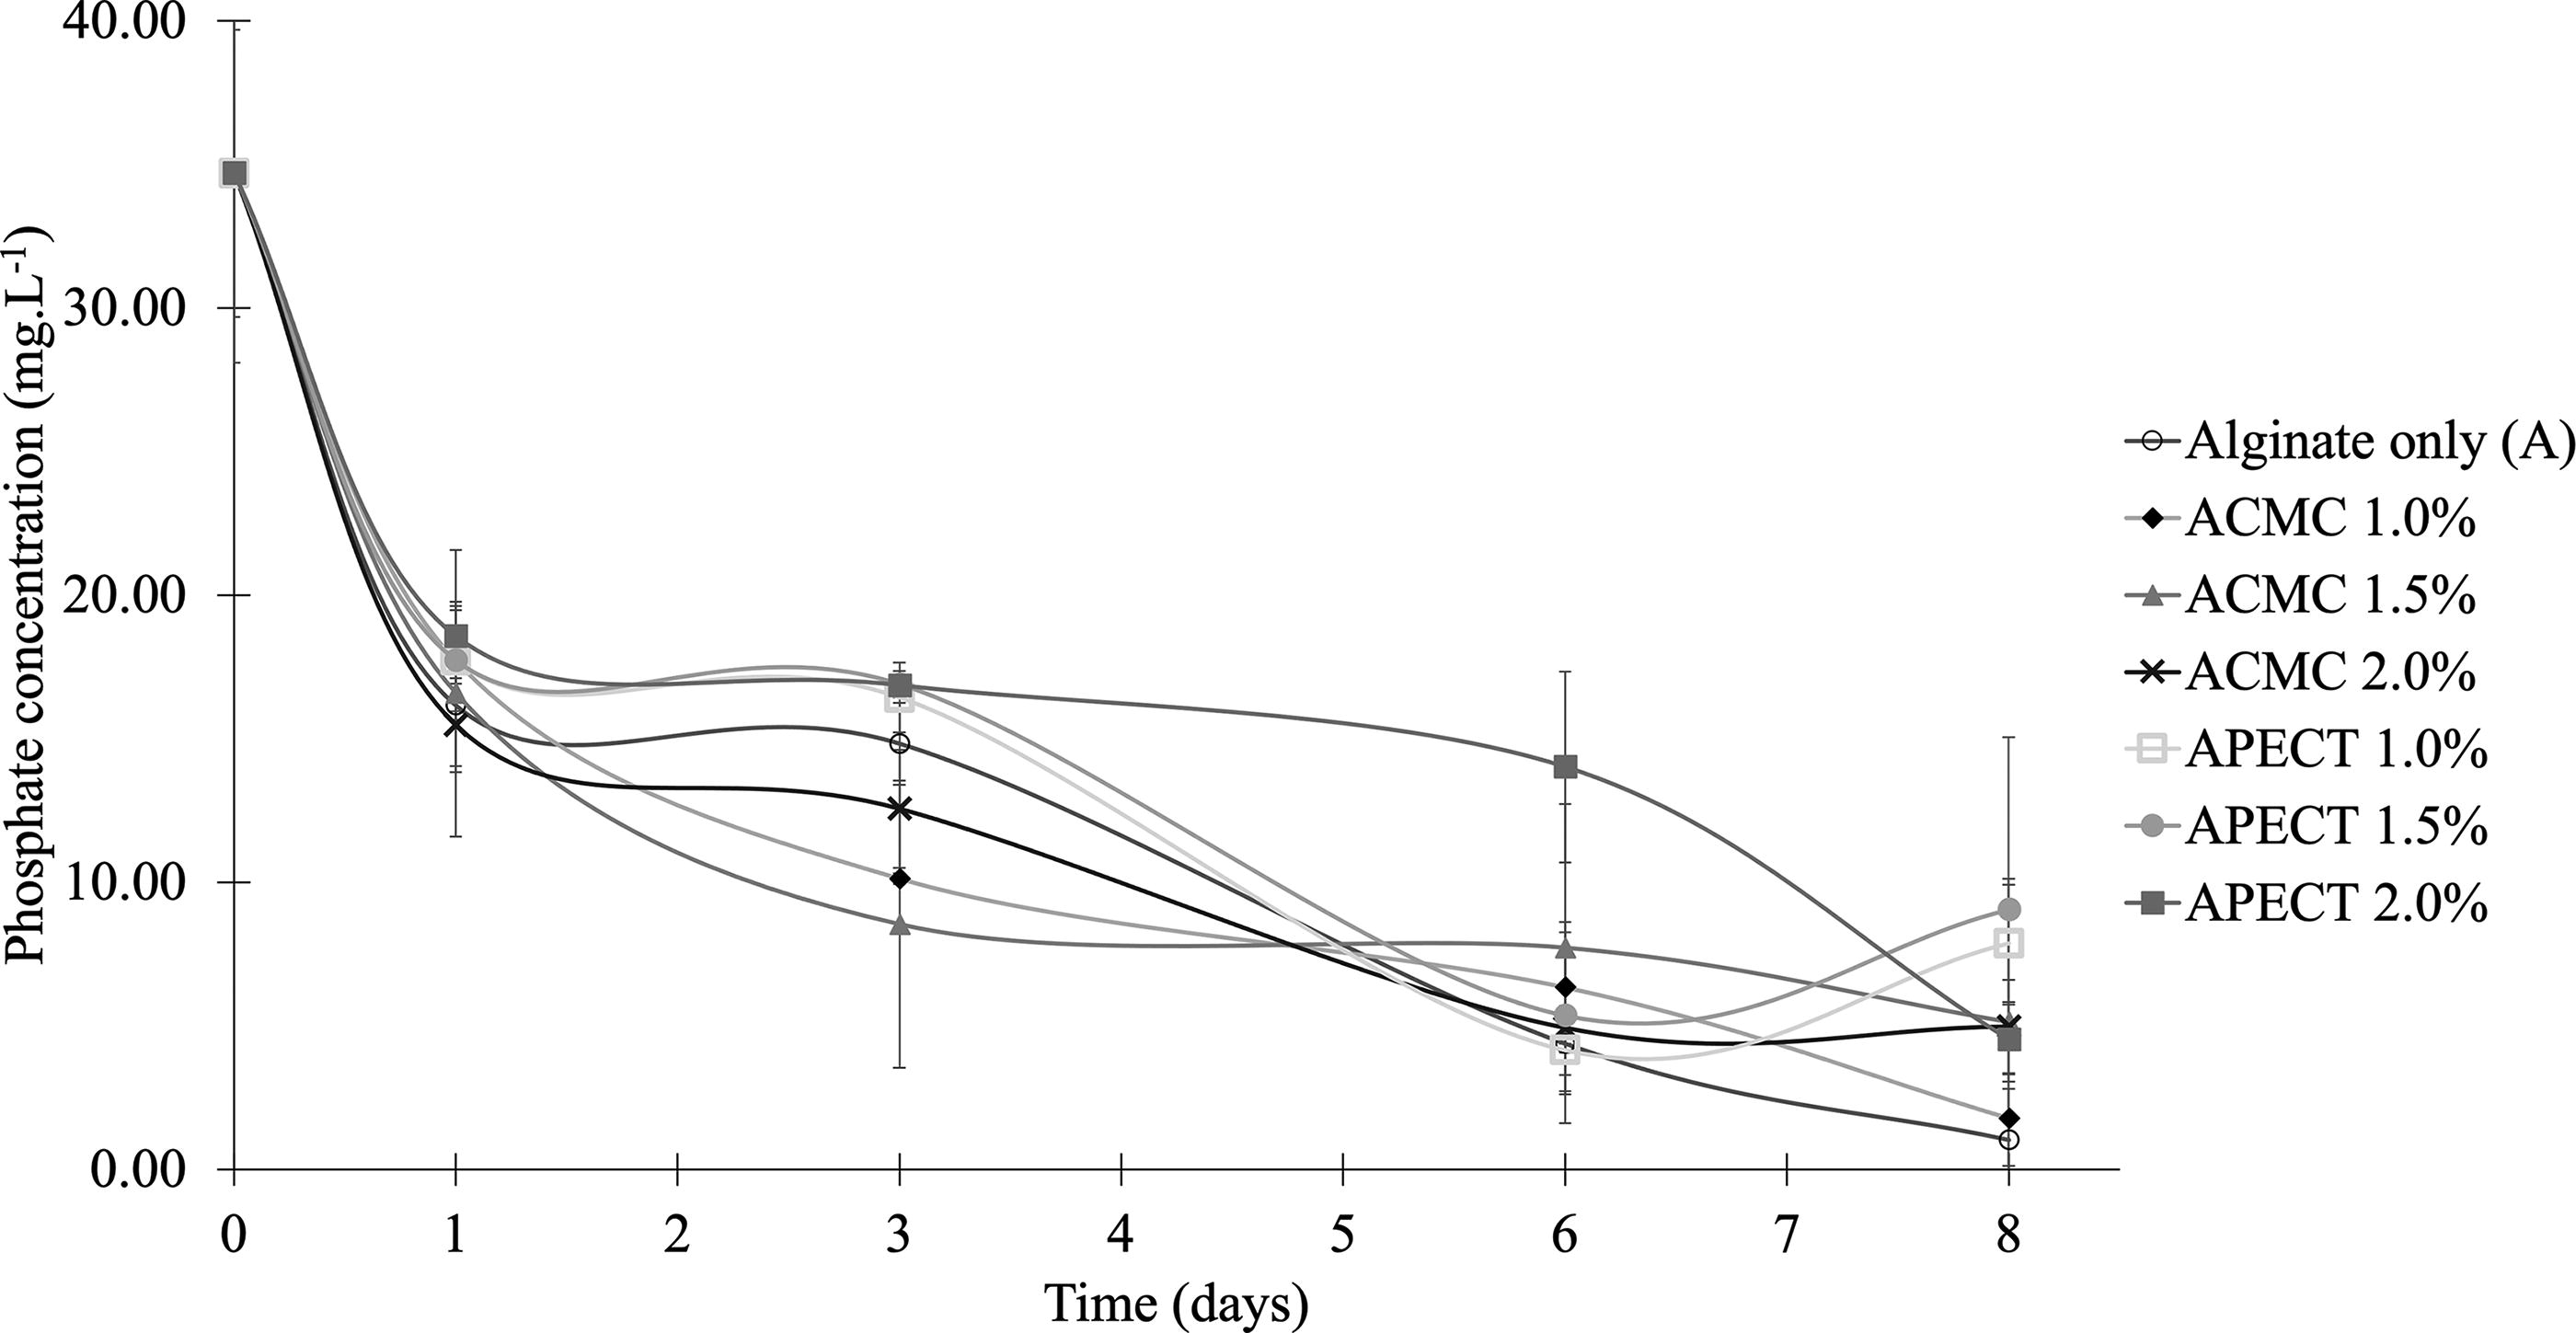
Phosphate concentration by alginate-only and blends beads in mg.L-1 for 8 days.
Nitrate Removal (%) and Removal Rate (mg.L-1.d-1) by Alginate-Only and Blend Beads on Day 8
Results are presented by mean ± SD, n = 3. Means followed by the same letter in a column did not differ significantly, Tukey test, p < 0.01.
Results are presented by mean ± SD, n=3. Means followed by the same letter in a column did not differ significantly, Tukey test, p<0.01.
Nitrate concentration had almost complete uptake by the microalgae in all blends and alginate-only at the end of the experiment, where the blends compared to alginate-only did not show a significant difference (p > 0.01). In contrast, on day 3, the ACMC blends results show significant differences compared to alginate-only and APECT blends (p < 0.01), where the highest nitrate removal of ACMC blends achieved 97.01% for ACMC 1.0%, 97.46% for ACMC 1.5%, and 99% for ACMC 2.0%. In addition, APECT blends and alginate-only removed at around 60% and 70%, remaining at around 25 mg.L−1 and 20 mg.L−1, respectively. APECT 2.0% removed less than other blends and alginate-only, 59.08% on day 3 and 95.03% on day 8. Even though it presented satisfactory removal, the different concentrations of additives did not affect the nitrate concentration results. All blends and alginate-only removal rates were similar, around 8 mg.L−1.d−1. It suggests the blends and alginate-only can efficiently remove nitrate.
Results are presented by mean ±SD, n = 3. Means followed by the same letter in a column did not differ significantly, Tukey test, p < 0.01.
About the removal of phosphate concentration, the types of blends have not influenced the results (p > 0.01). On the first day, phosphate concentration decreased by 50% for all alginate-only blends. Similarly, as for nitrate removal, microalgae in ACMC blends had more phosphate uptake than alginate-only (A) and APECT blends on day 3. In addition, the lowest removal for APECT 2% was 59.08%, and the remaining phosphate concentration was 16.86 mg.L−1. In contrast, for ACMC 1.5%, the phosphate concentration was 8.54, resulting in 77.11% removal for the same day. C. vulgaris in alginate-only (A) and APECT blends removed less than in ACMC blends. The lower concentration of nitrate was 14.82 mg.L−1 for alginate-only, 16.90 mg.L−1 for APECT 1.5%, and 8.54 mg.L−1 for ACMC 1.5% removing 55.48%, 50.06%, and 77.11%, respectively. On the other hand, in the following days, the microalgae in alginate-only (A) removed more of this nutrient compared to other blends, 96.20%, which was the maximum uptake. At the end of the experiment, C. vulgaris in APECT 1 and 1.5% showed less removal, around 75%, in contrast with other blends and alginate-only, around 85% and 96%.
The removal rate of phosphate started similarly for APECT experiments and alginate-only (A), except for ACMC, which is at least 2× higher than alginate-only (Table 3). Researchers have investigated the nitrate and phosphate removal rate by C. vulgaris immobilized in alginate varied between 0.86–9.5 mgN.L−1 and 0.41–0.66 mgP.L−1, respectively (Lau et al., 1997). The removal rates by the same species immobilized with different bead diameters were 0.34–0.74 mg.L−1 for total nitrogen and 1.66–6.25 mg.L−1 for total phosphorus (Lee et al., 2020). The difference in phosphate removal between alginate-only beads and the addition of CMC or pectin in beads could be due to the presence of calcium in the matrix (Yan and Yu, 1997). The availability of phosphorus in the culture or in the environment in which the microalgae are applied is an essential factor that also influences their growth. It relates to microalgae metabolism, nitrate transportation, and protein synthesis (nitrogen required) that may limit adenylate and ATPase activities. Concluding phosphorus availability is essential for nitrate uptake by microalgae (Daneshvar et al., 2018).
Furthermore, the findings of nutrient removal are associated with microalgae active inside beads, in addition to the capability of additive changes in the surface area and pore size. The adsorption of sodium alginate and CMC in different concentrations was investigated. The result showed that for the blend with CMC, the surface area and pore size increased 2× compared to alginate beads (Ren et al., 2016). It was observed that the matrix diffusion resistance increased when pectin was added to immobilize enzymes (Jawaheer et al., 2002). For further studies, it is necessary to investigate the diffusivity and measure pore size and surface area to understand the mechanism of adsorption of nutrients in the blend of biopolymers.
Conclusion
The addition of biopolymers of CMC or pectin in the alginate solution has the purpose of increasing the properties of beads formed and evaluating a stable environment for the microalgae to uptake nutrients. The results showed that the addition of biopolymers removed nitrate and phosphate similarly to the alginate-only beads (A). The blends influenced the initial concentration of immobilized microalgae and the size and shape of beads. On the other hand, the cells were still capable of growing inside. At the end of the experiment, the APECT 1.5% presented the highest concentration of microalgae, overcoming the alginate-only beads (A). However, APECT 2% showed a limitation of cell growth. The instability of the beads was measured by the swelling and shrinkage degrees. The blends containing APECT 1.0% showed similar results to alginate-only. For the removal of nutrients, C. vulgaris in the ACMC blends removed faster than alginate-only and APECT blends, achieving 99% (ACMC 2.0%) for nitrate and 77.11% (ACMC 1.5%) for phosphate in only 3 days.
Footnotes
Acknowledgments
This work was supported by the Algae & Organic Matter Laboratory (AOM Lab) at the School of Chemical Engineering, UNSW, which provided the facilities, equipment, and resources. We extend our sincere thanks to Dr. Richard Stuetz for his support, and Dr. Rita Henderson, Dr. Bojan Tamburic, and Dr. Narasinga Rao for their supervision and guidance.
Authors’ Contributions
B.S.C.B.: Conceptualization, Methodology, Software, Writing—Original draft. N.R.H.R.: Formal analysis, Writing—Review and editing. B.T.: Methodology, Writing—Review, Supervision. R.S.: Resources. R.K.H.: Resources, Validation, Supervision. M.G.: Validation, Supervision, Writing—Review and editing, Project administration.
Availability of Data and Materials
All data generated or analyzed during this study are included in this article.
Author Disclosure Statement
There is no competing interests.
Funding Information
This work was supported by CAPES (Coordenação de Aperfeiçoamento de Pessoal de Nível Superior-Coordination for the Improvement of Higher Education Personnel) - Finance Code 001 and Financier of Studies and Projects (FINEP) in the Project MIDAS-INCT approved MCTI/cnpq/CAPES/faps n 16/2014.