
Abstract
This study is the first comprehensive investigation into the extent of microplastic pollution in Frenchman Bay, ME, which is a semi-sheltered coastal bay with some freshwater input making it an ideal location to study the land–sea connection of microplastic pollution. Two sampling campaigns were coordinated for this study, and during the first one, 323 fibers were identified from water samples collected on a weekly basis from the Bay from July through October of 2022. The chemical compositions of a subset of these samples were determined by micro-Raman analysis, identifying the types of microplastic fibers (MPFs) in the Bay. In total, an average of 1.8 fibers/L were found among all sampling locations, from which it was estimated that up to 400 billion MPFs may reside in the upper one meter of Frenchman Bay. A complementary sampling campaign was organized to investigate potential land-based sources of MPF pollution. Grab samples were collected during six sampling events at a variety of rural and urban locations surrounding the Bay. The highest microplastic concentration was from a culvert during a storm, releasing an average of 15.3 fibers/L directly into Frenchman Bay. It is suspected that the MPFs enter Frenchman Bay from regional land-based sources, as the size of the microplastics decreases as the sampling location becomes farther from land, and it appears the color fades in relation to distance from land. This study is the first systematic microplastic sampling campaign of the Bay and can set an example for similar studies in estuary systems that are investigating the land–sea connection.
Introduction
Plastic production has been increasing since the start of commercial manufacturing in the 1950s, resulting in an estimated 4.8–12.7 metric megatons of plastic entering the oceans annually (Barrows et al., 2017; Jambeck et al., 2015). Discarded plastics are broken down in the aquatic environment by a variety of physicochemical and biological processes and form secondary microplastics, which are practically defined as synthetic polymers that are <5 mm (Thompson et al., 2004). Primary microplastics, on the other hand, are manufactured at the size of a microplastic and contribute to microplastic pollution (Andrady, 2011; Barrows et al., 2018; Browne et al., 2011). Regardless of their genesis, microplastics are found ubiquitously in natural and built environments and are detected in various compositions, weathering stages, and shapes (e.g., fragments, pellets, granules, fibers). Microplastic fibers (MPFs), one of the most abundant types of microplastics in marine environments (Barrows and Neumann, 2022; Salvador Cesa et al., 2017), have unique toxicological pathways owing to their high aspect ratios (Cole, 2016) and they pose a great risk to marine species and humans.
Rivers are one of the major pathways for microplastics to enter the marine environment (Malli et al., 2022; Schmidt et al., 2017). On average, rivers are estimated to carry 0.8–2.7 metric megatons of plastic waste globally into the ocean every year (Meijer et al., 2021), which is approximately 30% of the total plastic influx into the ocean. When plastic waste ends up in rivers, it is transported to the ocean through estuaries as they are the transition zones (Dris et al., 2020). Estuaries are crucial for marine life and are used by commercial fisheries as well as by many fish species as natural nurseries owing to their sheltered location and food availability (Barletta et al., 2019; Malli et al., 2022; Rodrigues et al., 2019). Estuaries in the United States provide habitat for over 75% of commercial fish catch (NOAA, 2021), making them vital to the US economy. Estuaries are also popular destinations for tourism, residential properties (Willis et al., 2017), and ports (Preston-Whyte et al., 2021), which plausibly intensify the microplastic influx.
Over the past two decades, research efforts have uncovered various pathways through which microplastics infiltrate aquatic ecosystems. These pathways include: (1) wastewater treatment effluents, which carry fibers shed from laundry washing (Magnusson and Norén, 2014; Murphy et al., 2016; Zalasiewicz et al., 2016; Salvador Cesa et al., 2017b), (2) surface runoff, transporting a mixture of litter and tire wear particles from urban areas (Prata, 2018; Kole et al., 2017), plastic mulch from agricultural fields (Zhang and Liu, 2018), microplastics accumulating in biosolids applied to lands (Huang et al., 2023), and residues from landfills (Dris et al., 2016), and (3) atmospheric deposition where microplastics in storage locations (e.g., landfills, construction sites) are carried by wind and settle into water bodies (Allen et al., 2019; Dris et al., 2016; Waldschläger et al., 2020). In addition, specific to the study area, anthropogenic activities along coasts have been identified as potential contributors to microplastic pollution in marine environments through harbors, recreational activities, shipping, as well as fishing (Driedger et al., 2015; Karbalaei et al., 2018). In Frenchman Bay, the only relevant microplastic pollution study was conducted by Lee et al. (2018) investigating cruise ships as sources, however they were not able to conclude that pathway.
Despite the economic impact of estuaries and their potential vulnerability to microplastic pollution, the extent of their microplastic pollution remains unexplored in certain locations. This is the first study that comprehensively reports the abundance of MPFs in Frenchman Bay, ME. Frenchman Bay is a semi-sheltered coastal bay with complex geomorphology and with some freshwater input owing to streams, making it an ideal location to study the land–sea connection of microplastic pollution. Several studies have been conducted in US estuaries to determine the abundance of microplastics in sediments and in water (Lee et al., 2018; Cheng et al., 2021; Sutton et al., 2016; Yonkos et al., 2014; Gray et al., 2018). An average microplastic count of 116 ± 21 g−1 of sediment was reported in the Great Bay Estuary, NH (Cheng et al., 2021), which is located on the same coast as Frenchman Bay. It was observed that the highest accumulation occurs in regions with weaker hydrodynamic flows and lower bed shear stress. In the surface waters of San Francisco Bay, CA, an average concentration of 700,000 particles/km2 was found, surpassing levels in other urban waterbodies in North America. The study highlighted the substantial contribution of treated wastewater discharges from eight facilities, which collectively introduced 0.086 particles/L into San Francisco Bay (Sutton et al., 2016). Microplastic pollution in the Chesapeake Bay, across watersheds with varying land uses were reported at concentrations from <1.0 to >560 g/km2, with significant correlations to population density and urban intensity within watersheds (Yonkos et al., 2014). Lastly, an average of 6.6 ± 1.3 particles/L in Charleston Harbor, SC was reported with an abundance of black microplastics likely sourced from tire rubber wear (Gray et al., 2018). Consequently, despite microplastics becoming a focus of studies in US estuaries, no extensive study has been conducted in Frenchman Bay until now. This study was created with the overarching goal of initiating a dialogue about microplastic pollution in estuaries with a particular focus on Frenchman Bay, in addition to providing a pioneering example for future studies in similar systems. Two research questions were addressed to achieve this overarching goal: (1) What are the extent and characteristics of MPF pollution in Frenchman Bay? (2) Do the MPFs in the Bay primarily originate from regional land-based sources?
Materials and Methods
Description of the study area
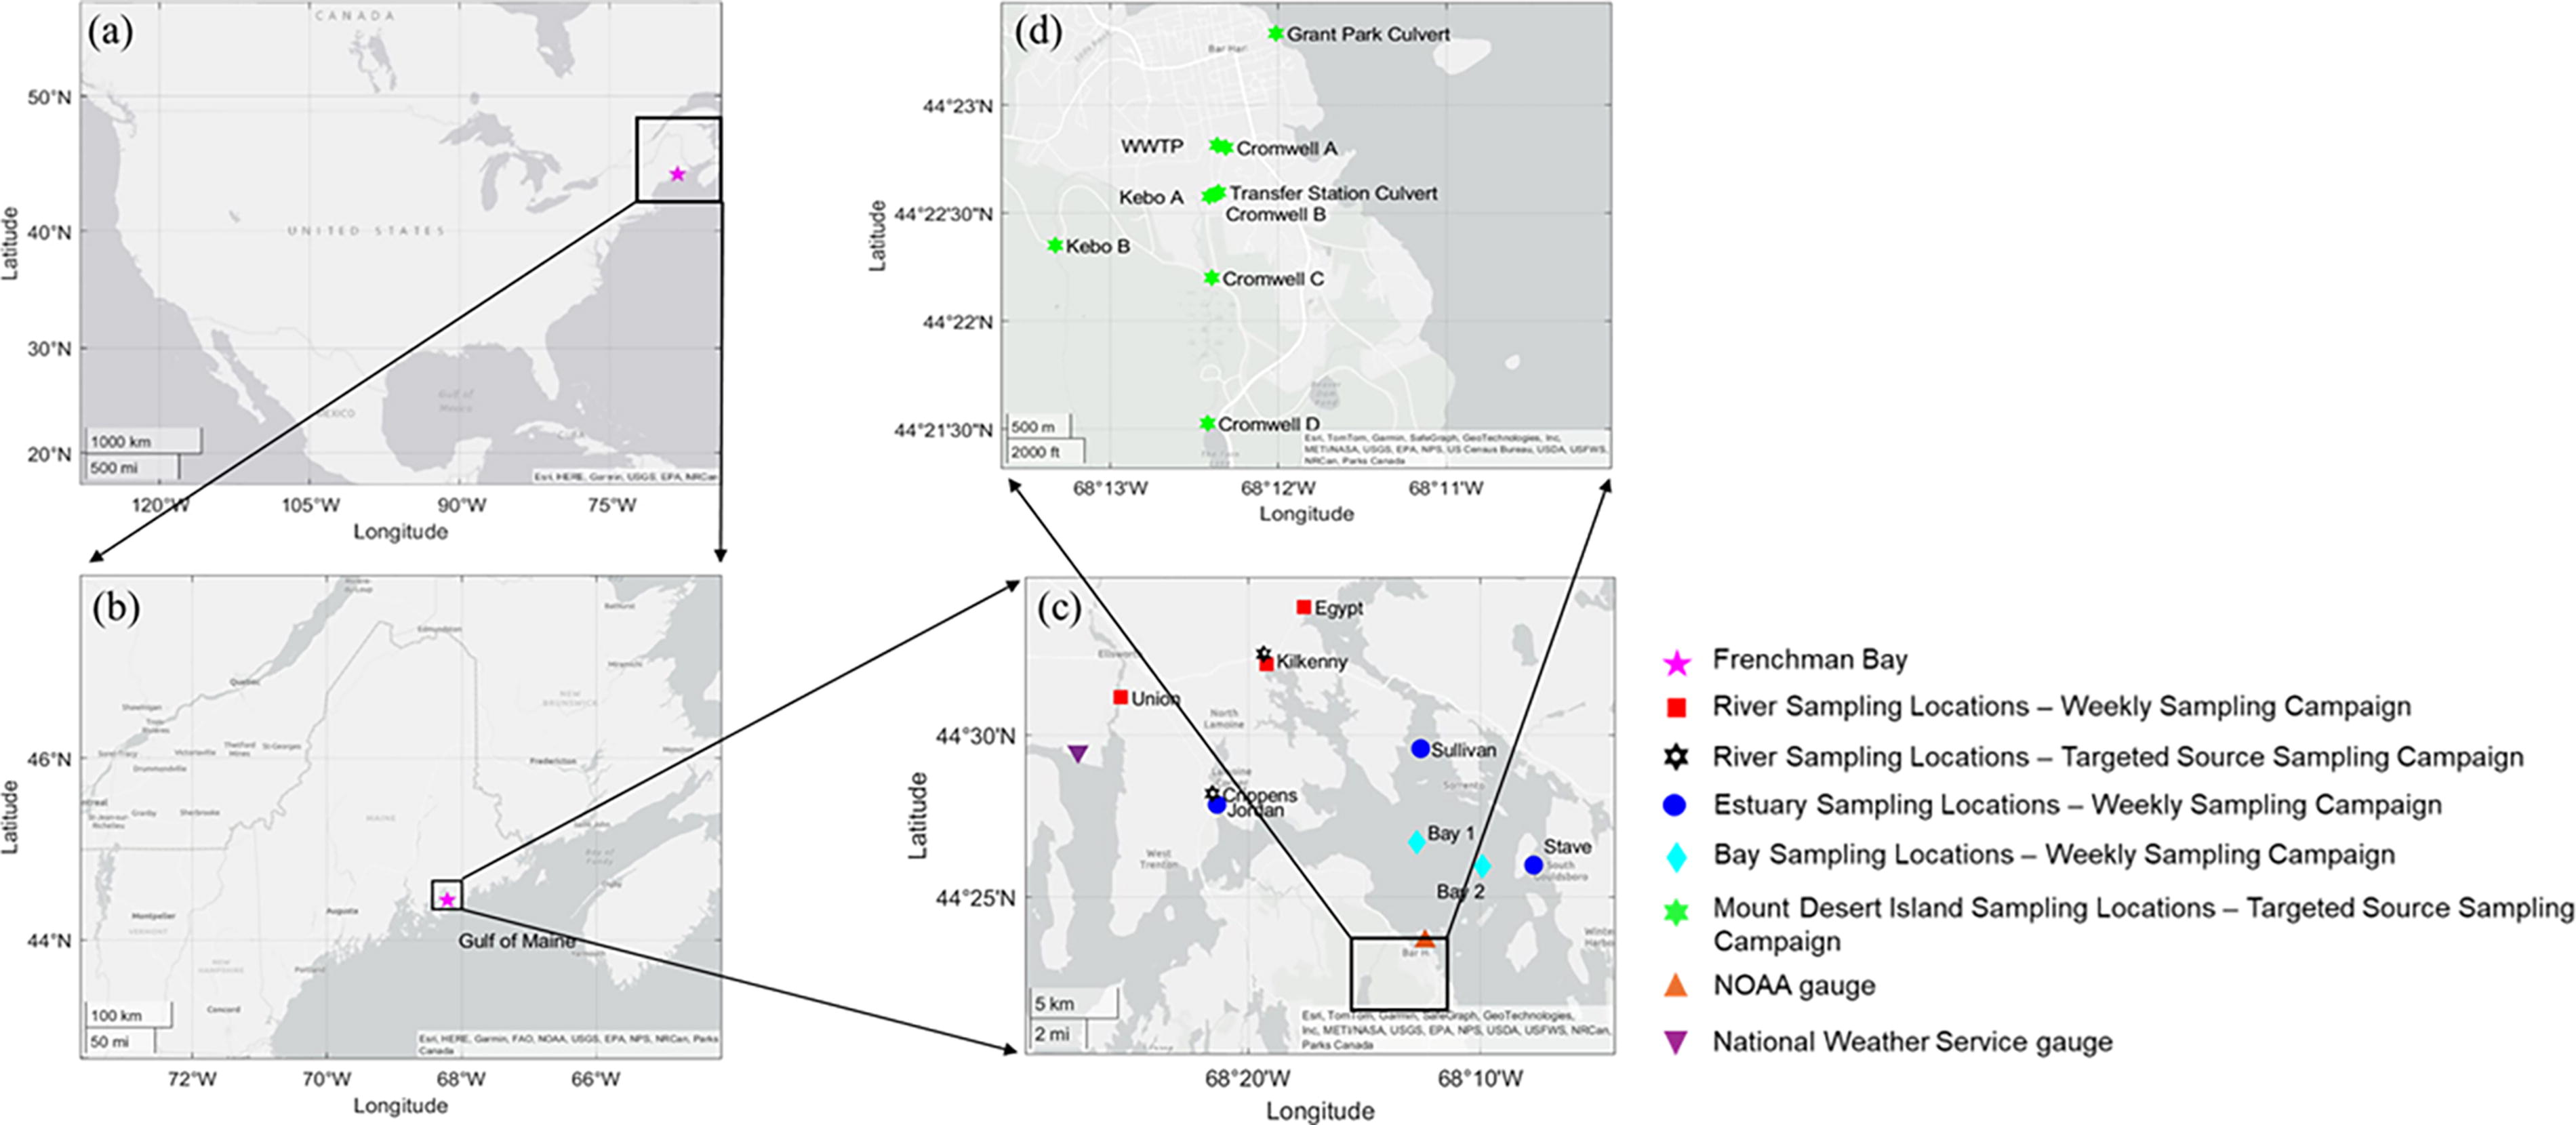
The study area is approximately 226 km2 surrounding Frenchman Bay, ME, adjacent to Mount Desert Island, a popular tourist destination and home to Acadia National Park. The map and coordinates of the study area can be found in Figure 1a and b. Frenchman Bay is a coastal location with connected estuaries where pollution problems have been observed and is explained in more detail in Alahmed et al. (2022). General conditions during the sampling season including wind speed, precipitation, and water level of the area, are shown in Supplementary Figure S1, and freshwater streamflow into the Bay is shown in Supplementary Figures S1 and Figure S2 and Supplementary Table S1a–b.
Map of sampling locations.
Weekly sampling campaign
For the first part of the study, a periodic sampling campaign was designed to collect MPF data around Frenchman Bay. Samples were collected weekly for the majority of July through October 2022. Samples were collected from the locations labeled as “Bay 1,” “Bay 2,” “Jordan,” “Stave,” “Sullivan,” “Egypt,” “Kilkenny,” and “Union” in Figure 1c. The sampling locations “Bay 1” and “Bay 2” are in the middle of the Bay, “Jordan,” “Sullivan,” and “Stave” are located in estuaries surrounding the Bay, and “Egypt” and “Kilkenny” are located near the mouths of rivers entering Frenchman Bay. “Union” is located near the mouth of Union River, wich is hydrologically connected to Frenchman Bay through Mount Desert Narrows. Sampling methods and quality control will be elaborated upon in Section 2.6. Triplicate samples were collected at one sampling location each week rotating between the sampling locations for statistical robustness. In total, 129 water samples were taken over 17 weeks.
Targeted source sampling campaign
To supplement the weekly sampling data and to gain insight into the concentrations of MPFs coming from land-based sources that discharge into Frenchman Bay, samples were also collected from various locations around Mount Desert Island, ME (Fig. 1d). Samples were collected during six sampling events between June and August 2023. Two of the sampling events occurred during a storm event (July/10, 2023 and August/4, 2023) and the rest were taken in fair weather. The objective was to collect samples in a variety of urban and rural locations. The two culvert sampling locations could only be sampled during storm events because of insufficient or no flowrate during dry days. Samples were collected from the sampling locations labeled as “Kilkenny,” “Crippens,” “Grant Park Culvert,” “Cromwell
Sample processing and microscopy analysis
Samples were processed in the laboratory by vacuum filtration before MPFs were counted under an Olympus SZ Stereo Microscope. A glass filtration apparatus was used, and 1.5 L of each sample was filtered using Whatman Grade 41, cotton, 47 mm diameter filters with a 20–25 µm pore size. Some samples required several filter papers owing to their high turbidity. Each filter paper was placed in an aluminum weighing dish and completely sealed with aluminum foil for storage. The 129 samples from the weekly sampling campaign were filtered onto 206 filter papers and the 105 samples from the targeted source sampling campaign were filtered onto a total of 282 filter papers.
Next, the filtered samples were analyzed using the stereo microscope at 40
Chemical identification of microplastic fibers
Using Google’s online random number generator, 5% (17 fibers) of the total 323 fibers from the weekly sampling campaign and 5% (9 fibers) of the total 180 fibers from the targeted source sampling campaign were chosen to analyze the chemical identity by Raman microspectroscopy (micro-Raman) (Barrows et al., 2018; Blair et al., 2019). A Renishaw inVia Qontor confocal Raman microscope equipped with a Leica DM2700 optical microscope with brightfield microscopy capabilities was used to analyze the samples on cotton filter papers (Whatman Grade 41, 47 mm diameter). High spatial resolution Raman spectra of the samples were collected at a rate of 30 s/point using a 20× microscope objective and a 532 nm excitation laser. A 1,300 lines/mm grating was used, capturing a spectral window from 680 to 1,844 cm−1. All data acquisition and processing, including baseline subtraction, using an intelligent polynomial, was performed using the Renishaw WiRE software. Raman spectra were cross-referenced to find potential matches using Open Specy, an open-source database (Cowger et al., 2021).
Quality assurance and quality control
It is important to integrate quality control measures in microplastic analysis studies to mitigate miscounting of particles owing to water type used for laboratory blank, particle adhesion to the filtration apparatus, and subjective enumeration methods (Kosuth et al., 2023). To assure control over potential sources of error, this study implemented a range of published QA/QC protocols from sample collection to analytical analysis stages, specifically targeting the minimization of cross-contamination. During field studies, the sampling of the streams was conducted downstream to upstream of the person to avoid contamination from clothing and footwear. Two-liter glass jars with metal lids, rinsed three times with water in the laboratory before field sampling, were used for sample collection to prevent contamination of the samples (Barrows et al., 2018, 2017). In the field, the jars were rinsed again before samples were collected in the sampling locations at least 5 cm below the water surface to minimize contamination and avoid sampling the microlayer, i.e., uppermost 1 mm (Barrows et al., 2018, 2017; Song et al., 2014). The jars were opened and closed below the water surface to avoid potential contamination from air during rinsing and sampling (Barrows et al., 2018, 2017) as atmospheric deposition can be a source of MPFs to aquatic environments (Dris et al., 2017, 2016). The watercraft consisted of blue, white, and gray paint and a sample of the material was chemically analyzed to ensure MPFs did not originate from it. The chemical bonds observed in the spectra (Supplementary Fig. S34) did not resemble the sampled MPFs.
During sample processing, the lab bench was wiped down before experiments to remove potential contamination. Cotton lab coats and nitrile gloves were worn to prevent plastic contamination from clothing. The glass filtration apparatus was covered with aluminum foil when not in use to prevent microplastic deposition from the laboratory environment. The room in which the microscope was located was cleaned before the start of microplastic identification, surfaces were wiped down and the floor was swept to avoid potential contamination. An air purifier was used to prevent air contamination and was turned on at least 30 min before each use of the microscope and remained on until work was completed for the day.
To capture and quantify any possible contamination, laboratory control samples were processed in the same fashion as the actual samples. Specifically, three types of control samples were used: (1) the “Filter Blank,” i.e., 1.5 L of deionized (DI) water with resistivity >18.2 MΩ-cm, which was filtered by vacuum filtration (Barrows et al., 2018); (2) the “Microscope Blank” consisted of an open beaker of 140 mL of DI water left open next to the microscope during the time it took to count the number of SMPFs of one sample (Barrows et al., 2018); (3) the “Air Blank” consisted of a piece of filter paper left open on the lab bench while using vacuum filtration. Results of all laboratory controls are presented in Supplementary Table S2.
Statistical analysis
Statistical analyses were performed using OriginPro, Version 2023 b (OriginLab Corporation, Northampton, MA). The analyses aimed to determine how SMPF concentration varied based on sampling location (Supplementary Tables S21-S23) and season (Supplementary Tables S12-S20). Additional analyses were conducted to examine how the measured lengths of the SMPFs varied by sampling location and proximity to land (Supplementary Tables S3-S11). Eight sampling locations were divided into three groups: River locations (Union, Kilkenny, and Egypt; n = 123), Estuary locations (Jordan, Sullivan, and Stave; n = 68), and Bay locations (Bay 1 and Bay 2; n = 105). Sampling seasons were classified as Summer (n = 56) and Fall (n = 56), covering the periods from early July to mid-August 2022, and early September to late October 2022, respectively. The length and concentration data were nonnormally distributed; thus, a nonparametric two-sample independent test (i.e., Mann–Whitney test) was performed. The exact probability p value was reported to indicate significance at the 95% confidence level regarding the differences between the compared groups.
Results and Discussion
Microplastic fiber counts in Frenchman Bay
The average concentration of SMPFs in the bay-river-estuary system was determined as 1.80 ± 2.23 fibers/L based on the weekly sampling campaign. Examples of MPFs found in Frenchman Bay, confirmed by Raman spectroscopy, and their chemical compositions are shown in Figure 2. Using the average SMPF concentration and the surface area of the Bay, total SMPFs were estimated to be in the order of ∼400 billion in the top one meter of the Frenchman Bay. The computations and assumptions for this estimation are presented in Supplementary Text S1. When comparing the concentrations between the bay locations (i.e., Bay 1 and Bay 2), the river locations (i.e., Egypt, Kilkenny, and Union), and the estuary locations (i.e., Jordan, Stave, and Sullivan), the Bay had the highest average concentrations (2.40 ± 2.54 fibers/L), whereas the rivers had the next highest (2.18 ± 2.57 fibers/L) and the estuaries had the lowest (1.06 ± 1.30 fibers/L) (Fig. 3).

Example images of confirmed microplastic fibers (

The concentration gradient between sampling locations can be attributed to a combination of differences in tidal current flow patterns as well as the water chemistries. Specifically, the low SMPF concentrations in the estuaries compared to the rivers (p < 0.05; Supplementary Tables S12–S14) can be attributed to the greater ionic strength of the estuary (see salt concentrations in Supplementary Fig. S3), which leads to electric double layer compression of particulate matter and causes them to aggregate and settle down upon collision with other particulate matter. However, the high SMPF concentrations in the bay locations cannot be explained by this mechanism because the salinity is highest at those sampling sites. This led us to believe that tidal currents interacting with complex coastline patterns may be causing circulation structures that lead to the entrapment and concentration of microplastics despite the high salinity (Alahmed et al., 2022). Bay 1 and Bay 2, located in the middle of the Bay, are farthest from the effects of rainfall-induced surface runoff and streamflow, which are potential input pathways of MPFs to the region. Higher SMPF counts at Bay 1 and Bay 2 might therefore indicate that MPFs accumulate at the center of the bay owing to circulation patterns. The tidal currents in the estuaries surrounding Frenchman Bay are stronger than at Bay 1 and Bay 2 owing to the relatively narrow and convergent shape of the channels (Alahmed et al., 2021). As the estuaries open up into Frenchman Bay, the currents weaken which could lead to accumulation of MPFs (due to slower “flushing” of surface waters) near Bay 1 and Bay 2. This hypothesis is supported by observations of algal bloom cells by Bailey et al. (2024) (under review), which are suspended in surface waters and were found to accumulate in the middle of the Bay, owing to eddy circulation patterns formed by flow interactions with the Bay’s geomorphology. However, further research is needed to confirm the accumulation of microplastics, and should consider also potential accumulation of MPFs in the sediment of the estuary system and other entrapment mechanisms in the Bay.
The abundance (or lack) of MPFs as a function of tidal currents and aquatic chemistry is important but does not necessarily explain the land-sea connection. The land-sea connection predominantly takes place in rivers through surface runoff, which is a significant source of microplastic pollution, and can even be greater than point sources such as wastewater treatment plants (Cho et al., 2023; Imbulana et al., 2024; Yano et al., 2021). Microplastic concentrations increase in rivers and estuaries after rain events (Gündoğdu et al., 2018; Hitchcock, 2020; Veerasingam et al., 2016); therefore, precipitation and streamflow data were analyzed to determine if hydrographic conditions could explain the high concentration at the mouth of Egypt stream (Fig. 3). Streamflow from a real-time gauge in Kilkenny Stream (WPES, 2023) was used to compare to the fiber abundance measured at the Egypt site. Although the streamflow data in Kilkenny Stream is not the same as the streamflow in Egypt Stream, it is assumed that the peaks in streamflow would be consistent owing to the streams’ proximity. Both areas received similar rainfall (Supplementary Figs. S4–S5) and both locations have similar estimated monthly streamflow (Supplementary Table S1a). In Supplementary Figure S6a,b, there is a peak in streamflow at the beginning of July that corresponds with a high SMPF concentration, whereas there is another streamflow peak at the end of July that does not result in a high SMPF concentration. This caused the “Summer” to have significantly higher SMPF concentration than the “Fall” (p < 0.05; Supplementary Tables S21–S23). The number of tourists increased in July, as Acadia National Park reports recreational visits of 603,023 in June and 791,358 in July of 2022, with July being the highest number of visits all year (NPS, 2022). It is possible that the peak in SMPF concentration at the beginning of July is owing to the increasing touristic activity around the 4th of July, but this should be verified in future studies. In line with the results of this study, multiple research efforts have highlighted the role of intensive human activities, including tourism and global pandemics, in exacerbating microplastic pollution in marine ecosystems. Similar studies have noted a significant rise in microplastic levels after peak tourism seasons (Gul et al., 2023; Wu et al., 2021; Franco et al., 2023; Retama et al., 2016), as well as a correlation between higher microplastic concentrations and recreational activities such as fishing and coastal tourism (Dowarah and Devipriya, 2019). Furthermore, several studies have shed light on how the COVID-19 pandemic and associated lockdown measures disrupted waste management and recycling practices globally, presenting a unique extraordinary example of how human activities can impact the environment. This disruption resulted in the improper disposal of plastic personal protective equipment (e.g., single-use gloves, face masks, face shields, and suits), contributing to pollution in coastal areas, beaches, inland waters, terrestrial environments, and urban areas (De-la-Torre et al., 2022; Han et al., 2024; Li et al., 2022; Rakib et al., 2021; Reethu et al., 2023). The findings underscore the multifaceted nature of human impact on microplastic pollution across diverse ecosystems.
Analysis of microplastic fiber length regarding distance from land
To further our understanding of MPF pollution, SMPF length variations were analyzed with respect to distance from land. The distribution of the lengths at each sampling location is shown in Figure 4. It should be noted that one fiber in this analysis was 6 mm, so by definition is not a “microplastic,” but it is assumed to behave similarly, and therefore was not removed from the dataset. Bay 1 and Bay 2 had more SMPFs in the smallest bin (<0.5 mm), suggesting that fibers are generally shorter in the middle of the Bay compared to the estuaries and streams closer to shore. For statistical verification, locations were grouped and analyzed based off their proximity to the middle of the Bay. The river locations are farthest from the center of the Bay, the estuaries are between the rivers and center of the Bay, and the locations Bay 1 and Bay 2 are located centrally in the Bay. First, the samples from Union, Kilkenny, and Egypt (River locations) were paired together and compared with Jordan, Sullivan, and Stave (Estuary locations). On average, River locations contained only slightly longer fibers than the Estuary locations (p = 0.057, Supplementary Tables S3–S5). Next, the River locations were paired against Bay 1 and Bay 2 (Bay locations), and it was observed that the rivers have significantly larger fibers than the locations in the middle of the Bay (p < 0.05, Supplementary Tables S6-S8). The third comparison considered the Estuary locations compared to Bay 1 and Bay 2. The results indicated that estuaries have only 7% longer fibers than the samples in the middle of the bay (Supplementary Tables S9–S11). From this analysis, it appears that the length of the SMPFs decreases with distance from the coastline toward the middle of Frenchman Bay. This was attributed to the SMPFs breaking down owing to exposure to physicochemical weathering processes (Rocha-Santos et al., 2022). This result could also indicate that the fibers in the middle of the Bay have been in the marine environment for a longer amount of time than the fibers in the rivers, supporting the finding that SMPFs are accumulating in the Bay.

Distribution of suspected microplastic fiber lengths at each of the river, estuary, and bay sampling locations.
Physical and chemical properties of microplastic fibers
The color of each SMPF, as well as the color distribution at each sampling location around the Bay, is shown in Figure 5. The most prominent color was blue (144 fibers) followed by black (94 fibers), purple (50 fibers), clear (17 fibers), red (13 fibers), green (4 fibers), and orange (1 fiber). The predominance of blue fibers is consistent with the findings of Barrows et al. (2018). There is a higher amount of “clear” or white fibers identified from the bay and estuary locations (14 fibers) than the rivers (3 fibers), most prominently in Sullivan, Bay 1, Bay 2, and Stave Island. Martí et al. (2020) found that the white color of microplastics increased in smaller pieces and with distance from coastal land-based sources. Further, the color of microplastics fades during extended solar exposure (Zhao et al., 2022). The higher instances of a “clear” or white fiber in the middle of the Bay suggest these fibers have been exposed to weathering by the sun for a longer period of time, and therefore, support the previous speculation that fibers in the middle of the Bay have been in the aquatic environment longer than the fibers in the rivers. However, the sources of clear fibers are not necessarily limited to UV-exposed fibers; they can also originate from fishing line, gear, or textile laundry wastewater, as observed in earlier studies (Han et al., 2020; Minor et al., 2020; Rasta et al., 2020). To begin understanding potential sources, the targeted source sampling campaign was conducted.

Color distribution of suspected microplastic fibers found at each of the river, bay, and estuary locations. The background map is obtained from Google Maps.
In addition to color, the chemical compositions of the fibers were analyzed via micro-Raman (Supplementary Figs. S7–S32). The 17 fibers from the weekly sampling campaign were identified as polyacrylamide (4 MPFs), polyurethane (2 MPFs), polypropylene (1 MPF), polyester (1 MPF), polyethylene vinyl acetate (1 MPF), cellulose (2 non-MPFs), and cotton (5 non-MPFs). For the targeted sampling campaign, nine fibers analyzed by micro-Raman were identified as polyacrylamide (4 MPFs), polyurethane (2 MPFs), polypropylene (1 MPF), cellulose (1 non-MPF), and cotton (1 non-MPF). Polyacrylamide was identified as the most prominent polymer type. This is possibly due to its widespread use in various textile, paper, wastewater treatment, agriculture, and mining applications. In textile industries, polyacrylamide is used as a thickening agent, a binder to enhance fabric durability and color yield, and to enhance wrinkle resistance, and it is used as a flocculant in wastewater treatment processes (Pikuda et al., 2022; Santini et al., 2022; Zhao et al., 2024). These diverse applications contribute to its prevalence in marine systems. The match quality (MQ) of all Raman spectra ranged from 0.4 to 0.88, with an average of 0.7. The lower MQ is to be expected with microfibers found in the environment that have additives (e.g., dyes), have undergone degradation (e.g., photooxidation), or are composed of blended polymers (Araujo et al., 2018). These results align well with Blair et al. (2019), who found that 63% of their fibers were confirmed plastic by infrared spectroscopy. The chemical composition was analyzed to determine the accuracy of visual identification of MPFs; more samples and further studies are needed to determine possible source materials leading to MPF pollution in Frenchman Bay. To begin understanding potential sources, the targeted source sampling campaign was conducted.
Microplastic fiber abundance on Mount Desert Island
The targeted source sampling campaign was conducted to determine potential land-based sources of MPFs to further speculate the land–sea connection of microplastic pollution. Through this campaign, several point sources of MPFs were located on Mount Desert Island, which borders Frenchman Bay. Precipitation events and increases in population density of an area are expected to enhance microplastic abundance. For example, storm water drains are known to act as substantial sources of microplastic pollution (Preston-Whyte et al., 2021). The effluent from wastewater treatment plants is also known to be a primary source of microplastics, specifically fibers, as they are shed from clothing during washing (Barrows et al., 2018; Browne et al., 2011; Hoellein et al., 2017). To understand how terrestrial anthropogenic activities might impact microplastic abundance in rivers, the sample sites were classified as “urban” and “rural” based on the predominant land usage. Locations “Kebo A-B” and “Cromwell A-D” were classified as rural, and “Grant Park Culvert,” “WWTP,” and “Transfer Station Culvert” were classified as urban. As shown in Figure 6a, the highest source of SMPF concentration found was from the “Grant Park Culvert,” which is a culvert that releases stormwater directly into Frenchman Bay from downtown Bar Harbor, with an average concentration of 15.33 fibers/L. Only one sample was collected from this location owing to the lack of storm events, so this average concentration is only based on one sample of triplicates, whereas the rest were based on at least two samples. Following this, the next highest concentrations were from “WWTP” with 3.56 ± 0.63 fibers/L and “Transfer Station Culvert” with 1.89 ± 1.41 fibers/L (Fig. 6a), which were samples from the effluent of a wastewater treatment plant and a culvert releasing stormwater from a transfer station into Cromwell Brook, respectively. Only 3% of the total samples (n = 180) had clear or white color identification (where 53% of fibers were blue and 29% were black), which indicates that they are less aged as they were collected from the point sources. Also, these three sampling locations were classified as “urban,” whereas the rest of the sampling locations (Fig. 6b) were classified as “rural.” The three urban locations have higher SMPF concentrations than both of the rural sampling locations, as well as the average number of fibers (i.e., 1.80 fibers/L) in Frenchman Bay, indicating urban areas could be potential sources of MPFs to Frenchman Bay. Complete SMPF counts during the targeted sampling campaign can be found in Supplementary Figure S33.

Concentration of suspected microplastic fibers/L at each sampling location during the targeted source sampling campaign, averaged over all sampling dates. Concentration is indicated by both size (larger circles indicate higher concentrations) and color.
Conclusions, Limitations, and Future Research
This study is the first extensive MPF study in Frenchman Bay, ME. The concentration, sizes, compositions, and colors of MPFs were analyzed in eight locations around Frenchman Bay. These findings suggest that MPFs enter the rivers from land-based sources and are transported through the estuaries into the Bay. There, the weaker currents allow them to stay for longer periods of time than in the estuaries. Samples were collected on Mount Desert Island to better understand the land-based sources of MPF pollution and investigate the MPF concentrations in rivers. It was found that the concentrations of the urban sampling locations were higher than the rural sampling locations. It was estimated that around 400 billion SMPFs are present in the top 1 meter of Frenchman Bay. Frenchman Bay is important both for marine life and economy owing to its location and rich ecosystem. Knowing there is MPF contamination in the Bay, it is important for future studies to continue to investigate the primary sources of MPFs in the Bay, so that mitigation techniques can be developed to decrease the MPFs entering the Bay and causing potential harm to both marine life and humans.
Although the present study provides valuable insights into microplastic pollution in Frenchman Bay, it is important to acknowledge limitations that offer opportunities for further research and enhancement. First, the study primarily focused on water samples collected just below the surface. Future investigations could benefit from including sediment samples alongside water samples to assess the interaction and accumulation of MPFs within the water column and sediment interface (Fok & Cheung, 2015; Jiwarungrueangkul et al., 2021). Incorporating depth-stratified sampling in future studies would provide insights into the spatial distribution of MPFs and aid in estimating their overall abundance in the Bay (Vega-Moreno et al., 2021). Moreover, building upon our results indicating the accumulation of MPFs in eddies at the center of the Bay (Bailey et al., 2024), future studies should delve deeper into the relationship between MPFs and tidal waves and how tides transport MPFs within the Bay as these processes have been shown to be relevant in other coastal systems (Malli et al., 2022; Oo et al., 2021). Second, MPFs collected from the marine environment have likely experienced diverse conditions, including UV-induced photodegradation, thermal degradation, and biodegradation, which alter their original polymer composition and hinder chemical analysis (Ivleva, 2021; Phan et al., 2022). Moreover, microbial colonization on MPF surfaces can cause biofilm formation, interfering with spectral analysis and thereby requiring oxidative pretreatment (Lee et al., 2023). These alterations resulted in low spectral quality from Raman spectroscopy, leading to relatively poor matching with reference library information containing spectra for pristine polymers. This challenge has been widely recognized in microplastics research (Lenz et al., 2015; Song et al., 2015; Song et al., 2021). Lastly, due to the difficulty of using tweezers to pick up fibers from the filter, chemical analysis was performed on only 5% of the suspected fibers. Although this method is established (Barrows et al., 2018; Blair et al., 2019), future studies should focus on developing techniques that allow for particle analysis directly on the filter paper. To improve polymer identification accuracy, future studies can incorporate high-recovery rate sample pretreatment procedures and include spectra of weathered polymers in reference libraries, thereby enhancing recognition reliability in environmental samples.
Given the MPF contamination in the Bay, it is important to identify potential mitigation strategies, especially considering the importance of estuaries for the natural ecosystem. In addition, MPFs can enter the trophic food chain and can pose cascading health impacts for humans (Blackburn and Green, 2022; Santonicola et al., 2023; Watts et al., 2015). We recognize that the pollution investigated in this study may have multiple sources in addition to those that we specifically examined. However, in general, the best initial approach to preventing microplastics from entering the marine environment is through source mitigation techniques such as: (1) cutting down on plastic use and especially minimizing its avoidable use; (2) implementing regulations on the use and discharge of primary microplastics; (3) improving the production efficiency through life cycle assessments; (4) commencing educational initiatives for public; and (5) promoting better waste disposal practices e.g., reduce, recycle, and reuse practices. However, for MPFs that have already made their way into the environment, and considering current treatment technologies may be insufficient to remove them before they reach to people, other ingenuitive strategies are needed. Thus, additional work should investigate treatment strategies to eliminate or minimize microplastic exposure.
Footnotes
Acknowledgments
The authors thank Neil Fisher, Samantha Ismail, Cade King, David Libby, Jessica Liggiero, Jean MacRae, Sam Robinson, and Nick Tiner for sampling and laboratory assistance.
Authors’ Contributions
G.J.: Methodology, Investigation, Data curation, Visualization, Writing—Original draft preparation. T.B.: Investigation, Data curation, Writing—Original draft preparation. D.H.: Investigation, Formal analysis, Writing—Original draft preparation. O.N.: Investigation, Writing—Original draft preparation. J.P.: Validation, Writing—Review & Editing. K.D.: Resources, Investigation, Writing—Review & Editing. B.V.D.: Validation, Writing—Review & Editing. S.M.C. Smith: Methodology, Investigation, Conceptualization, Funding acquisition, Writing—Review & Editing. L.R.: Conceptualization, Funding acquisition, Writing—Review & Editing. O.A.: Supervision, Conceptualization, Methodology, Funding acquisition, Writing—Review & Editing.
Author Disclosure Statement
The authors certify there are no competing interests.
Funding Information
Onur Apul would like to acknowledge that this material is based upon work supported by the
References
Supplementary Material
Please find the following supplemental material available below.
For Open Access articles published under a Creative Commons License, all supplemental material carries the same license as the article it is associated with.
For non-Open Access articles published, all supplemental material carries a non-exclusive license, and permission requests for re-use of supplemental material or any part of supplemental material shall be sent directly to the copyright owner as specified in the copyright notice associated with the article.