
Abstract
The levels of particulate matter (PM10) in Karachi, Pakistan, are hazards to public health and environmental degradation. In this study, two statistical techniques, land use regression (LUR) and Pearson Correlation Coefficient (PCC), have been applied to detect PM10 and Moderate Resolution Imaging Spectroradiometer (MODIS) along with four meteorological parameters. The average values of observed PM10-MODIS aerosol optical depth (AOD)-predicted PM10 have been analyzed with PCC correlation. Results, the M4 and M7 models are more reliable, where coefficient of determination (R2 > 0.6) and root mean square error (RMSE) = 2–14. PCC showed a strong positive correlation with significant levels among observed PM10-MODIS AOD-Predicted PM10. The concentrations of PM10 and AOD approximately increased by 182%, and 208%, respectively, and dropped by 28% to 30%, during COVID-19 (2020). In conclusion, utilize remote sensing with hybrid modeling to mitigate and monitor air pollutants in regions lacking ground-based air quality data resources.
Introduction
Respirable airborne dust particles with aerodynamic diameters of less than 10 μm particulate matter (PM10) have a significant impact on the atmosphere (Huang, 2023), ecosystem (Sohrab et al., 2023), and human wellbeing (Sasmita et al., 2022). Its two main sources like anthropogenic and natural activities. Like vehicle movement, incomplete fossil fuel burning, relict dust from construction residuals (Gao et al., 2022), along with airborne pollutants including sea salt, soil, and dust, all of which can contribute greatly to the production of PM10 (Wei et al., 2021). PM10, or fine inhalable particles, makes up most of the mass concentration of PM, with diameters 10 ≤ μm, e.g., burning particles, carbon-based compounds, metals). It is well known that this diverse mass of particles can enter human lungs quickly, resulting in respiratory issues such as bronchitis and emphysema that increase hospital admissions and premature death(s) (Kumar et al., 2023). Consequently, PM10 is quite concerning to all aspects of life, including the atmospheric environment and human health (Edwards et al., 2022). Considering its possible role in respiratory illnesses (Bălă et al., 2021), cancer (Smotherman et al., 2023), and heart diseases (Idrees et al., 2023), especially in industrial cities of underdeveloped countries such as Pakistan (Pakistan Population, 2023; World Bank, 2020).
Pakistan is today the world’s fourth-most polluted country (Macías-Hernández et al., 2023) and ranked fifth populated in the list of countries, equal to 2.83% of the global populace (Pedde et al., 2022). According to World Health Organization (WHO) research studies based on the air quality health index for Pakistan, air pollutants reduce the life expectancy of an individual Pakistani by 4.3 years, and PM10 concentrations in the air reduce life expectancy by over 7 years in the most polluted cities (Fan et al., 2023). Due to feasibility and economic considerations, air quality continuous monitoring stations (CAMSs) must be present in Karachi City, Pakistan. The field measurements’ PM10 small exposure to Karachi’s atmosphere may not represent the city’s various regions, which could lead to bias in epidemiological and environmental research (Ceamanos et al., 2023; Gao et al., 2022).
Determination of the mix source gets more complex in metropolitan settings, and identifying the main emission sources of ambient PM needs a great deal of work. The difficulty of identifying the predominant sources has become more pressing because of the dense dispersion of unstructured fugitive and nonducted area sources and the dearth of information regarding regional and long-range high emission sources (Bojjagani et al., 2023). Regarding reclamations of aerosol optical depth (AOD) from many platforms, remote sensing via satellite has become more accessible for PM10 monitoring studies throughout a vast spatial domain, as well as for small regions and big cities (She et al., 2022). AOD measures the attenuation of light by suspended particles in the atmosphere and is a substitute for the atmospheric pollution level (Nguyen et al., 2024). Different platforms have recently been employed for PM10-AOD research, such as the Multiangle Imaging SpectroRadiometer (Liang et al., 2023), the Spinning Enhanced Visible and Infrared Imager (Álvarez-Mendoza et al., 2023), the Medium Resolution Imaging Spectrometer (MERIS) (Gharibzadeh and Abadi, 2022; Ranjan et al., 2021), and Landsat (Payra et al., 2023; Zhang et al., 2022b). Moderate Resolution Imaging Spectroradiometer (MODIS) is extensively used in AOD-PM10 research (Zhang et al., 2022b). Among the numerous remote sensing platforms, the MODIS has more precise tools than other satellite-predicted resources and has been used by many researchers and academics from 2002 to now (Ahmed et al., 2022; Kalisa et al., 2023; Wei et al., 2021).
Generally, Land Use Regression (LUR) models are employed in small regions and big cities where there is a shortage of CAMSs and a scarcity of ground measurements (Feng et al., 2023; Zoran et al., 2023). Therefore, spatial geographical information system (GIS) interpolation techniques cannot be applied to AOD databases, because of limited spatial coverage, such as inverse distance weighting, kriging, and natural neighbor (Hameed et al., 2021; Shareef and Hashmi, 2020). In the case of insufficient ground-based observed (Obs) PM10 data or discontinuity of AOD data, LUR modeling is a helpful strategy for screening investigations and predicting datasets to fill gaps and improve modeling presentations (Sipra et al., 2021). This led to the development of LUR modeling based on weather studies and the annual PM10 concentration of 10 monitoring locations. Using the covariance method, the Pearson Correlation Coefficient (PCC) assesses the degree and statistical significance of the association between two relevant continuous variables. Many researchers investigated the pearson correlation among atmospheric contaminations globally (Das et al., 2022).
The study period spans 2013 through 2021 and incorporates the COVID-19 epidemic’s consequences. The worldwide COVID-19 pandemic has presented unimaginable difficulties, disturbing routine activities, and production systems everywhere (Index of/archive/rgb/MODAL2_E_AER_OD). Researchers in Karachi examined the impact of lockdown protocols during the COVID-19 pandemic on air quality (Caido et al., 2022). This thinks about pointed to gauge the levels of the ground-based PM10 and remotely detecting AOD and how the city’s air was influenced by lockdowns brought on by pandemics.
Utilizing MODIS AOD datasets from satellite and ground-based meteorological factors, such as temperature (TEMP), relative humidity (RH), wind speed (WS), and dew point, the goal of this work is to establish a link between PM10 and AOD in Karachi. Parameters utilizing univariate and multivariate linear regression techniques to assess the surface PM10 over the think-about region for nine a long time (2013–2021). Subsequently, the developed models were rigorously validated and evaluated.
The available studies on estimations of PM10 concentrations, particularly those employing remote sensing hybrid modeling, still need to be explored in the study area. However, such methods often need to pay more attention to the complexities within specific cities, where localized emissions are crucial. This study, focusing on Karachi City, addresses these gaps by exploring the factors affecting PM10 concentrations in a densely populated urban environment. The discoveries can upgrade future investigations, improving Karachi’s air quality assessments’ scope and exactness and aiding in developing targeted strategies to mitigate health risks associated with airborne PM in the region.
After a careful audit of concurrent writing and understanding the gaps, the display ponder was attempted with the taking after targets in Karachi are:
Study MODIS AOD data, a visualization-assisted tool that integrates with ground-based PM10; Statistical application to convert AOD data to predicted PM10 values; Estimate the expected error percent (EE %) between PM10-AOD; COVID-19 lockdown impacts on the atmosphere of Karachi; Trend dynamics of observed PM10 relationship with predicted PM10.
The significance of this study is to analyze the negative impacts of PM10, which are expected to worsen Karachi’s air quality and are heavily influenced by the city’s growing health burden and economic activities.
Materials and Methods
The proposed methodology is based on a study designed for a single ground-based air contamination PM10 concentration analysis, integration with remote sensing satellite data in Metropolitan City Karachi, Sindh, and Pakistan. The ground-based ambient PM10 preliminary analysis requires data ingestion, visualization, and deriving insights. The high-tech geostatic platforms are already geared with all possibilities to PM10 data analytics and aid in environmental management decision-making and action. To achieve the above objectives for Karachi City, the construct real PM10-AOD inversions to visualize distribution and variability trend levels into simple plots such as spatial-temporal maps, line charts, and bar charts.
Study area
With a population of over 24 million, Karachi is the largest city in Pakistan and the 12th most populated city worldwide. The focus of this particular study is on the quality of the air in Karachi. Karachi lies at the southernmost point of the nation, between latitudes 24°47'N and 25°12'N and longitudes 66°50'E and 67°37'E, along the Arabian Sea Coast, and its current area is 3,640 km2 (Rahman, 2023). Karachi has an arid climate; moderate TEMP includes a low precipitation rate.
Figure 1 depicts the 10 sampling points located in urban areas of Karachi, which together make up 1500 km2. Therefore, it depicts the regional features of urban cities in calm residential, commercially active, high-traffic zones, and industrial areas. The PM10 observation stations in the study area cover large residential and commercial complexes including the five industrial zones of North Karachi, F.B. Area, Landhi, Korangi, and SITE.
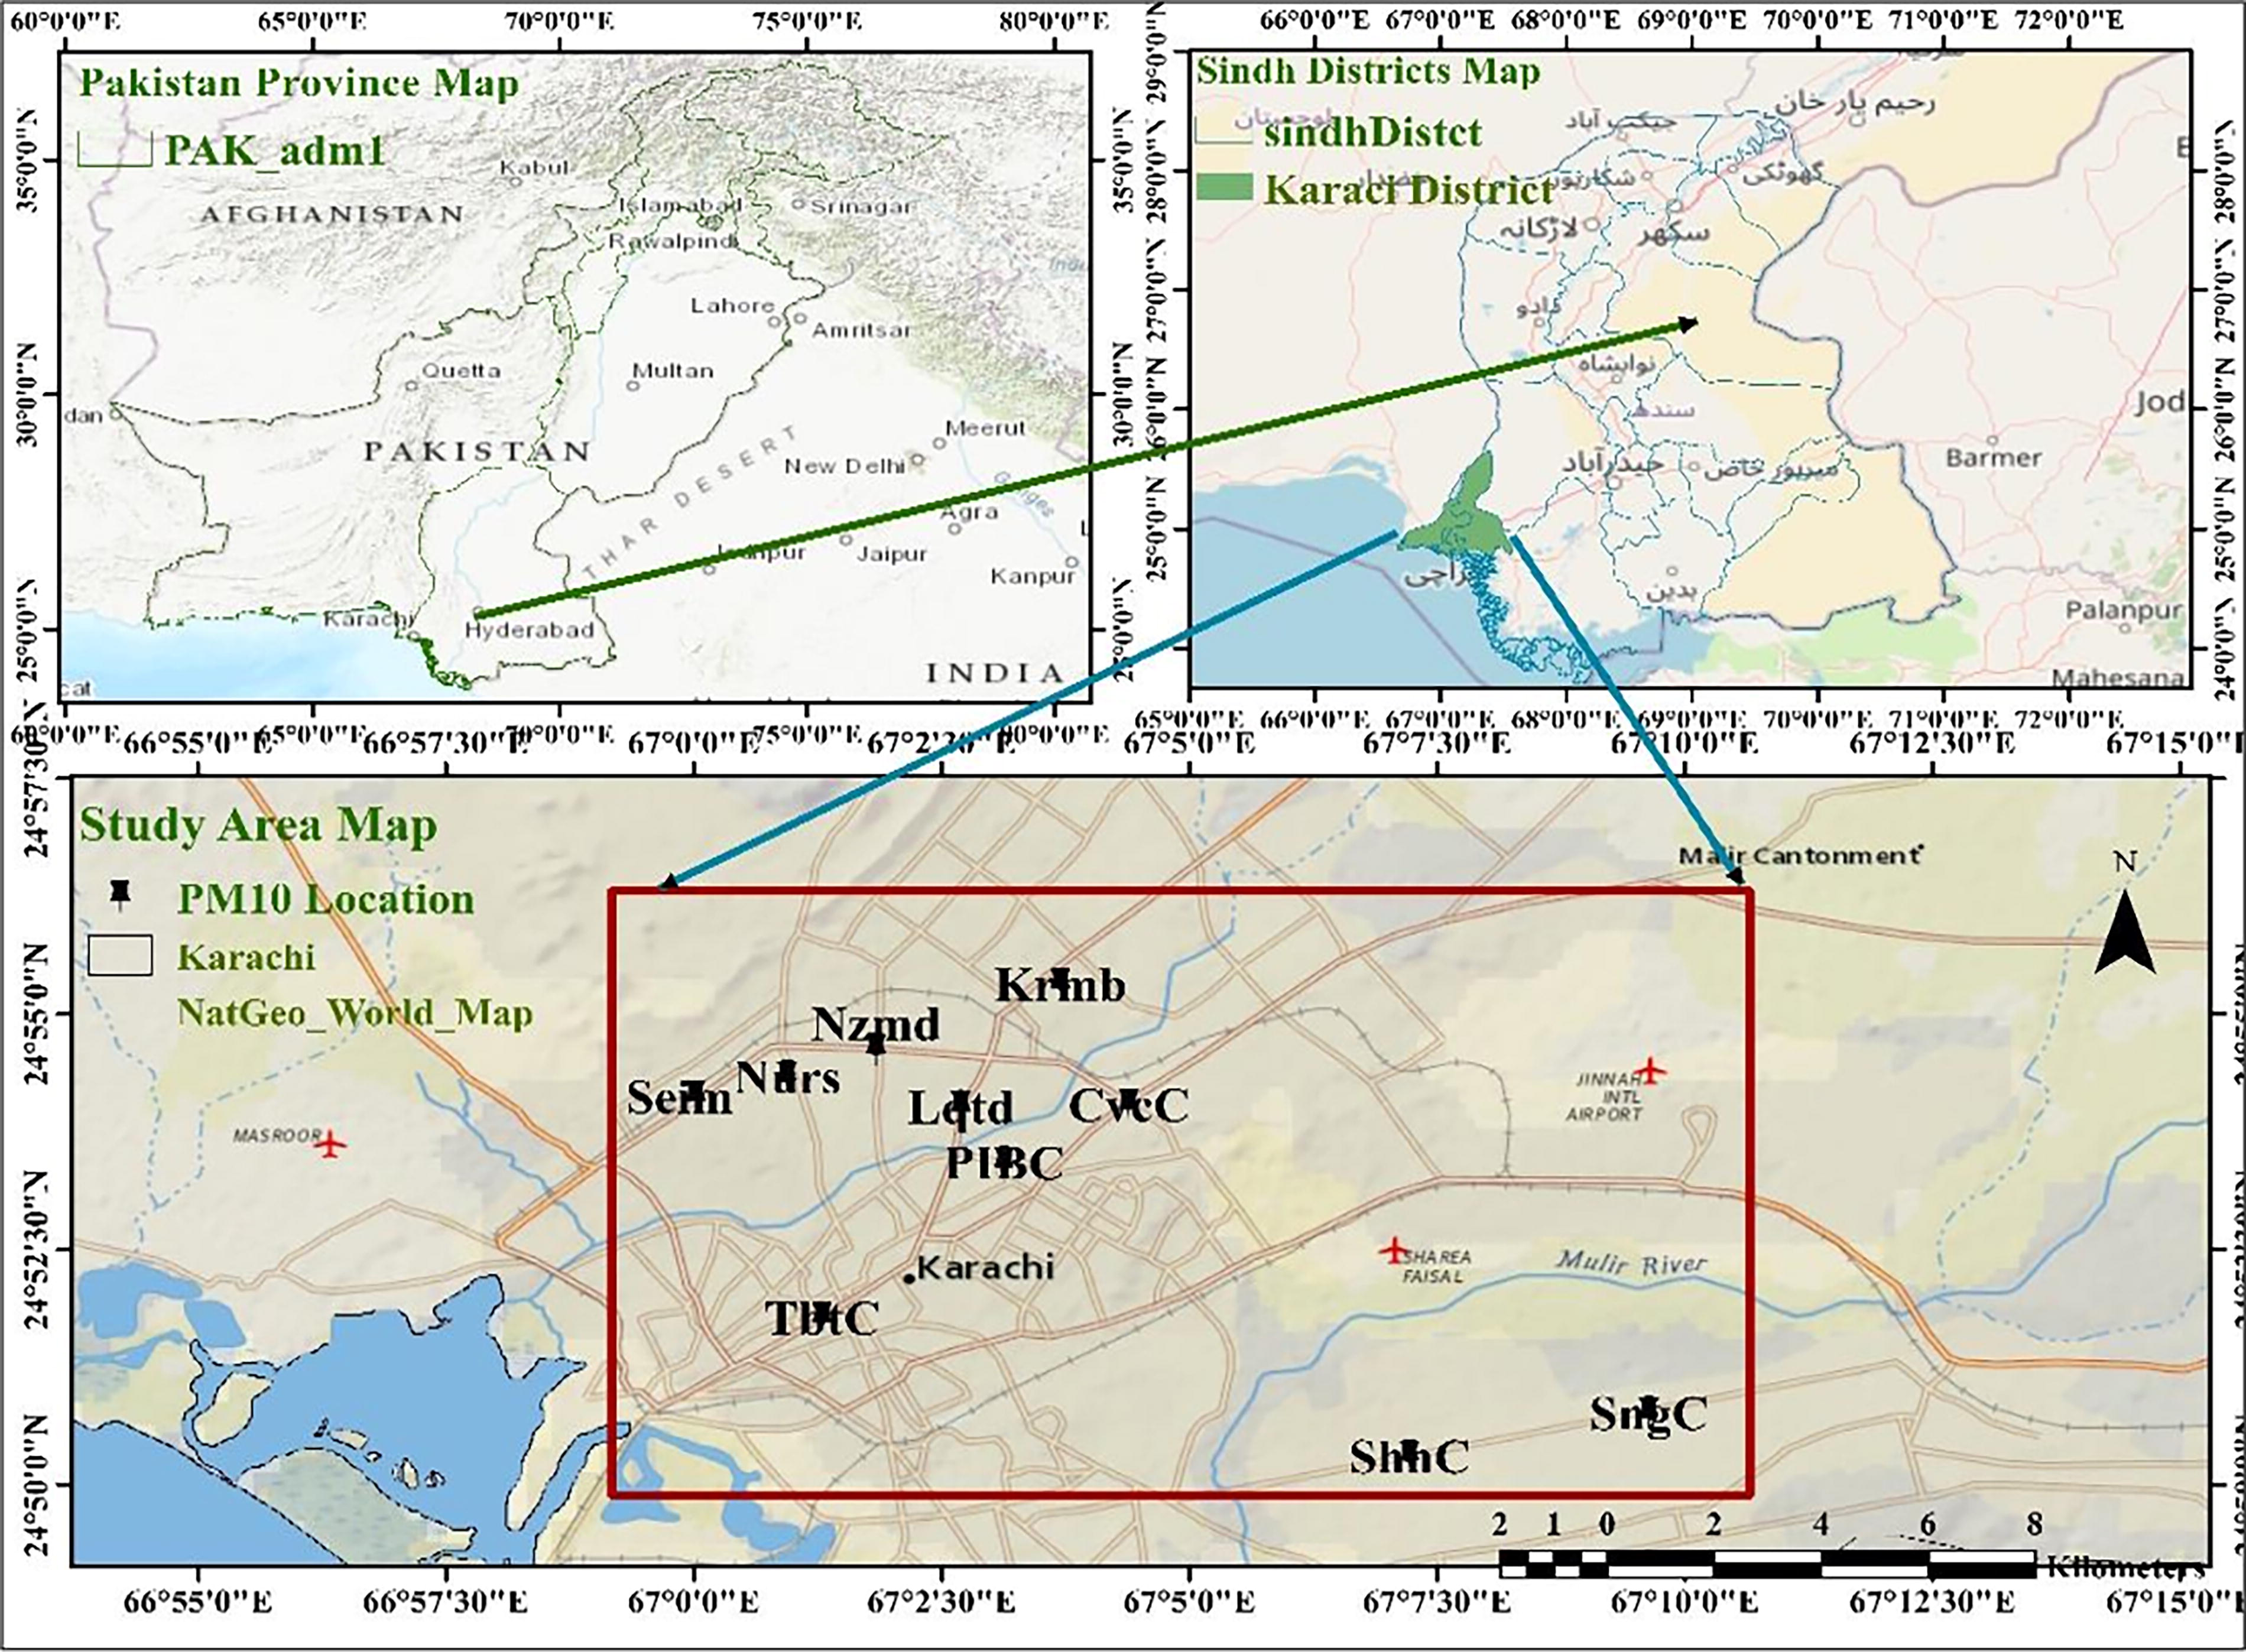
Base map and data locations map of the study area.
Research framework
The research endeavors to contextualize and enhance the understanding of Karachi’s air quality dynamics. To achieve the goal of improving prediction LUR and PCC, the spatial-temporal analysis of PM10-AOD along with meteorological variables. More details are given as follows by introducing the structure of this study, uses air quality ground-based measurements and Earth observations (EO) of atmospheric composition and historical trends, statistical prediction modeling (SPSS 22), and finally, all datasets analyzed and mapped at different spatial, temporal scales with ArcGIS (ArcMap).
PM10 data extraction
The study required extensive ground-based PM10 sampling (pollutant concentrations), geographic data, meteorological data, and preprocessed satellite remote sensing data. We used the field-based database from published provincial and federal agency data. The PM10 concentration data of 10 selected sites in Table 1, from 2013 to 2018, were gathered from the Council of Scientific and Industrial Research in Pakistan. Yu et al., (2022), the Sindh Environmental Protection Agency, and Environmental Research Center collected the data for the remaining 3 years (2019–2021).
Data Location Points (Loc, ID, Long-Lat, and on Field Observations)
Level 2 Tera/Aqua MODIS AOD (Aerosol-L2-3 Km) data of 1-month average (54 observations) images for 6 months from March to August 2013–2021 were downloaded from the NASE Earth Observations (NEO). NEO MODIS (Tera/Aura) AOD data have collected a spatial resolution of 0.1° × 0.1,° which is a merged 0.55 μm combination of dark target and deep blue for the Karachi region study https://neo.gsfc.nasa.gov/ (Shin et al., 2020; Tella and Balogun, 2021).
The four meteorological parameters data included TEMP, RH, WS, and dewpoint (DP) retrieved from the Pakistan Meteorological Department’s page and Wunderground.com (Nakada and Urban, 2020). The historical weather data of Karachi for 9 years in Table 3, from 2013 to 2021, were obtained corresponding to 10 locations and periods of PM10 measurements at PM10 at ground level.
PM10-AOD data diffusion
The diffusion between satellite-based AOD and in situ PM10 concentrations changes dramatically with regional climate variables, local emissions, and chemical composition. To consider these variations, all the prediction factors were determined per stations, time, and stack predators in 6 months, according to the time period of all PM10 observations. Along with the univariate basic formula equation applied on M1 (PM10-AOD), multivariant (M2–M7) linear regression formulas are used to integrate the PM10 with AOD and selected meteorological variables (Zhang et al., 2022b). The performance of linear regression models output results is estimated in terms of intercept (β) and slopes (αAOD, αTEMP, αRH, αWS, αDP, and αPBLH) of predictors, respectively. Initially, the statistical model was built with just one variable as the dependent variable (PM10) and dependent variables AOD, and meteorological factors stepwise one by one in sequence as the independent variables according to the model formula in Table 2 and vice versa.
Regression Models and Specification
Table 2 represents the simulation carried out using the seven LUR models to predict PM10 in Karachi City. These LUR models predicted the air quality of the atmosphere from the optimum data of metrological profiles (Zhang et al., 2022b). The results of these regression models simulation are collected in terms of intercept β and slopes, respectively, αAOD, αTEMP, αRH, αWS, and αDP. The statistical analysis of the seven LUR model’s performance was assessed by subset coefficients: that is, coefficient of determination (R2), adjusted regression coefficient R2, root mean square error (RMSE), Durbin Watson (DW), and EE%.
Figure 2. presents the data diffusion workflow of statistical simulation and spatial analysis of atmospheric variables of air quality dynamics of Karachi region insights using LUR and PCC modeling techniques for ground-based PM10 and MODIS AOD.
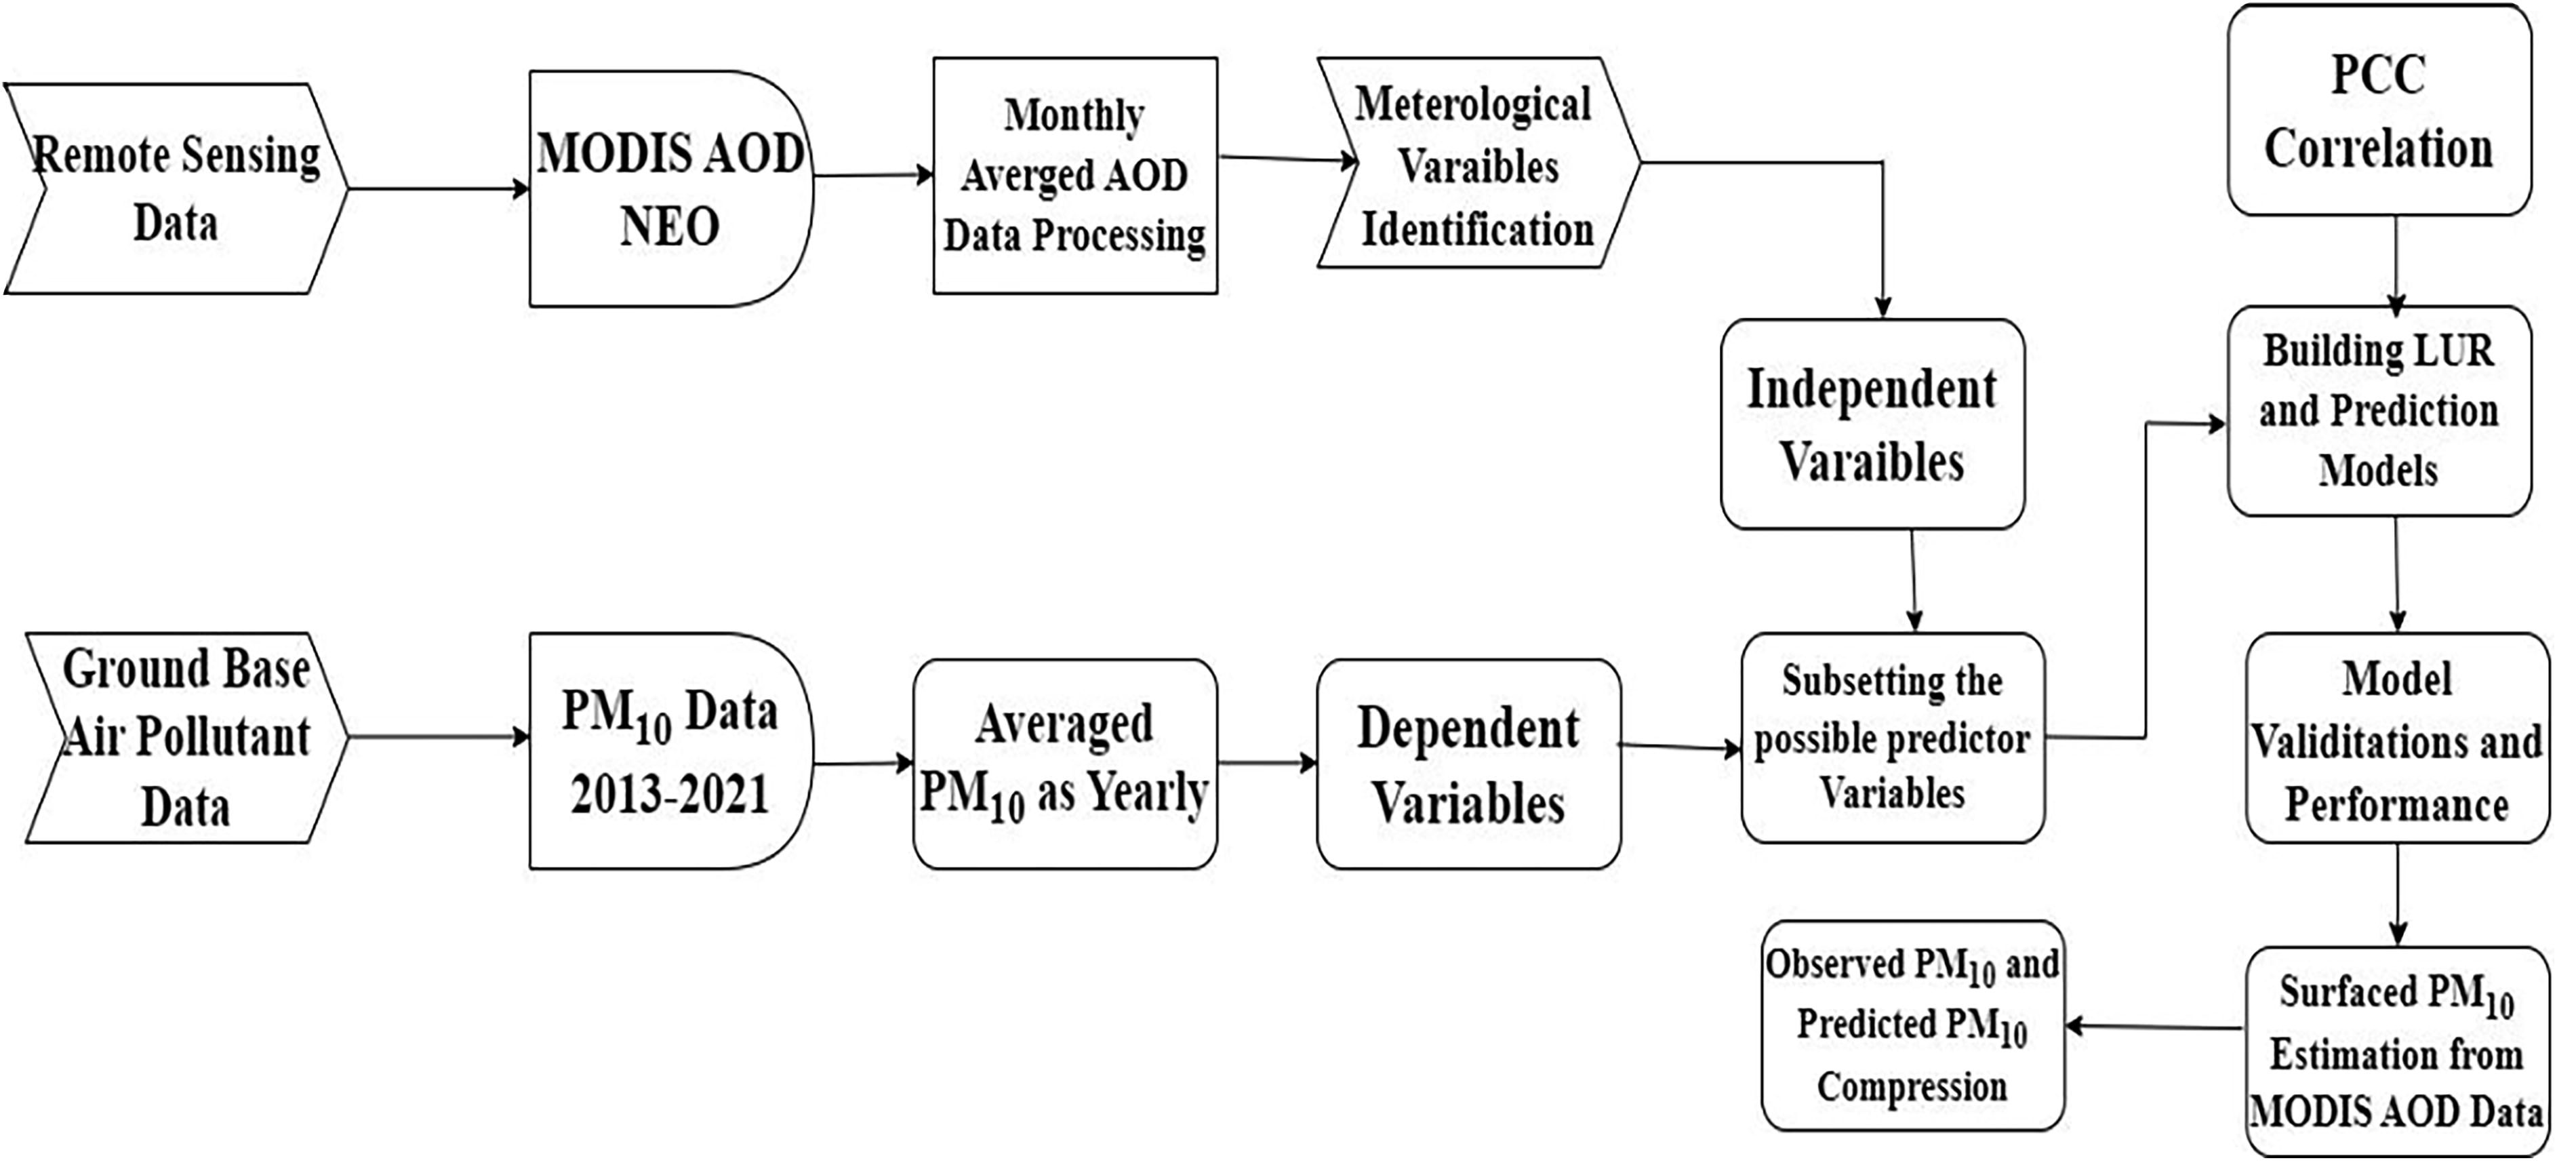
Workflow of LUR and PCC modeling for GB PM10-AOD data diffusion. LUR, land use regression; PCC, Pearson correlation coefficient; PM10-AOD, particulate matter-aerosol optical depth.
The EE% is the difference between the PM10 actual value and the expected value of AOD. For the dispersion measurement of AOD-PM10 statistically to calculate and may predict error (Zuyi et al., 2022).
The ratio of expected error in the percentage of PM10 AOD is represented as EE%. The LUR models provide correctness of data by counting the number of pixels from NEO-AOD repossessions with ArcMap.
Results
The results of the present study were acquired by applying seven LUR models to estimate the surface PM10 concentrations variable from 2013 to 2021. The hybrid integrates the observed PM10 data as a dependent variable with AOD derived from MODIS imaginary, including TEMP, RH, WS, and DP as independent variables. These models are developed to predict the surface PM10 levels to compare with observed PM10. These five independent parameters are crucial in predicting PM10 concentrations over the specified period.
Table 3 shows the data values of observed (Obs:) PM10, MODIS-AOD retrievals, and metrological variables during the study period. The minimum and maximum values for the same time and space were displayed at each of the 10 selected data sites. In this study, the criteria to consider PM10 as the dependent variable and six independent variables indicated in Table 3 as predictors to predict near-surface PM10. The outcomes demonstrated in Table 3 are that the variation in surface PM10 concentration are consistent with AOD variance and display data values for PM10 and AOD that have increased by nearly 40% over the past 9 years. The MODIS AOD considers only those datasets with at most 10% cloud density. The regression analysis produces the coefficients in constants and slopes between PM10-AOD and all other inputs.
Annual Min–Max Observed PM10, AOD, and Metrological Parameters
Figure 3 demonstrated a correlation between the observed PM10 with AOD, and meteorological parameters were evaluated, and the results identified the influence of different meteorological parameters (TEMP, RH, WS, and DP) on PM10-AOD concentrations. The study period clearly shows that the TEMP trends are in phase (positive correlation) and RH-DP are out of phase (negative correlation) with PM10-AOD concentrations. A negative correlation was found between RH-WS-DP and PM10-AOD concentrations, indicating the predominance of local climatic patterns. RH-DP trend showed a very low negative correlation with both PM10-AOD due to the near homogeneity observed in the daily RH values. It revealed a significant influence of TEMP on PM10 compared with the concentration of RH-WS-DP parameters in the Karachi City atmosphere (Zhang et al., 2022b).
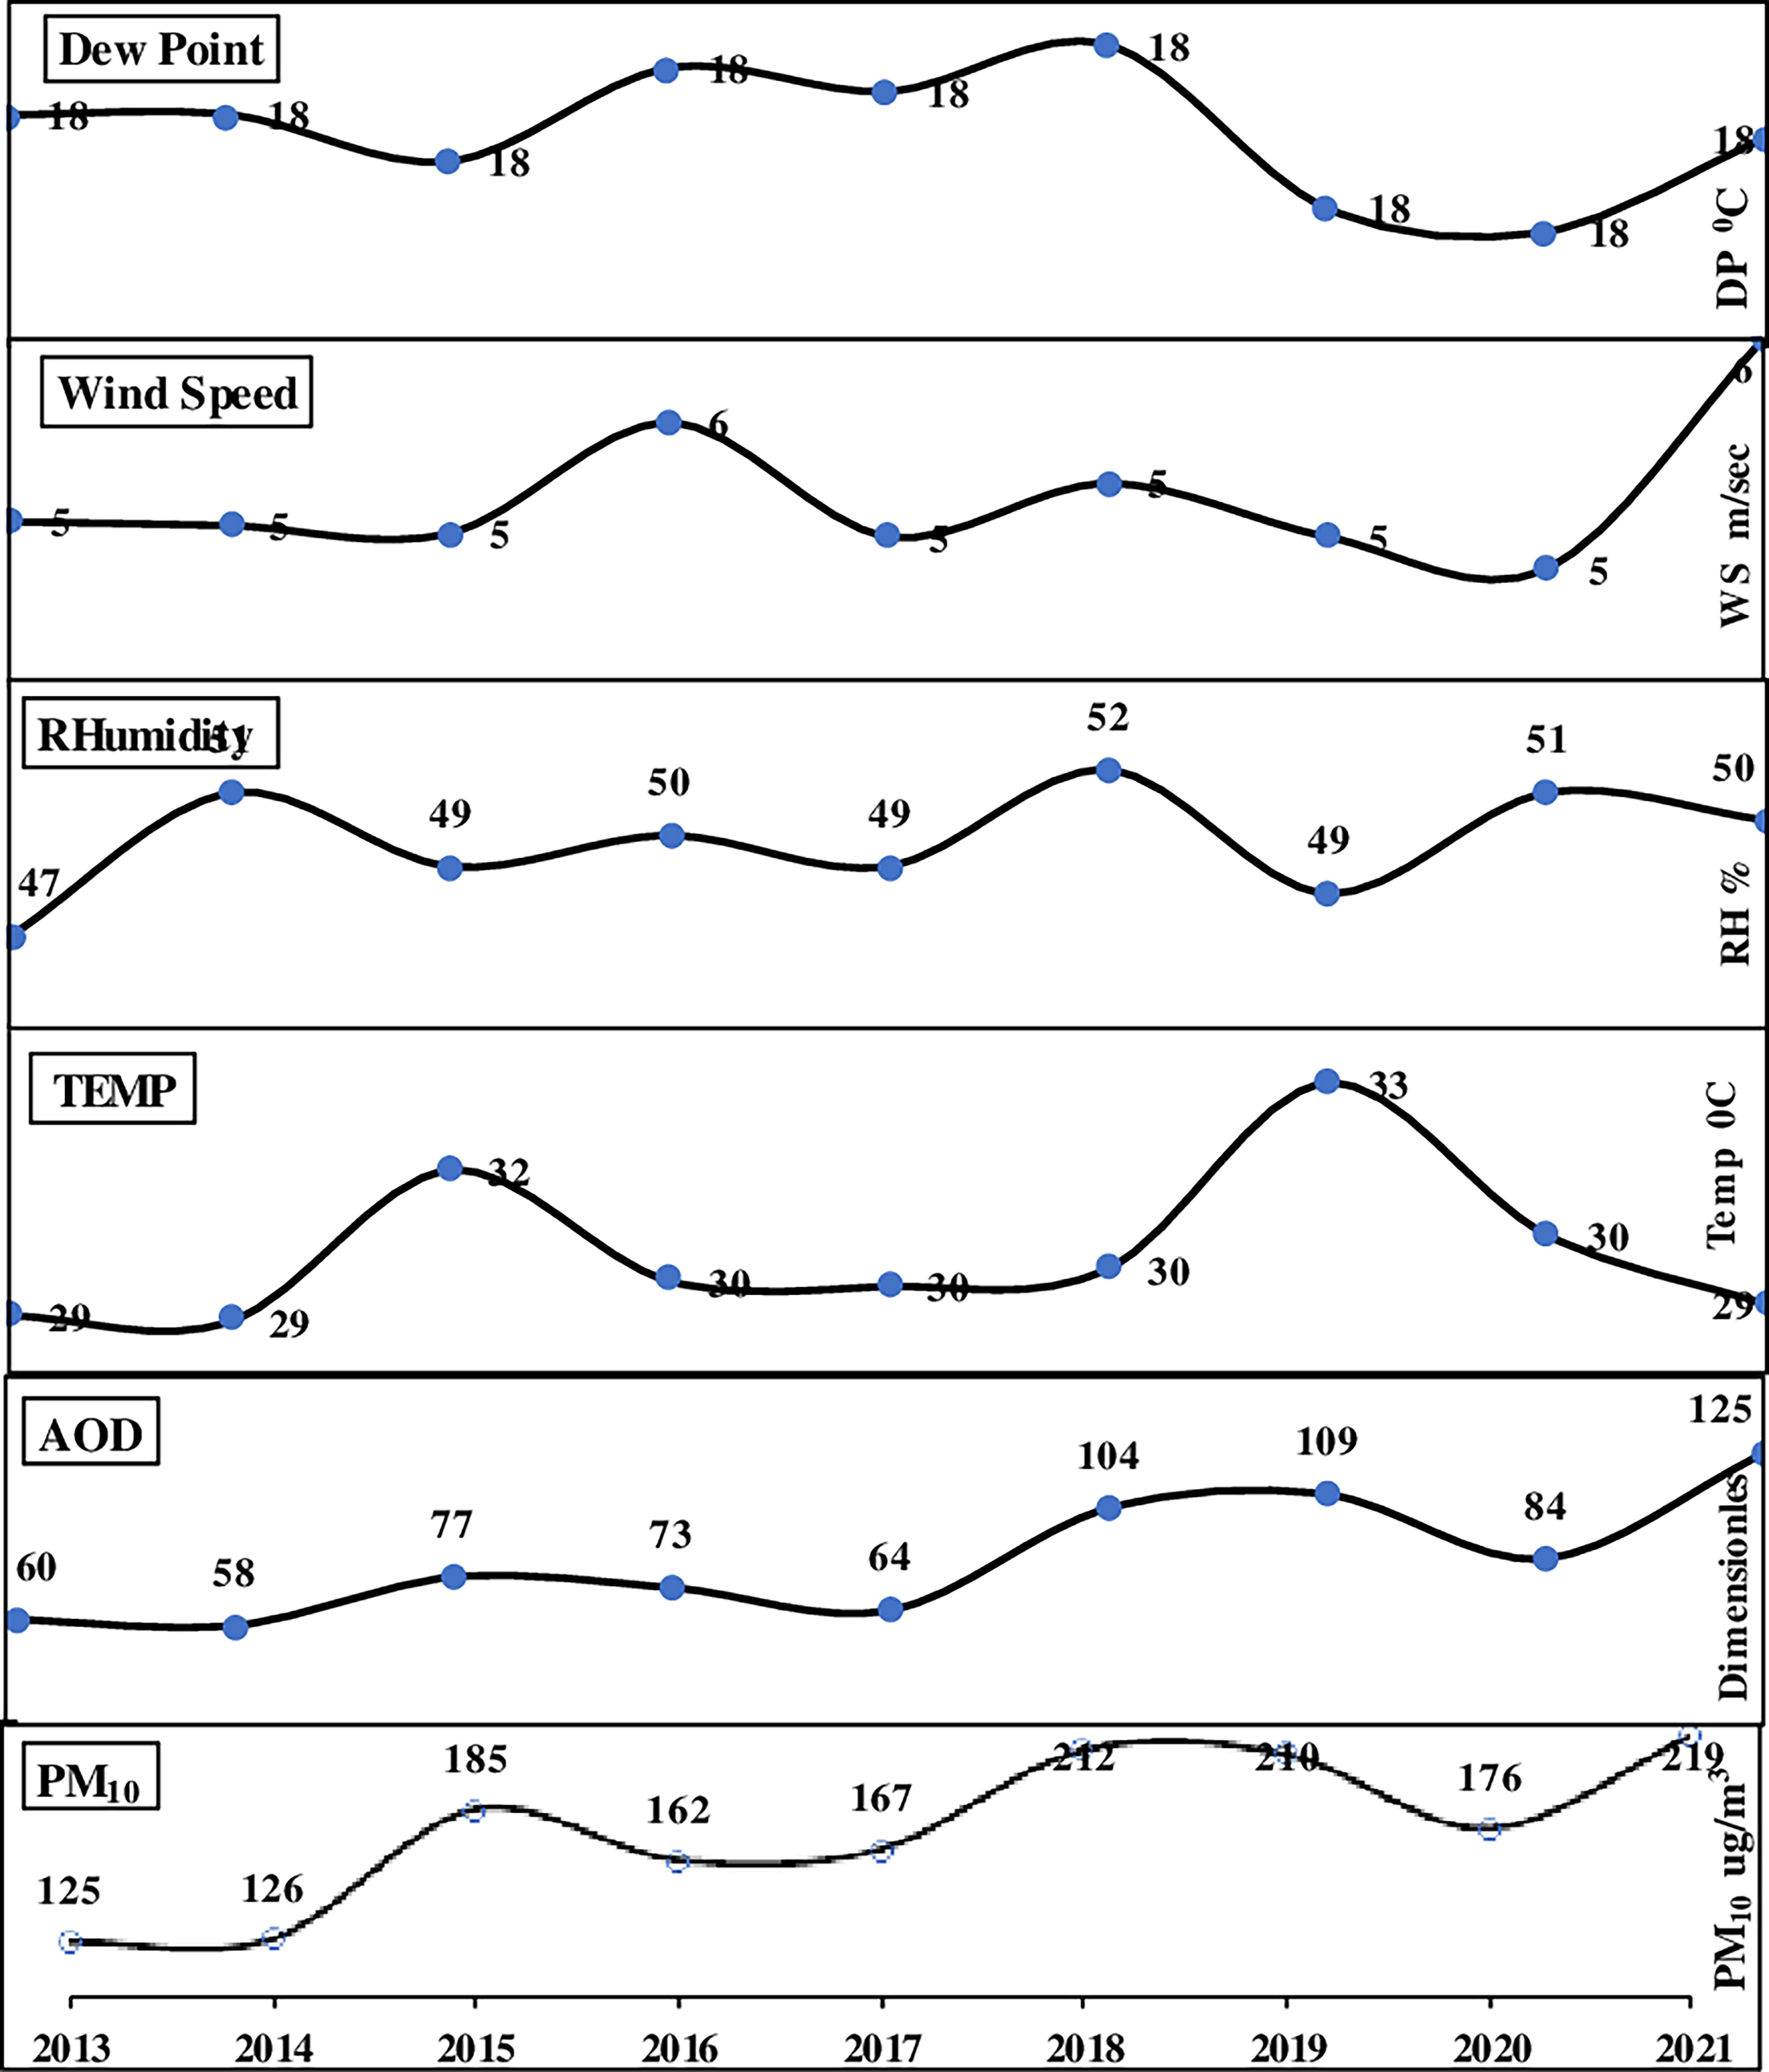
Averaged PM10-AOD with meteorology variables during the study period (2013–2021).
Statistical model validation
The LUR quantitative studies have consistently revealed that greater PM10 prediction accuracy can only be attained when the various predator data are included as inputs. Nevertheless, evaluating how much each climatic parameter is improving the prediction performance is also crucial. Nevertheless, the most effective predictive models are M4 and M7, the years of modeling were 2014, 2018, and 2020, which were repeated with multiple iterations, keeping each alternate input parameter used and analyzed.
Table 4 shows the regression analysis produces the coefficient results in the form of constants and slopes between PM10-AOD with all other inputs. The univariant and multivariate linear regression output parameters of modeling in terms of coefficient of determination “R2,” “adjusted R2,” “RMSE,” Durbin-Watson. The AOD has a very positive coefficient correlation with PM10 in all models and all years of analysis. The regression modeling coefficient analysis of all climatic variables was randomly associated with predicted (Pred:) PM10 over Karachi City locations, as observed by recent studies in other parts of the world in recent years (Hameed et al., 2021). The TEMP, RH, and WS have the majority of positive values, showing that PM10 is better associated with TEMP and WS, while it is more sensitive to RH and DP. Hence, higher RH and dew points lead to a significant drop in PM10 pollution, and TEMP and WS increase the PM10 concentrations (Maleki et al., 2022).
Regression Output Summaries, R2; Adjusted R2; RMSE; Durban Watson
Figure 4 demonstrates the distribution of the annual mean of observed PM10 at Karachi City compared with the two most favorable models, predicted PM10 for 9 years. It estimated with the help of models M4 and M7, that both multivariable linear regression models showed better coherence with observed PM10 and indicate that the variations in concentration of PM10 are consistent with AOD variance.

Mean annual observed PM10 with Predicted PM10 (M4 and M7).
The EE% was calculated among the observed PM10-AOD using equation no. (1). The computation between observed PM10 and AOD has the EE% value of 53 ± 4% (47%–56%). Therefore, this study’s EE% computing accuracy is much better, and the EE% gave better results in predicting near-surface PM10 contaminations. It is a common practice to estimate the EE% to validate the Aeronet-AOD modeling performance EE% and recently were estimated at 59.15% and 57.03% (Zhang et al., 2022b). In the computation of EE% with MODIS AOD as independent variables in model M7, values of R2 were 1 or very near to 1 and DW nearly 2; approximately 100% model fitting suggests the accuracy of EE% estimation between PM10 and MODIS AOD data.
Statistical model performance
Fixed effects intercepts (β) and coefficients (α) present the average values for the duration of the study, while the random effects depict the PM10-AOD relationship’s time-varying properties. We run seven models with different independent variables to check their impact on PM10 in year-wise capacity. In all models, a constant value is highly positive except in 2016 and 2018. The coefficient sign of AOD is also positive in all years except 2019 and 2020. AOD is the sole variable that provides a minimum effect on PM10 in comparing the rest of the independent variables. The RH coefficient is also positive in all years except 2013, 2018, and 2020.
Table 5 presents the annual minimum and maximum values of AOD slop (αAOD) and intercept (β) for the seven LUR models. Analyzing all the models, the β value is generally positive except for 2016 and 2018. The α of the AOD is positive except for 2019 and 2020. Examining the regression coefficients in Table 5, positive signals show a favorable link between PM10 and AOD, while negative values point to the reverse relationship. Analyzing the three tables collectively, the all-models constant value is mostly positive except in 2016 and 2018, and a Coefficient sign of AOD is also positive in all years except 2019 and 2020.
Model Performance Intercept (β) and AOD Slope (αAOD)
Figure 5 illustrates the annual average variations in PM10-AOD concentrations in Karachi over the observation period. It shows that the R2 in both series is almost 70%, with positive intercepts (β) and slopes (α) of 10 and 7, respectively. The regression analysis of observed PM10 shows the best-fitting results and is identical to AOD outputs Figure 5. The trends of both the averaged datasets are identical and should validate the ground measurements and remote sensing AOD retrievals. Figure 5 shows a comparison between observed PM10 and predicted PM10 and shows depression during the COVID-19 lockdown period from 2019 to 2021. The annual averaged PM10-AOD concentrations in Figure 5 varied from 125 to 220 μg/m3 and 56–124 (unitless). In more than 70% of the observations, levels of PM10 were significantly higher than Pakistan’s National Ambient Air Quality Standards (150 μg/m3) and the WHO’s (50 μg/m3).

Annual averaged PM10-AOD comp is, intercept, R2, slope, and COVID-19 anomaly.
Pearson correlation and comparison among Obs: PM10-MODIS AOD-Pred: PM10
PCC results reveal that the AOD concentration level in the atmosphere is related to the PM10 contamination formation at the surface and near the surface of the Karachi area.
Table 6 revealed that Obs: PM10, Pred: PM10, and MODIS AOD depicted strong positive correlations with r values ranging more than 90% with highly significant values p = 0.01. The atmospheric concentration of AOD observed PM10 and predicted PM10 were all highly consistent. Thus, a strong correlation was found at a 0.01 significance level among the concentration of observed PM10-AOD (r = 0.919, p = 0.01), observed PM10-predicted PM10 (r = 0.998, p = 0.01), and predicted PM10-AOD (r = 0.922, p = 0.01)
Correlation Among the Obs: PM10, MODIS AOD, and Pred: PM10
Correlation is significant at the 0.01 level (two-tailed).
Figure 6 demonstrates the ground-based observed PM10 measurements of 9 years (2013–2021) at Karachi City are compared with corresponding MODIS AOD and Pred: PM10 values. Three parts of Figure 6 depicted the comparison of Obs: PM10-Pred: PM10 (R2 = 0.9954, RMSE = 0.27 μg/m3), Obs: PM10-MODIS AOD (R2 = 0.845, RMSE = 21.2 μg/m3) and Pred: PM10-MODIS AOD (R2 = 0.8492, RMSE = 21.5 μg/m3). The best comparison among the three was observed and predicted PM10 concentrations. High values in all three univariant regression analyses of the R2 indicated demonstrated in Figure 6 (a, b, and c) that PM10-AOD measurements and predicated PM10 concentration have at the same time and with the same relative magnitude during the analysis period.

Comparison among the observed PM10, MODIS AOD, and predicted PM10:
COVID-19 impact on PM10-AOD of Karachi air
WHO announced the COVID-2019 (SARS-COVID-19) on March 11, 2020, and the lockdown was deemed the most effective tool in ceasing the spread of the devastating coronavirus infection globally. The study’s key findings displayed that the AOD levels in Karachi urban areas greatly reduced (∼28%) through the lockdown times (March 25 to July 15, 2020) related to the overtime mean AOD level from 2013 to 2019. However, the increase in AOD concentration levels was ∼30% during the same period of 2021. The reduction in ground base PM10 levels due to COVID-19 in Karachi, Pakistan, during March–April 2020 related to the same duration in 2019 was decreased by ∼17% in 2019, and an increase of ∼24% concentrations in 2021 was observed during the lockdown over Karachi due pandemics.
Discussion
This study explores the correlation between PM10 levels and AOD from MODIS satellite imagery in Karachi City, Pakistan. It also incorporates ground-based meteorological parameters such as WS, dew point, TEMP, and RH into the analysis. Using univariate and multivariate linear regression methods, PM10 concentrations are forecasted across the study area over 9 years (2013–2021). It is evident from the results that models M4 and M7 consistently yield favorable results with consistent signs of independent variables. These models exhibit favorable statistical metrics, including Durbin-Watson, R2, adj R2, and RMSE, as depicted in Figure 4. Notably, models M4 and M7 demonstrate R2 values exceeding 60% across all years, along with Durbin-Watson statistics approaching two in nearly all instances.
Moreover, the RMSE indicates a minimal mean square error for these models, underscoring their reliability. Consequently, we endorse using these models for PM10 prediction, aligning with recent research findings. Despite employing statistical equations (Table 2), for near-surface PM10 estimation, model summaries and coefficient analyses affirm the efficacy and significant coherence of formulas M4 and M7 with observed PM10 levels. Figure 4 compares observed and predicted PM10 using multivariate linear regression models M4 and M7, revealing their superior performance and robust correlation. Notably, the observed–predicted PM10 relationship exhibits fluctuations during the COVID-19 lockdown period from 2019 to 2021.
Recent studies globally have integrated ground-based PM10 measurements with MODIS AOD retrievals to develop hybrid models. The authors compared AOD retrievals with observed PM10 pollution levels in Quito, Ecuador, employing various meteorological parameters and environmental indices as predictors to formulate an optimal equation for citywide PM10 estimation. Zhang et al. (2022a) applied nonlinear LUR models based on generalized additive models to predict air pollutant concentrations and AQI in Beijing, achieving adjusted R2 levels ranging from 70% to 90%. The researcher utilized a hybrid model combining a chemical transport model and geographic time-weighted regression to estimate PM2.5 and PM10 concentrations in mining cities of China, with an R2 of 0.926 and RMSE of 16.67 μg/m3 for PM10 (Zhang et al., 2022a). Munir et al. (2021) also generated NO2 maps and estimated concentrations using LUR models, and RS data fused with measurements from low-cost sensors in Sheffield, U.K. The authors explored 10 years of data in Ahvaz, Iran, constructing linear and nonlinear multivariable regression models using PM10-AOD data and meteorological variables to estimate PM2.5 and PM10 concentrations, achieving a forecast accuracy of 64% for PM10 concentrations.
During the COVID-19 pandemic, various studies across different regions consistently reported significant reductions in PM10 concentrations, including in Karachi City, Pakistan. In comparison, studies of COVID-19, the following hybrid studies, were carried out over the globe during the COVID-19 lockdown. In Brazil, authors observed PM10 concentration decreased from −24% to −62% (Martins et al., 2024); Malaysia’s Klang Valley found a reduction in PM10 concentration from −51.8% to +14.2% (Rahim et al., 2023), and concluded PM10 concentration decreased from approximately −56.6% to −51.9%. Finally, combined air pollutants monitoring data with satellite data in Singapore (Mailepessov et al., 2024), revealing a −23.0% decrease in PM10 concentration values. This reduction in air pollution emphasizes the environmental impact of such interventions and the significance of long-term practices in addressing air quality challenges. Multiple cities across India found consistent reductions in PM10 during the same period in 2019–2022, ranging from −24% to −62% (Bojjagani et al., 2023; Kumar et al., 2023). These studies, many of which were done in neighboring countries, clearly demonstrate that PM10 concentrations reduced significantly during the COVID-19 pandemic. The resulting reduction in air pollution emphasizes the environmental effects of these interventions and the importance of long-term strategies in resolving issues with air quality.
From a future perspective, the results of this study indicate that the population and environmental ecology of Karachi City will be significantly impacted by the application of hybrid modeling for PM10-AOD using LUR in conjunction with meteorological data. By adding meteorological factors, the hybrid model can more correctly estimate PM10 concentrations, allowing for targeted efforts to lessen hotspots for air pollution. This is particularly crucial for Karachi City, as the ecosystem can benefit from improved air quality management, yet excessive PM concentrations can have detrimental effects on human health. Future generations’ well-being and Karachi City’s ecological balance will be enhanced as the research’s conclusions are put into practice. In order to improve the model’s prediction power and expand its suitability for Karachi’s varied urban surroundings, governmental and commercial institutions ought to support and incentivize researchers to carry out ongoing studies in this area.
The future directions of research revealed that the integration of social and geographical features with meteorological elements in hybrid LUR models holds significant potential to improve efficiency and accuracy in future research paths related to PM10-AOD modeling in Karachi City and has the potential to foster a healthier urban environment, safeguarding both humans.
Geographical indices (cover and topography) and social parameters (population density, industrial activities, GDP, and vehicular traffic) are pivotal in shaping air quality in urban areas such as Karachi. Utilize more remote satellite sensors such as MLS, CALIPSO, MERIS, SCIAMACHY, VIIRS, OMI, or Tropomi with MODIS for PM10-AOD integration to enhance the efficiency of LUR hybrid modeling in Karachi as a future perspective in PM10-AOD modeling. This multisensory approach allows for a more detailed understanding of the spatiotemporal variability of PM, considering both local and regional sources. The synergy of these satellite datasets not only refines the accuracy of predictions but also aids in identifying specific emission hotspots and understanding the dynamics of air quality in the urban environment.
Conclusion
This study quantitatively analyzed to predict and correlate with strength near surface PM10-AOD in Karachi urban through LUR (seven models) and PCC techniques between 2013 and 2021. It is concluded the most consistent results with the same sign of independent variables are found in models M4 and M7. DW, R2, adj R2, and RMSE (μg/m3) results are quite good for models M4 and M7. In these models, R2 in all years is greater than 60%, and DW is also near two in almost all years. RMSE also indicates the lowest mean square error for such models. From this analysis, it is feasible to draw conclusions: (1) traditional LUR models can be replaced with empirical models that are built using solely remote sensing data as predictors, (2) the outcomes of the linear regression models comparison show that good and most robust result are produced by model number M4 and M7, (3) PCC correlation among the three datasets are very high with strong strength levels, (4) the overall average values increase in nine years, observed PM10 and AOD 182% and 208% respectively, (5) EE% have very similar temporal patterns (PM10-AOD) in average 53 ± 4% is observed in the case of Karachi, can be used to estimate PM10 at locations without PM10 data coverage and also can fill in-gaps in AOD, (6) generally, in all years of the month of April have nearly 15% to 20% higher values with compare to other months in AOD data (TEMP affect), (7) MODIS data pixel point reading it was a general trend that the pixel values near the coastal areas have less values with compare to city center values (humidity affect), and (8) COVID-19 lockdown clearly exabit in the data blanch in both PM10-AOD datasets. The spatial and temporal trend of PM10 predictions matched the spatial and temporal trends of PM10 measurements well in Karachi City.
Footnotes
Acknowledgments
The Environmental Research Center at Bahria University Karachi Campus in Pakistan.
Authors’ Contributions
A.D. and Y.N.: designed the experiment. A.D.: performed the field works. Y.N. and H.N.: carried out the data analyses. J.A.B. and K.G.: helped to gather data performed the artwork and wrote this article. K.G.: revised this article. All authors contributed to the discussion of the data and have approved for submission.
Author Disclosure Statement
No competing financial interests exist.
Funding Information
This research received no any external financial support.