
Abstract
Metal-organic frameworks (MOFs) are a class of materials with highly crystalline structures that are frequently utilized for the adsorption of organic dyes such as methylene blue (MB). The conversion of polyethylene terephthalate (PET) plastic to terephthalic acid in MOF synthesis represents a novel and promising “waste to MOFs” approach to utilize the vast amount of PET wastes. In this study, MIL-53(Al) was synthesized from waste PET plastics via a one-step hydrothermal process using water as the solvent, with the highest PET processing efficiency of 71.252% at 200°C, solvent volume of 2 L and material/solvent ratio of 9.4 g/mL. The highest PET to MOF conversion efficiency reached 99.2% at 198°C, solvent volume of 5.5 L and material/solvent ratio of 19.6 g/mL. Although the synthesized MOF material had a low BET surface area of 0.4463 m2/g due to inefficient washing and activation processes, it exhibited a maximum adsorption capacity of 12.16 mg MB/g after optimization. This opens up a potential direction in converting waste PET plastics into MOFs by a simple, inexpensive, convenient and environmentally friendly method, which can be applied for many purposes such as adsorption of organic dyes.
Introduction
Methylene blue (C16H18N3SCl - MB) is an organic compound, which is also known as methylthioninium chloride or glutylene. MB is a thiazine dye that exists as a dark blue or blue solid under normal conditions; when dissolved in water, MB dissociates to form MB+ cations and the solution has a pH of 3−4.5 (Bouras et al., 2021). MB is commonly used as an oxidizing-reducing agent (Zaghbani et al., 2007), photosensitizer (Silman et al., 2013), optical redox indicator in analytical chemistry (Dante et al., 2019), and material in solar cells (Nurhidayani et al., 2017) and so on. In medicine, MB is used to treat fungal, bacterial, and parasitic diseases (Aureliano et al., 2018). However, when discharged into the environment, MB can decompose to produce toxic gases such as SO2, Cl2, CO, NO, H2S, and CO2. Therefore, MB needs to be treated before being released into the environment. Some methods to remove MB from wastewater include adsorption (Saini et al., 2023; Wazir et al., 2023), coagulation (Teixeira et al., 2022), membrane filtration (Zheng et al., 2009), biological, chemical and electrochemical oxidation (Dutta et al., 2001), photocatalytic degradation (Rauf and Ashraf, 2009; Wang et al., 2024c), and so on. Among them, adsorption has been considered one of the most effective methods for the removal of pollutants in wastewater thanks to its environmental friendliness, low cost, and high efficiency (Jawad et al., 2021a, 2022, 2021b).
Metal-organic frameworks (MOFs) are a special class of materials composed of metal clusters or metal ions and organic molecules. MOFs typically have a 3D structure with a large open network layer of voids and channels. Due to their special properties such as charge transfer, luminescence, thermal stability, and signal transmission, MOFs are often applied in separation, adsorption and storage of gases such as CO2, H2, and CH4 (Jia et al., 2022); as well as in chemical sensing (Shen et al., 2022); drug delivery (Mhettar et al., 2024); catalysis (Shan et al., 2023); etc. Additionally, the application of MOFs as adsorbents for environmental treatment is one of the most interesting applications (Li et al., 2023). The MOF-based adsorbents exhibited superior characteristics in the field of adsorption compared to the conventional ones, which is thanks to their large specific surface areas, high porosity, abundance of well-exposed active sites, good water, and chemical stability (Liu et al., 2023).
Polyethylene terephthalate (PET, PETE) is among one of the most commonly used thermoplastic polymers in the market thanks to its lightweight, transparency, high thermal resistance, moisture resistance, mechanical durability, and porous surface. Consequently, PET is the third most prevalent plastic in the packaging industry, and with increasing demand, accounting for 7.7% of the European market (∼ 4 million tons) (Du et al., 2011). As a result, the quantity of PET released into the environment is substantial. However, currently only about 20% of PET is recycled (Ahadi et al., 2022). Untreated PET waste being released into the environment causes harmful effects on the health of living organisms: ingesting PET leads to death and ecological imbalance; PET also breaks down into microplastic fragments; incineration of PET produces toxic substances such as furans and dioxins, causing poisoning and potentially leading to cancer; landfilling PET alters soil structure, preventing soil from retaining nutrients and water, and impeding oxygen penetration (Nizzetto et al., 2016); PET in water pollutes water sources and leads to the death of many beneficial microorganisms (Bach et al., 2012). Improper treatment and indiscriminate disposal of PET cause serious consequences for the living environment, therefore it is vital to find effective methods to process the PET wastes. Until now, various researches have been conducted for the upcycling of waste PET plastics, including re-extrusion, mechanical recycling, chemical recycling and energy recovery (Raheem et al., 2019). Among these methods, chemical recycling was preferred because it can convert PET plastic into high-value chemical raw materials such as terephthalic acid (TPA) and ethylene glycol (EG) (Barredo et al., 2023; Bool et al., 2022; Chinglenthoiba et al., 2024; Teke et al., 2024), or can be converted directly to MOF or MOF-based materials (Wang et al., 2024a; Wang et al., 2023, 2024b). The production of MOFs using waste PET plastics as precursors instead of the conventional small chemical precursors is now considered a more scalable, cost-effective, and sustainable “Waste to MOFs” strategy (Li et al., 2024). Most of the preparation strategies for MOF synthesis using waste PET plastics are based on the ex situ utilization of TPA from the depolymerization of PET (Barnard et al., 2021), where the TPA was obtained with high purity. However, this process often requires the use of strong acid or alkali as well as harsh conditions of high temperature and pressure, resulted in both economic and environmental issues. On the contrary, the in situ method combines the depolymerization of PET and the synthesis of MOF, which can be employed with less operational steps, lower energy consumption and without the remaining acid or alkali solvents (Li et al., 2024).
One-pot in situ preparation of various MOFs from waste PET bottles was developed via hydrothermal process, but they suffered from the use of toxic acids such as hydrochloric acid (HCl), nitric acid (HNO3) or hydrofluoric acid (Lo et al., 2016; Vo et al., 2019), or harmful solvents, such as N,N’-dimethyl formamide (Kalimuthu et al., 2022; Zhou et al., 2019) or N,N’-diethyl formamide (Al-Enizi et al., 2020). Until now, only MIL-53(Al) can be prepared directly from waste PET plastics via hydrothermal process in water (Karam et al., 2021; Lo et al., 2016), with the maximum PET conversion and MIL-53(Al) yield of ∼55% and ∼ 42%, respectively (Lo et al., 2016). In this manner, this study aims to carry out the one-pot conversion of PET to TPA and MIL-53(Al), which was then applied to MB adsorption. The synthesized material was analyzed by X-ray diffraction (XRD), Fourier-transform infrared spectroscopy (FTIR), scanning electron microscopy (SEM), and Brunauer-Emmett-Teller (BET) to determine the properties and surface morphology of the material. Subsequently, an optimization process was performed to determine the optimal MB adsorption capability and establish the relationship of different factors affecting the adsorption capacity of the material during the material synthesis process.
Experimental
Chemicals and reagents
The PET source was from the plastic bottle waste collected around Thu Duc City. Al2(SO4)3.18H2O, HCl, and MB were purchased from Xilong (China), and dimethylformamide (DMF) was purchased from Chemsol (Vietnam). The chemicals were used without any further purification.
Experimental
MOF synthesis by hydrothermal method
PET bottles were collected and the labels were removed, then the PET bottles were washed clean with water and detergent, cut into pieces of 2 cm × 2 cm and dried at 50°C. The process of converting PET plastics to MOF materials was conducted using a hydrothermal hydrolysis method. A mixture of PET plastics and Al2(SO4)3.18H2O (1:2 molar ratio) was put into a hydrothermal autoclave, mixed well with 2–6 L of water and the hydrothermal process was conducted at 160−200°C for 24 h. Detailed preparation conditions are presented in Supplementary Table S1. The system was then cooled to room temperature for 12 h. The formed solid material adhered to the wall and bottom of the autoclave vessel, which was collected, washed and activated with DMF three times for one day to remove unreacted TPA and metal salts trapped in the sample pores. Finally, the solid MOF material was separated by centrifugation, washed with ethanol two times for one day, dried overnight at 150°C, then collected and stored in the zip bags (Ahadi et al., 2022; Moran et al., 2018). The residual solution in the autoclave was collected and dried to recover the aluminum salt Al2(SO4)3; the incompletely hydrolyzed PET plastic was washed clean, dried, and sieved to 0.15 mm to remove salt adhering to the surface and weighed.
MB dye adsorption process
MB solution of 100 mL with a concentration of 100 mg/L was used as a simulated MB-containing wastewater. The simulated solution was adjusted to pH 5 using 1 M HCl. The material dosage used for 100 mL of simulated solution was 2 g/L. The reaction system was placed in a shaker, which was adjusted to 150 rpm. The total survey time was 240 min. Reaction solution of 0.1 mL were taken at different time intervals of 0–5–10–15–30–60–90–120–150–180–210–240 min, diluted to 2 mL, and filtered through a 0.45 µm filter. Full range measurement was performed using a ultraviolet-visible spectroscopy absorption spectrophotometer, then the remaining MB concentration was determined based on the MB calibration curve.
Material characterization
XRD patterns of the materials were measured using a D8 Advance diffractometer with Cu-Kα radiation (λ = 1.54056 Å). FTIR spectra were obtained using a Cary 630 spectrometer in ATR mode. SEM images of the material were captured using a JEOL-JSM-IT500 scanning electron microscope at various magnifications. The surface area of the material was determined through BET analysis.
Calculation of parameters
PET processing efficiency-H1 (Lovell, 1993):
PET to MOF conversion efficiency-H2 (Lovell, 1993):
Where:
MB adsorption capacity-Qe (Deng and Bai, 2004):
Optimization of experimental parameters
Response surface methodology (RSM) (Soleimani et al., 2023) was used to optimize the conditions for PET processing efficiency (H1), PET to MOF conversion efficiency (H2) and MB adsorption capacity of the material (Qe) through the Box-Behnken design with independent variables including temperature (X1−°C), solvent volume (X2−L), material/solvent ratio (X3−g/mL). Design Expert 13 software was used to model the experiment and experimental results according to the model, thereby constructing predictive regression equations and optimization models of independent variables at which H1, H2, and Qe are highest. Correlation coefficients were established based on the analysis of variance (ANOVA) method to determine the factors affecting the objective function and demonstrate the suitability of the model with the experiment.
Results and Discussion
Digital photographs of the samples (Supplementary Fig. S1) show that at 160°C and 170°C, the PET plastics after hydrolysis still retained its original shape, with no conversion occurring. At higher temperatures of 180°C, 190°C, and 200°C, PET was hydrolyzed and could produce TPA, which then combined with Al2(SO4)3.18H2O catalyst to form the metal-organic framework material. It is generally known that the hydrolysis of PET plastic into TPA is highly dependent on temperature and pressure. At lower temperatures (160−170°C), PET plastic retained its original shape, which may be because of insufficient energy to overcome the activation barrier for hydrolysis. However, at higher temperatures (180−200°C), the increased thermal energy and saturated vapor pressure facilitated the depolymerization of PET into TPA and EG. This process occurs at the solid−liquid interface, where the heterogeneous hydrolysis reaction is accelerated by the high temperature and pressure, breaking the ester bonds in PET structure. The TPA produced then reacts with Al3+ ions to form the MIL-53(Al) framework. Therefore, the temperature condition of 180−200°C was selected for the experiments and optimization model in this study.
Optimization of PET processing efficiency
The experimental results (Fig. 1E) show that at a temperature of 200°C, solvent volume of 2L with a PET processing efficiency of 71.28% is the optimal condition for processing PET plastics. The 3D response surface plots were constructed with the variables of X1 ranging from 180°C to 200°C, X2 ranging from 2 to 6 L, and X3 ranging from 1:5 to 1:12.5–1:20 g/mL. The PET processing efficiency gradually increased with temperature (Fig. 1A and B), but decreased with increasing solvent volume (Fig. 1A and C). Changing the material/solvent ratio from 1:5–1:20 slightly increased the processing efficiency (Fig. 1B and C). H1 represents the efficiency of hydrolyzing PET plastics into TPA under specific experimental conditions. It quantifies the percentage of PET plastic successfully processed into its monomeric form, which is a critical step in the synthesis of MIL-53(Al). The predictive regression equation and optimization model of the three independent variables at which the PET processing efficiency is highest were obtained (Supplementary Table S2). The actual regression equation with the main factors affecting the H1 function (p < 0.05) is determined as follows:

Response surface of
The R2 value of PET processing efficiency is 0.9747 (>0.8), indicating that the model fits well with the experimental results (Supplementary Table S2). Additionally, the adjusted R2 of the model is high (Adj R2 = 0.9432), indicating high accuracy under actual conditions. The coefficient of variation (CV) of PET processing efficiency is 8.51% (<10%), demonstrating that the response model has high accuracy and reliability of the test process. Thus, the above model satisfies a model with high experimental and application validity according to Cui et al. (Khamanga and Walker, 2011).
The RSM results showed that PET processing efficiency increased with temperature but decreased with solvent volume. This can be explained by the fact that higher temperatures provide sufficient energy for the hydrolysis reaction, while excessive solvent volume dilutes the reactants, reducing the reaction rate. Additionally, the material/solvent ratio played a significant role, as a higher ratio ensures a higher concentration of PET in the reaction medium, promoting efficient hydrolysis.
Optimization of PET to MOF conversion efficiency
The results of the conversion efficiency from PET plastic to MOFs are shown in Figure 2E. The high conversion efficiency to material for materials 1, 2, 3, 4, 5, 6, 7, 9, 10 is explained by the fact that when hydrolyzed at high temperature, high saturated vapor pressure helps accelerate the progress of the heterogeneous hydrolysis process occurring at the solid−liquid interface, helping to depolymerize the chemical chain of PET into TPA (H2DBC) and EG (Alsuhybani et al., 2020). From there, TPA with two hydroxyethyl groups at both ends will combine with Al3+ metal ions in Al2(SO4)3 to form the metal-organic framework material MIL-53(Al). The remaining materials were hydrothermally treated at lower temperatures and pressures, so the progress of depolymerization of PET and conversion to material will be reduced, thus leading to poor conversion efficiency of PET to MOF materials. The conversion efficiency from PET to MOF material under different conditions varied from 9.15% to 95.02% and the highest PET to material conversion efficiency was achieved for VL4 (Fig. 2E). H2 represents the efficiency of converting PET-derived TPA into the MIL-53(Al) metal-organic framework. It reflects the percentage of PET plastic successfully transformed into the final MOF material. The second-order polynomial equation predicting H2 is obtained (Supplementary Table S3). Based on the ANOVA results, the actual regression equation determined for the conversion process from PET plastic to MOFs after removing insignificant factors is:

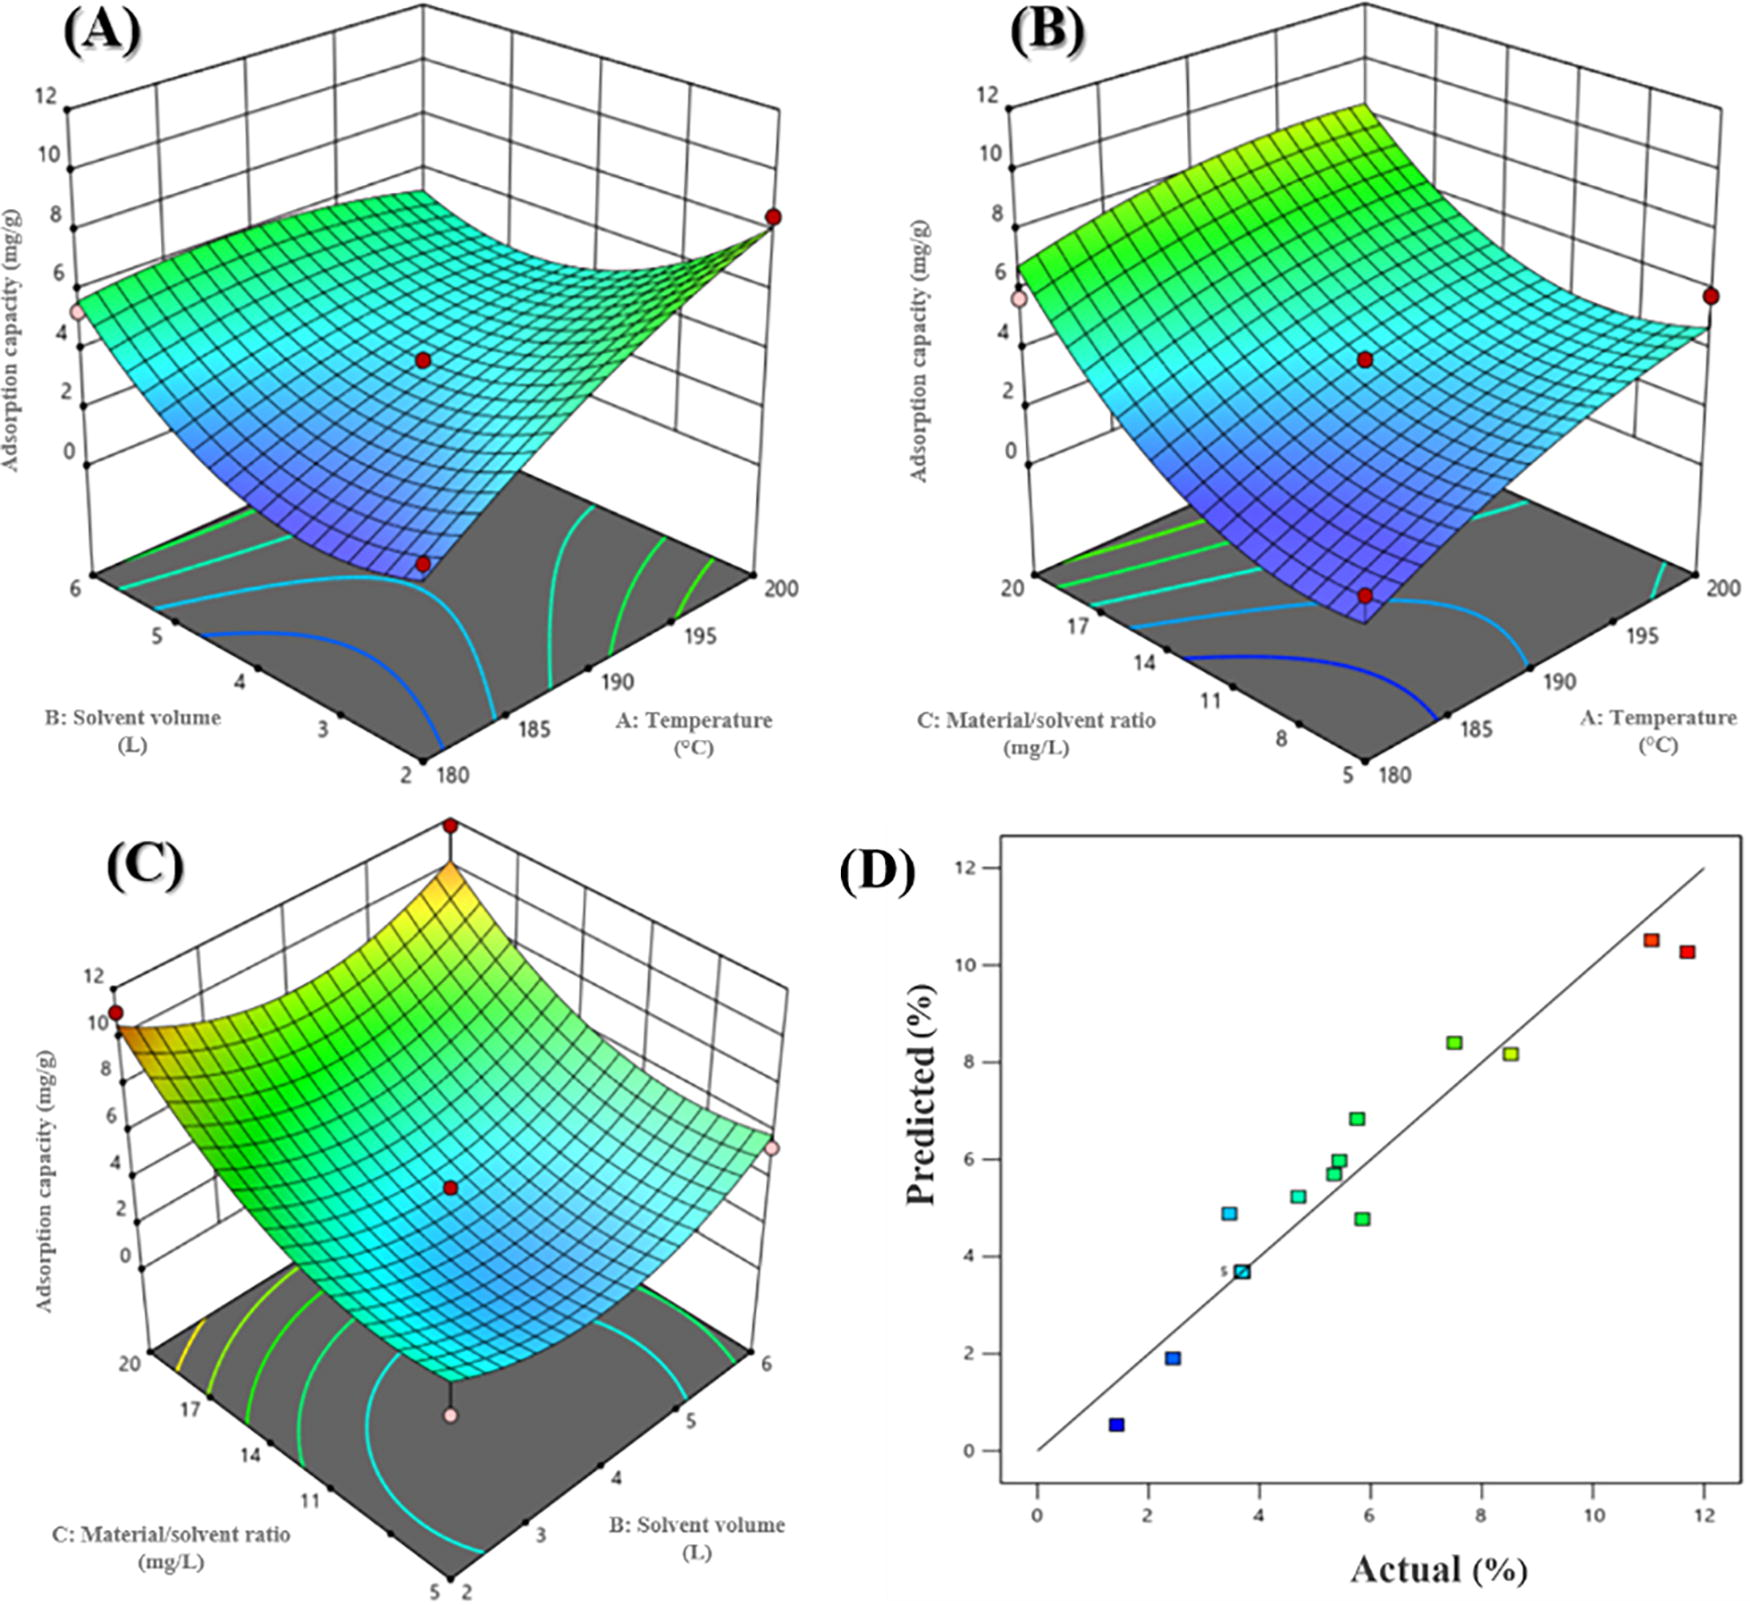
Response surface of
With an F value of 91.64 and p value <0.0001, this demonstrates that the obtained model has high statistical significance up to 99.99%. The criterion for evaluating the model’s fit with experimental results is the correlation coefficient (R2), with a multivariate regression model performed according to the RSM method considered good when R2 is at least 0.8. The correlation coefficient R2 value of H2 is 0.9916 (Supplementary Table S3), indicating that the model fits the experimental results up to 99.16%. In parallel, the CV of H1 is 5.73% (<10%), showing that the response model has high accuracy and reliability of the test process. The deviation between actual and predicted values is equivalent as shown in Figure 2D and the Adj R2 coefficient = 0.9808 shown in Supplementary Table S3, indicating that the experimental results of the model in practice have a high degree of accuracy and reliability. The response surface plots (Fig. 2A−C) show the general trend of all experiments having interaction with each other. The PET to MOF conversion efficiency increases when the temperature value increases from 180°C to 190°C and decreases when the temperature increases from 190°C to 200°C (Fig. 2A and B). Based on Figure 2B and C, it can be seen that H2 is highest when the volume is 2L and gradually decreases to 6 L. The value of the material/solvent ratio increases to a fixed level at the center point of 1:12.5 g/mL, then gradually decreases. In conclusion, based on the results obtained, the highest efficiency (99.2%) was achieved at 198°C, a solvent volume of 5.5L, and a material/solvent ratio of 19.6 g/mL. The conversion efficiency from PET to MOF material was influenced by temperature, solvent volume, and material/solvent ratio. At 198°C, the high vapor pressure and thermal energy enhanced the depolymerization of PET and the subsequent reaction of TPA with Al3+ ions. However, at higher temperatures, the conversion efficiency decreased, likely due to the degradation of TPA or the formation of by-products under extreme conditions. Similarly, an optimal solvent volume and material/solvent ratio ensured sufficient reactant concentration and interaction, while excessive solvent volume or low material/solvent ratios diluted the reactants, thus reducing the efficiency.
Characteristics of synthesized material
The XRD analysis results in Figure 3 show that, in all of the preparation conditions, there are the peaks at 24.8°, 26.28°, and 29.16°, which are characteristic of aluminum salt Al2(SO4)3 (China et al., 2019; Liu et al., 2022; Matori et al., 2012). Al2(SO4)3 is a crystalline aluminum salt used as a catalyst for the synthesis of MIL-53(Al) material, but the presence of aluminum salt in the analysis results shows that the initial amount of aluminum salt still existed in the product mixture. Other than that, in all of the preparation conditions, there are similar diffraction peaks at 8.76°, 10.14°, 17.5°, and 24.52°, which are consistent with reported peaks (Liu et al., 2019; Moran et al., 2018; Rahmani and Rahmani, 2018; Rallapalli et al., 2010; Yan et al., 2015) and the standard XRD spectrum of MIL-53(Al) from the CCDC220475 database. This proves that the MIL-53(Al) structure has been prepared well.
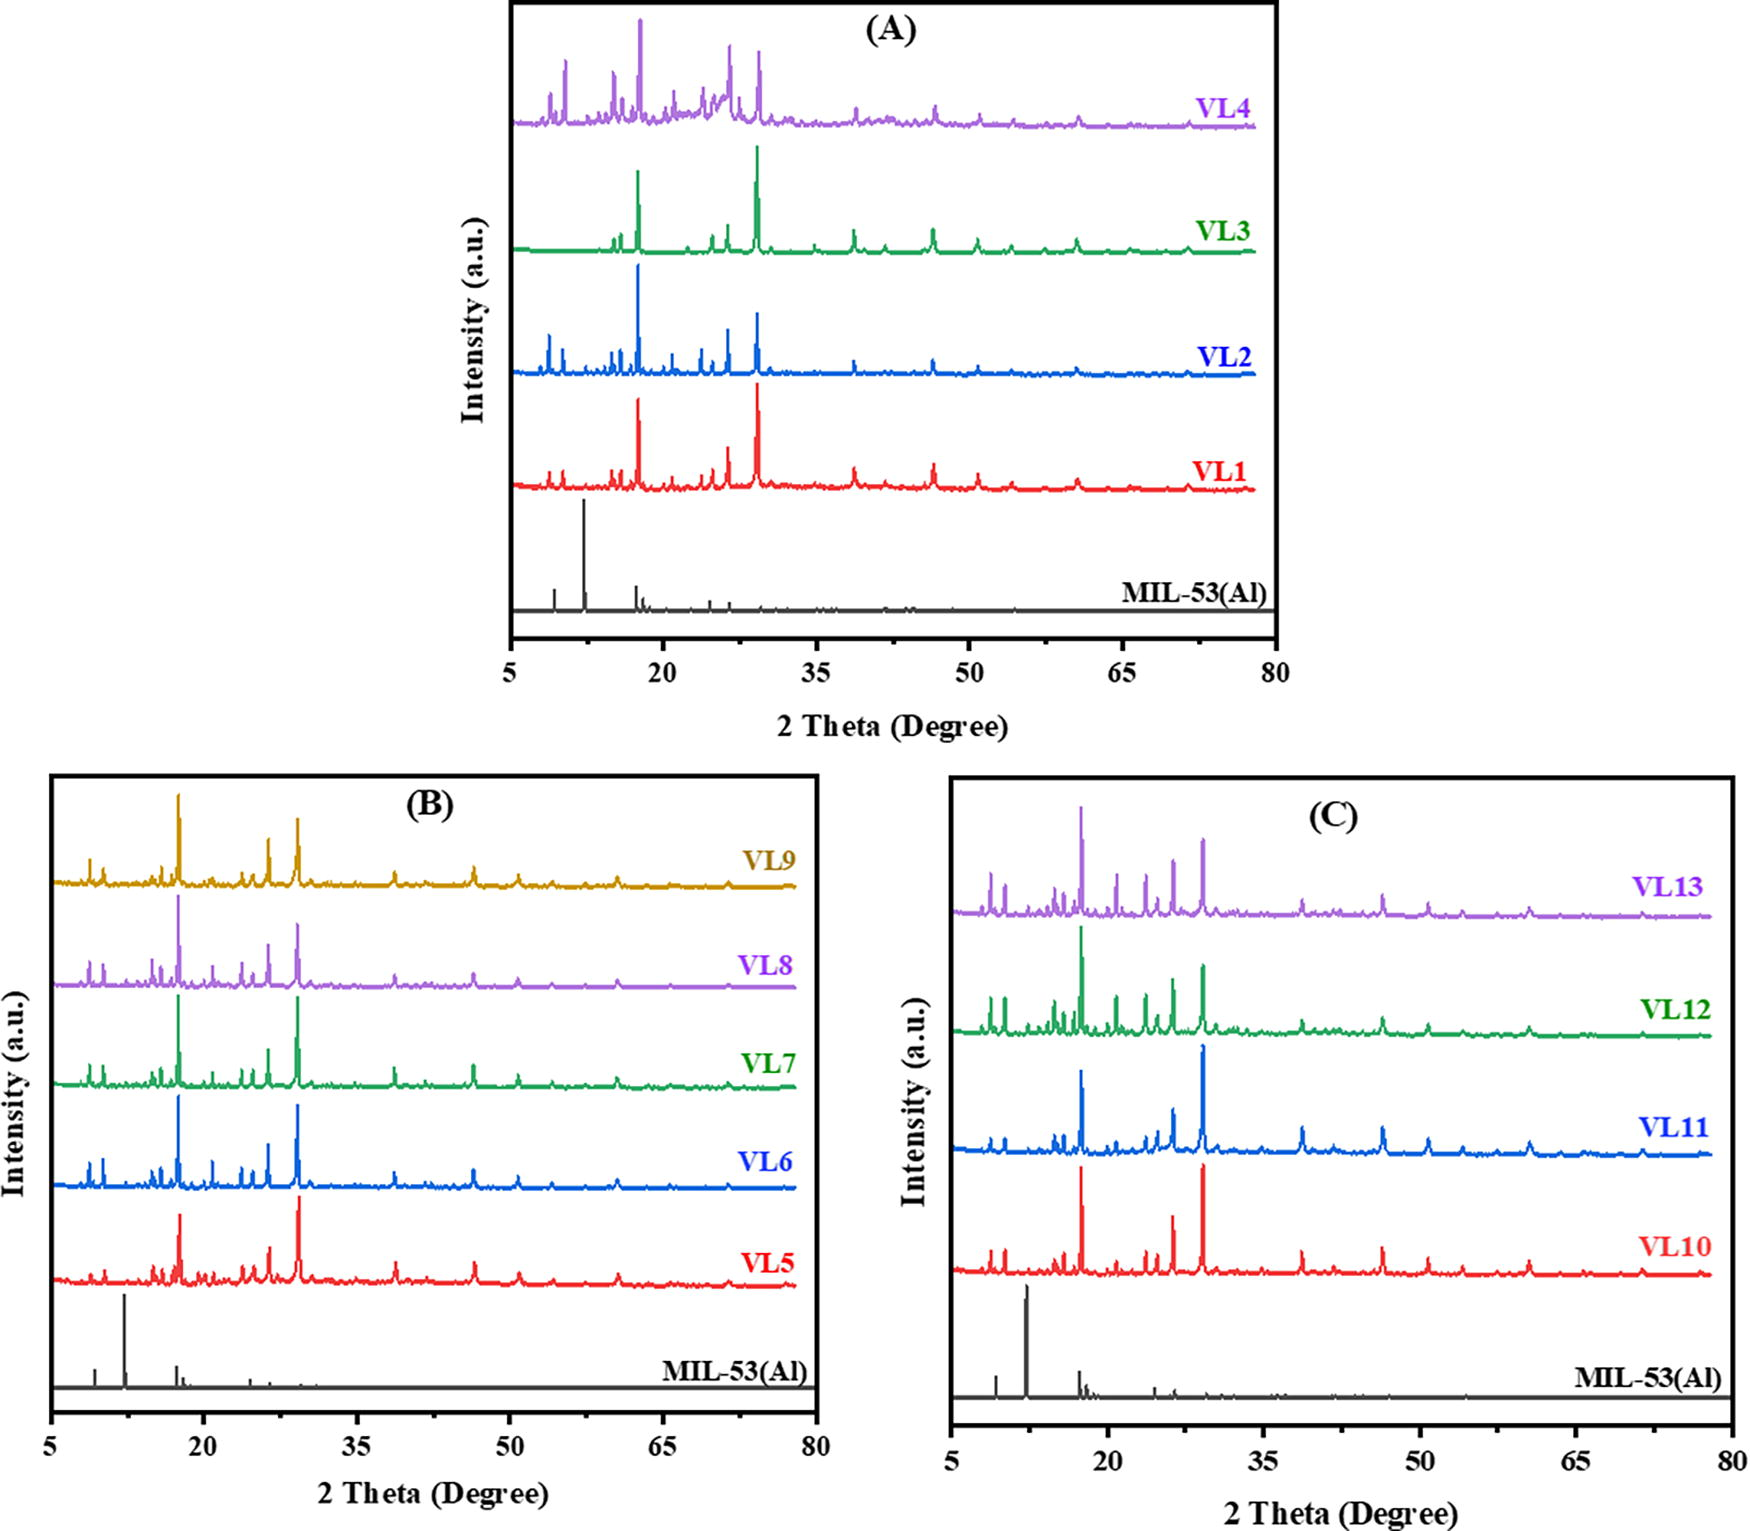
XRD analysis results of materials at ratios of 1:20
Figure 4 shows the FTIR spectra of the materials, showing a characteristic 3473 cm−1 peak of the O-H group due to water adsorbed into the material (Huang et al., 2014). The absorption band at 1424 cm−1 represents the vibration of C≡C and C=C groups on the extended aromatic ring or C=O bond in the PET structure (Calvete et al., 2010). The absorption peak at 1072 cm−1 is attributed to the C–O–C group (Bertagnolli and Silva, 2012; Huang et al., 2014). The absorption peak at 766 cm−1 is assigned to the elongated vibrations of S-O in the sulfonic group. Through FTIR results, the materials synthesized under 13 different conditions are similar to each other with the peaks corresponding to the functional groups existing in the desired MOF structure, confirming that the preparation of the materials with appropriate structure has been successful.

FTIR spectra of materials under different PET conversion conditions. FTIR, Fourier-transform infrared spectroscopy; PET, polyethylene terephthalate.
SEM images of VL2 (Fig. 5A–D) reveal that the synthesized material exhibits crystal morphology with rough surfaces and agglomerated particles, suggesting the formation of a crystalline structure, which is consistent with the successful synthesis of MIL-53(Al). Besides, large bits of unreacted PET plastics were also observed, indicating incomplete hydrolysis of PET in this one-pot synthesis of MIL-53(Al). On the contrary, the crystals have a cubic shape, small size, rough surface at 1 µm magnification (Fig. 5A and B). The crystals are relatively uniform, with dense pores and voids of 5 µm (Fig. 5C and D). The rough surface and visible voids suggest the presence of pores, which are critical for adsorption applications (Sun et al., 2019). However, the gaps between the crystals are relatively small. This could limit the accessibility of adsorbates to deeper pores, which may later explain the moderate adsorption capacity observed for MB dye.

(
The N2 adsorption/desorption isotherm of VL2 are shown in Figure 5F, with the calculated BET and Langmuir surface area of 0.4463 m2/g and 1.5703 m2/g, respectively, indicating that the materials have a small surface area. MOF materials typically have a porous structure, so they can easily contain impurities in these pores. Therefore, the soaking, washing, and activation processes are important factors that affect the porosity of the material. In this work, as we try the green approach to synthesize MIL-53(Al) from waste PET, we also aim to avoid the use of toxic DMF in the preparation process as well as minimize its amount in the washing process, therefore the washing process may be a little ineffective. As a result, the incomplete washing and activation processes likely left residual aluminum salts—Al2(SO4)3— and other impurities within the pores of the material (Fig. 5E). This was confirmed by the XRD analysis, which detected unreacted precursors in the final product. These impurities can block the pores, reducing the accessible surface area for N2 adsorption, resulting in the limited surface area of the obtained material. This is consistent with the MB dye adsorption results that are not as high as previous studies by Ayoub Abdullah Alqadami et al. in 2018 (Alqadami et al., 2018).
From the MB adsorption capacity of different MOF materials in Table 1 and Supplementary Figure S2, it can be observed that VL1 and VL4 (at a ratio material/solvent ratio of 1:20) exhibited the best adsorption capability with the adsorption capacity values of 11.07 mg/g and 11.66 mg/g, respectively. At a ratio of 1:12.5, VL6 has an adsorption capacity of 8.521 mg/g, and for the ratio of 1:5 g/mL the adsorption capacity of the materials is all less than 6 mg/g, which means that the adsorption capacity of the materials at this ratio is not good. The reason for this difference is explained by the difference between the properties of the types of materials. The adsorption capacity of the synthesized MOF materials was influenced by their surface area, pore structure, and material/solvent ratio during synthesis. Materials synthesized at a material/solvent ratio of 1:20 exhibited the highest adsorption capacity, likely due to their larger specific surface area and more accessible pores. In contrast, materials synthesized at lower ratios (e.g., 1:5) had lower adsorption capacities, which can be attributed to their reduced porosity and smaller surface areas. The pores and cracks also create differences between the adsorption capacity values of the types of materials, as the larger the specific surface area, the higher the adsorption capacity (Malins et al., 2015).
Methylene Blue Adsorption Capacity of Synthesized Materials
The actual adsorption results in Table 1 show that the adsorption capacity varied from 1.428 to 11.7 mg/g. To optimize the MB dye adsorption capacity (Qe) of the materials, it is necessary to design the Box−Behnken experimental model of Design Expert 13 software and apply the RSM method based on three independent variable factors X1 (temperature), X2 (solvent volume), and X3 (material/solvent ratio) affecting the optimal model to calculate the adsorption capacity at that point is highest. The predicted second-order polynomial equation is obtained (Supplementary Table S4). From the ANOVA results (Supplementary Table S4), the actual second-order polynomial regression equation when removing insignificant factors affecting the Qe function is determined to be:
With an F value of 9.96 and p value = 0.0031 demonstrating that the obtained model has low statistical significance. The degree of fit of the model is evaluated through the correlation coefficient (R2), a good fit model is when R2 is at least 0.8. Supplementary Table S4 shows that the R2 value of MB dye adsorption capacity is 0.9276, meaning the model fits the experiment. The CV helps respond to the accuracy and reliability of the experimental process when less than 10%; however, the CV of the MB dye adsorption capacity model is 21.5% exceeding the allowable CV (<10%). In conclusion, the model has a Fisher value (p value = 0.0031) corresponding to the model’s fit with the experimental values of 99.69%. In addition, the correlation coefficient R2 = 0.9276 in Supplementary Table S4 helps accurately describe the experimental data compared to the prediction of 92.76%. However, the determination coefficient Adj R2 = 0.8344 shows the relatively low accuracy of the results when performed in practice only reaching 83.44%, showing a clear deviation of the experiments in Figure 6D and the CV = 21.5% (allowable level <10%). So the model implemented in practice has relatively low accuracy and low response (Larson, 2008). The optimal conditions for the adsorption process are temperature 199°C, solvent volume 2L and material/solvent ratio 1:19.8 g/mL, then the MB adsorption capacity can reach 12.16 mg/g.
Response surface of
Low MB adsorption capacity of the synthesized materials compared to other types of MIL-53(Al) adsorbents (Table 2) may be attributed to its relatively low surface area, which may be due to the unoptimized washing and activation processes that could either leave impurities in the pores or even block the pores. Our future work will focus on improving the washing and activation steps to enhance the material’s porosity as well as its adsorption performance.
Methylene Blue Adsorption Capacity of Different Adsorbents
DMF, dimethylformamide; PET, polyethylene terephthalate; TPA, terephthalic acid.
Conclusion
This study successfully synthesized the metal-organic framework material MIL-53(Al) by a simple one-step hydrothermal method with water as the solvent, using waste PET plastics. According to the optimization results performed by the RSM and ANOVA method, the highest PET processing efficiency reached 71.252% at a temperature of 200°C, solvent volume of 2 L and material/solvent ratio of 9.4 g/mL; the highest conversion efficiency from PET plastic to MOF material reached 99.2% when the experiment was performed at a temperature of 198°C, solvent volume of 5.5 L and material/solvent ratio of 19.6 g/mL. Although the synthesized MOF material had a low BET surface area of 0.4463 m2/g due to inefficient washing and activation process, the optimal MB adsorption capacity reached 12.16 mg/g. This opens up a potential direction in converting waste PET plastics into MOFs by a simple, inexpensive, convenient and environmentally friendly method, which can then be applied for many purposes such as adsorption of organic dyes.
Footnotes
Authors’ Contributions
H.L.N.: Writing—original draft, funding acquisition, methodology, investigation, data curation. T.T.L.: Investigation. V.D.C.: Investigation. H.K.A.N.: Data curation. N.T.N.: Visualization, and software. M.L.N.: Data curation, validation, and formal analysis. T.T.N.: Project administration, conceptualization, resources, supervision, and writing—reviewing and editing.
Author Disclosure Statement
No competing financial interests exist.
Funding Information
This research is funded by Nguyen Tat Thanh University, Ho Chi Minh City, Vietnam through project code 2024.01.110/HĐ-KHCN.
References
Supplementary Material
Please find the following supplemental material available below.
For Open Access articles published under a Creative Commons License, all supplemental material carries the same license as the article it is associated with.
For non-Open Access articles published, all supplemental material carries a non-exclusive license, and permission requests for re-use of supplemental material or any part of supplemental material shall be sent directly to the copyright owner as specified in the copyright notice associated with the article.