
Abstract
This study aims to prepare a ternary nanocomposite Ag/ZnO/g-C3N4 (A/ZCN) by physical mixing and calcination in one step to enhance the decomposition of methylene blue (MB) in an aqueous solution. The as-prepared A/ZCN composite has a well-organized structure. The composite is arranged in clusters of 3–4 particles with a size of about 20.2 nm similar to soap bubbles. The A/ZCN sample exhibits better visible light absorption performance than ZnO. The A/ZCN nanocomposite effectively utilizes the advantages of ZnO and g-CN as well as the Surface plasmon resonance effect of Ag to degrade MB. The mechanism of photocatalytic degradation of MB on the composite by radicals was proposed and the effects of reaction factors on MB degradation were comprehensively studied. Under the optimal conditions (A/ZCN of 0.5 g/L, MB of 10 mg/L, pH of 6.5, and temperature reaction 30°C), the reaction proceeds rapidly with a rate constant (kap) of 0.027 min−1 and the A/ZCN composite can degrade 94.0% of MB after 90 min of illumination under visible light while the direct degradation is almost invisible and in the absence of a catalyst is only below 5%. Under UV irradiation, the MB decomposition efficiency reached 95.7% with a kap of 0.033 min−1. The reusability of the catalyst remained at approximately 66.4% after four cycles. The performance of the A/ZCN nanocomposite was also evaluated by the degradation of recalcitrant organic compounds, including antibiotics, volatile organic compounds, and organic dyes. In addition, it also exhibited superior performance compared with other catalysts reported in the literature. Overall, the A/ZCN nanocomposites synthesized by a simple calcination method demonstrated significant potential for the degradation of organic pollutants in wastewater treatment applications.
Introduction
The treatment of dyes is an urgent issue for scientists because of its serious impacts on the ecosystem and habitat of many aquatic species, animals, and humans. Dye pollution comes from various industries such as chemicals and cosmetics, of which textiles account for 60–70%. This is a major source of waste that is difficult to biodegrade. Dye pollution causes loss of esthetics, hinders photosynthesis, and reduces the amount of dissolved oxygen in water (Nezamzadeh-Ejhieh and Moazzeni, 2013; Nezamzadeh-Ejhieh and Shams-Ghahfarokhi, 2013; Nezamzadeh-Ejhieh and Shahriari, 2014). Among them, methylene blue (MB), known as a cationic dye, belongs to the phenothiazine group, has a complex structure, and is poorly degradable when released into the environment. It can cause irritation and long-term health damage and increase the risk of poisoning if it accumulates in the environment or in the food chain and seriously affects the ecosystem (Mirsalari et al, 2022; Norouzi et al, 2021). Therefore, the development of methods to deal with dye pollution and proactively treat wastewater from textile dyeing factories is an unavoidable and imperative necessity.
The photocatalytic process for the degradation of organic compounds in wastewater has attracted the attention of scientists worldwide in recent years due to its cost-effectiveness, cleanliness, and convenience. It serves as a cost-effective alternative to other strategies for reducing water pollution such as Fenton reactions because the Fenton process produces large amounts of sludge containing iron oxides (Tatiya et al, 2023). The treatment and disposal of this sludge can cause environmental problems and additional treatment costs. Besides, separating the catalyst from the process is also very difficult. In addition, emerging methods such as piezocatalysis, which utilize mechanical stress to generate reactive species, have also shown promise with many advantages regarding sustainability and the ability to operate in dark environments (Ren et al, 2024; Yuan et al, 2024; Zhang et al, 2024). However, the development of highly efficient piezocatalytic materials, the mechanical energy requirement, and the novelty of the technology remain barriers that need to be overcome to compete with other traditional and advanced water treatment technologies. Therefore, in this study, photocatalysis was investigated for treating wastewater. Nowadays, photocatalysis has been widely studied in the processes of treating organic substances that are difficult to decompose, producing hydrogen as a clean energy source, and CO2 reduction (Chu et al, 2024). In this process, a semiconductor acts as a photocatalyst that can absorb light energy to generate electron–hole pairs. These can participate in oxidation–reduction processes and convert pollutants into end-products such as carbon dioxide and water (Koe et al, 2020; Wenderich and Mul, 2016).
ZnO and graphitic carbon nitride (g-CN) are n-type semiconductors that have garnered the great attention of scientists in heterogeneous photocatalysis due to their low cost, high stability, and mass transfer (Molinari et al, 2013; Alfano et al, 2000; Liang et al, 2012). In addition, g-CN consists of stacked layers of C3N4 linked together by a tertiary amine, which gives it high electrical conductivity (Li et al, 2014). However, g-CN has a small surface area and ZnO has a large band gap energy (3.37 eV), resulting in poor adsorption of sunlight (Choi et al, 2012). To improve the optical properties and overcome the shortcomings of these materials, doping with nonprecious metals (Al) (Wang et al, 2024), precious metals (Ayati et al, 2014; Pawinrat et al, 2009), or nonmetallic elements (B, N) (Liu et al, 2021; Nguyen and Vu, 2022) or a combination with other semiconductors was chosen (Nguyen and Vu, 2023b; BethelAnucha et al, 2021). However, the degradation of organic dyes has not yet achieved high efficiency under visible light and the photocatalytic mechanism remains unclear.
The significance of influencing factors such as initial pH, dye concentration, temperature of reaction, type of light irradiation, and catalyst dosage content cannot be underestimated in photocatalysis. The initial pH adjustment is a key factor in controlling the chemical properties of the environment, affecting both adsorption and catalytic reaction processes (Kazeminezhad and Sadollahkhani, 2016). Moreover, dye concentration also plays a crucial role in photocatalysis, where increasing concentration can enhance reaction efficiency but may also lead to undesired by-products (Farouq, 2018). Furthermore, the catalyst dosage is a determining factor in the feasibility of the process, as increasing the catalyst content can increase the chances of molecular contact and reaction rate. Therefore, understanding and controlling these factors are crucial in optimizing the efficiency of photocatalytic processes in water and environmental treatment applications (Wu and Chern, 2006). The type of dye to be degraded is also a factor to consider, as each dye has different chemical properties, requiring tailored photocatalytic processes to ensure the highest degradation efficiency (DE) and minimize the dispersion of pollutants in the surrounding environment (Thi and Vu, 2022). A thorough understanding and careful control of these factors are essential to optimize photocatalytic processes and ensure effective water and environmental treatment.
To utilize the existing advantages and mitigate the disadvantages of g-C3N4 and ZnO, while improving the distinctive properties of plasmonic photocatalysts, this study focused on the synthesis of a ternary composite (A/ZCN) by a simple combustion method. The catalytic activity of the composite was assessed by degrading MB in water under visible light irradiation. The effects of catalyst dosage, MB concentration, temperature reaction, type of light irradiation, and initial solution pH on the degradation of MB were comprehensively investigated. Remarkably, while the group’s earlier work primarily focused on material synthesis to optimize the calcination process for enhancing photocatalytic efficiency (Nguyen et al, 2024), this study broadened the scope by investigating the MB treatment process. It explores optimal reaction parameters, assesses catalyst reusability, and evaluates the potential to treat other recalcitrant organic compounds, such as volatile organic compounds (VOCs) and antibiotics. This approach increases the relevance and applicability of the research to real environmental challenges.
Experimental
Material
Dyes (99.5%) were purchased from Sigma-Aldrich. Zinc nitrate hexahydrate (Zn(NO3)2·6H2O, 99.5%), hexamethylenetetramine-HMTA (C6H12N4, 99.5%), urea ((NH2)2CO, 99.5%), sodium citrate (Na3C6H5O7, 99.5%), isopropyl alcohol (IPA, C3H8O, 99.5%), ascorbic acid (AA, C6H8O6, 99.5%), ethylenediaminetetraacetic acid (EDTA, C10H16N2O8, 99.5%), silver nitrate (AgNO3, 99.5%), tetracycline hydrochloride (TCH, C22H24N2O8), phenol (C6H6O), bisphenol A (BPA, C15H16O2), and p-nitrophenol (p-NP, C6H5NO3,) were obtained from Merck.
Synthesis of A/ZCN composite
The facial precipitation method (Nguyen Thi and Vu, 2022) was used to prepare nano ZnO and g-CN. In an agate mortar, 0.9000 g of urea was added and crushed. Subsequently, 0.0255 g AgNO3 and 0.4050 g ZnO were added to the mortar, mixed thoroughly, and ground for exactly 20 min. The powder was then transferred to a 100 mL crucible, wrapped with aluminum paper on top, and tightly covered. This crucible was placed in a Nabertherm furnace (Germany), the temperature was raised to 500°C at a rate of 30°C/min and remained for 15 h. Finally, the powder was finely ground again to obtain the A/ZCN composite.
Photocatalytic experiment
The experiments were carried out under irradiation with visible light (250 W Hg lamp with a light source intensity of 16,000 lux), and the distance between the lamp and the surface of the solution was 10 cm. The reaction cup contained 50 mg of the sample and 100 mL of a 10 mg/L MB solution. Before irradiation, the mixture was stirred in the dark for 30 min to achieve adsorption–desorption equilibrium. The reaction solution was withdrawn and filtered using a syringe filter (Advantec CS020AS 0.20 µm cellulose acetate membrane), and the concentration of organic matter was analyzed using a spectrophotometer (Agilent 8453) at 663 nm. The DE, the degradation capacity (DC), and the rate constant of the dye were calculated according to the following equations.
The pHpzc value was determined using the pH drift method (Nguyen and Vu, 2023a). Initially, a 250 mL beaker containing 100 mL of MB solution with an initial concentration of 10 ppm was adjusted to pH values between 4 and 12, referred to pHinitial. Subsequently, 0.05 g of A/ZCN material was accurately added to the solution, stirred thoroughly, and kept in the dark for 24 h, giving the final pH value. The pHpzc value obtained is the intersection of the pHinitial and pHfinal curves.
Characterization method
The crystalline phase of the samples was analyzed by X-ray powder diffraction (Bruker D8 Ax, Germany). The X-ray Diffraction (XRD) patterns were obtained with Cu-Kα irradiation (40 kV and 40 mA) at 2θ ranging from 10° to 80°. The morphology and size of the samples were investigated by field emission scanning electron microscopy (SEM, JEOL-7600F) and transmission electron microscopy (TEM, JEM-JEOL 2100). The chemical composition of the composite was determined by energy dispersive spectrometry (EDS: JEOL-7600F). Infrared spectroscopy (FT-IR) was used to determine the functional groups along with the characteristic functional groups. UV-Vis diffuse reflectance spectroscopy (DRS) was used to determine the light absorption and band gap energies of the materials. Photoluminescence (PL) was used to determine the charge carrier separation efficiency of the catalyst.
Results and Discussion
Characterization of the catalyst
The XRD of the samples in Fig. 1a shows the presence of two peaks at 2θ of 13.0° and 27.6° in the g-CN sample, corresponding to the (100) and (002) lattice planes of the g-CN crystal (JCPDS No. 87-1526) [19]. The prominent peak at 27.6° is the signal of the alternating aromatic layers for the graphitic material. The d-spacing of the lattice planes (dhkl) can be determined using Bragg’s formula (De Graef and McHenry, 2012) as follows:
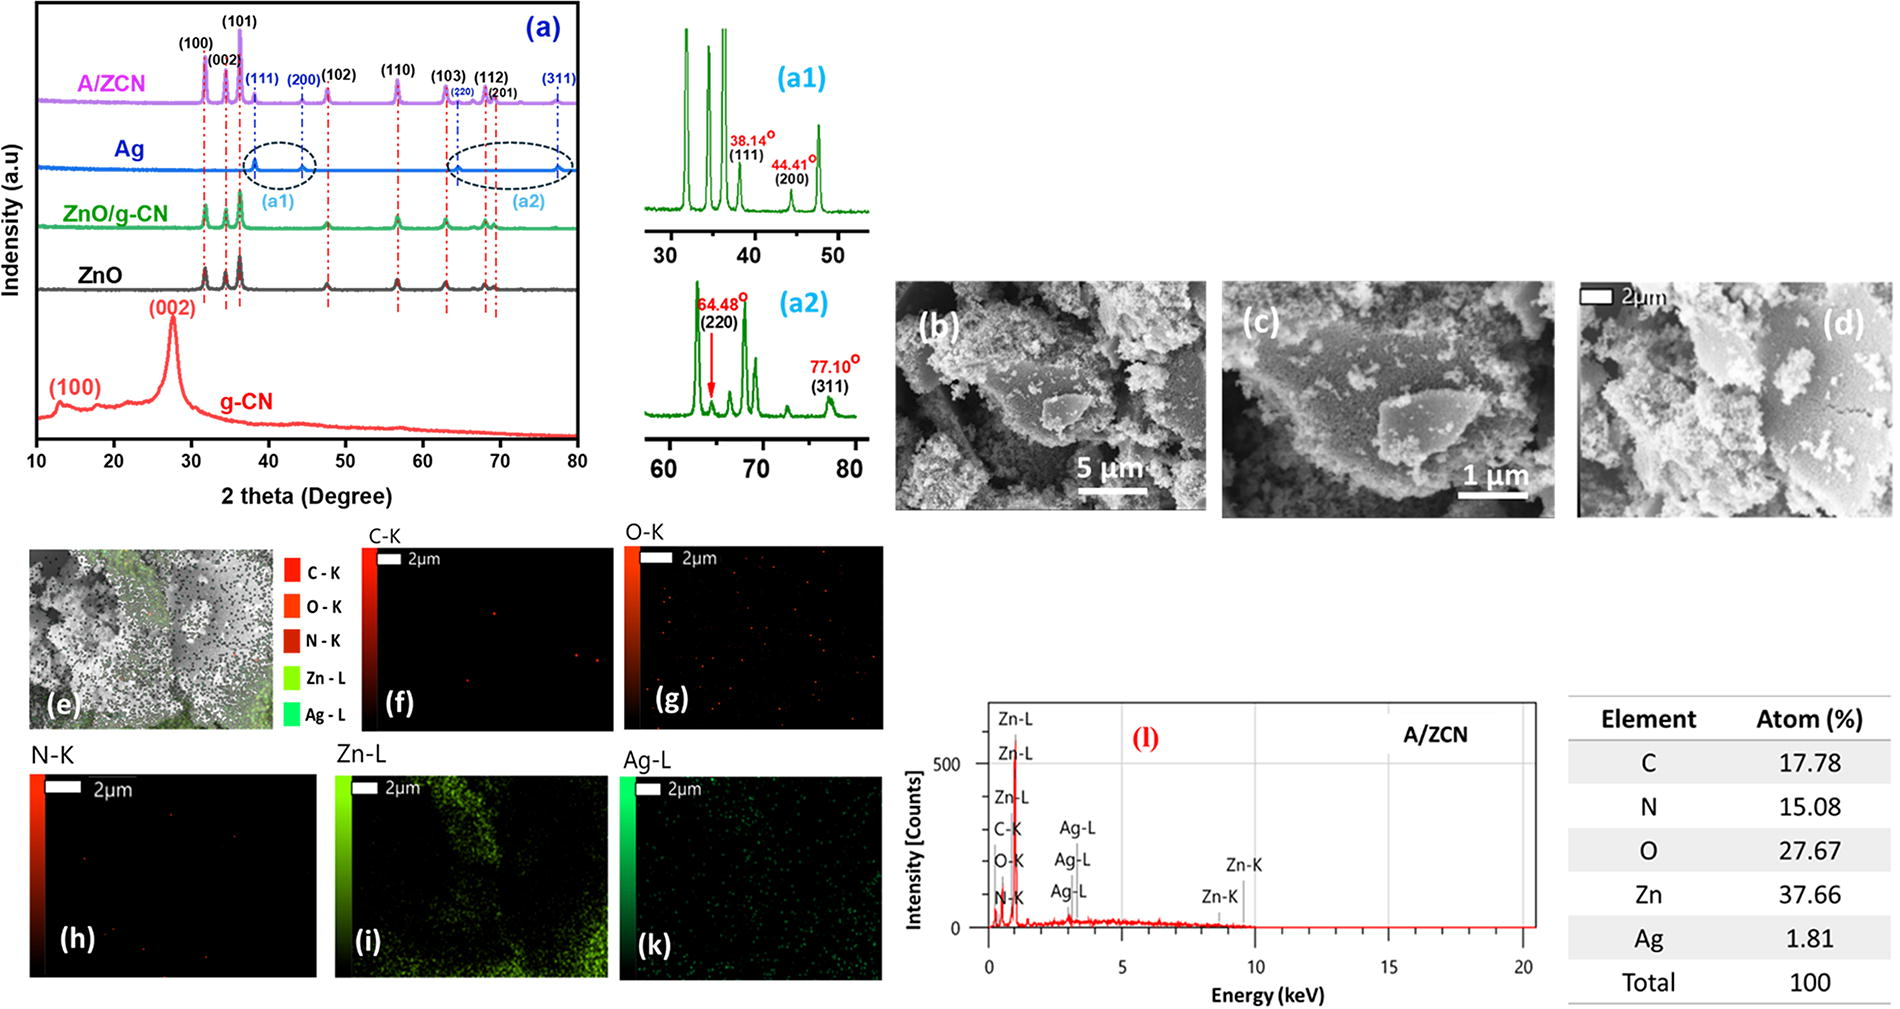
The typical hexagonal wurtzite crystal structure of ZnO is characterized by peaks in the lattice planes (100), (002), (101), (102), (110), (103), (200), (112), and (201) (JCPDS No. 36-1451). The presence of Ag is characterized by the lattice planes (111), (200), (220), and (311) (Fig. 1a). The characteristic peaks of Ag above were also fully expressed in the A/ZCN sample with higher intensity than nano Ag. For the ZnO/g-CN and A/ZCN samples, all characteristic peaks of ZnO are obvious, while the characteristic peaks of g-CN are not observed. The results may be because of g-CN agglomerates on the surface of ZnO. The signals of the characteristic lattice planes of ZnO and Ag overlap with those of g-CN, making it difficult for the X-ray diffractometer to recognize the composition of g-CN.
The crystalline size (D) of the samples can be determined using the Scherrer formula (Pham et al, 2020) and Williamson-Hall equation (Yousefi and Nezamzadeh-Ejhieh, 2024):
Crystallite Size of the Samples
A/ZCN, Ag/ZnO/g-C3N4.
The SEM images in Fig. 1b–d show the bulk aggregation of the nanoparticles, accompanied by the appearance of small pores between them. The A/ZCN nanoparticles of uniform size coalesce into large blocks. However, Fig. 1e–k shows a good dispersion of C, O, N, Zn, and Ag in the composite. The EDS spectrum (Fig. 1l) shows elemental contents of C, N, O, Zn, and Ag of 17.78, 15.08, 27.67, 37.66, and 1.81 wt.%, respectively. In addition, the TEM result in Fig. 2a–d shows that the A/ZCN composite consists of spherical particles with a uniform size (20–30 nm). Neighboring particles can touch each other and form small clusters of 3–4 particles resembling soap bubbles. The small and uniform size and the ordered arrangement are likely factors contributing to the high photocatalytic efficiency of the composite.
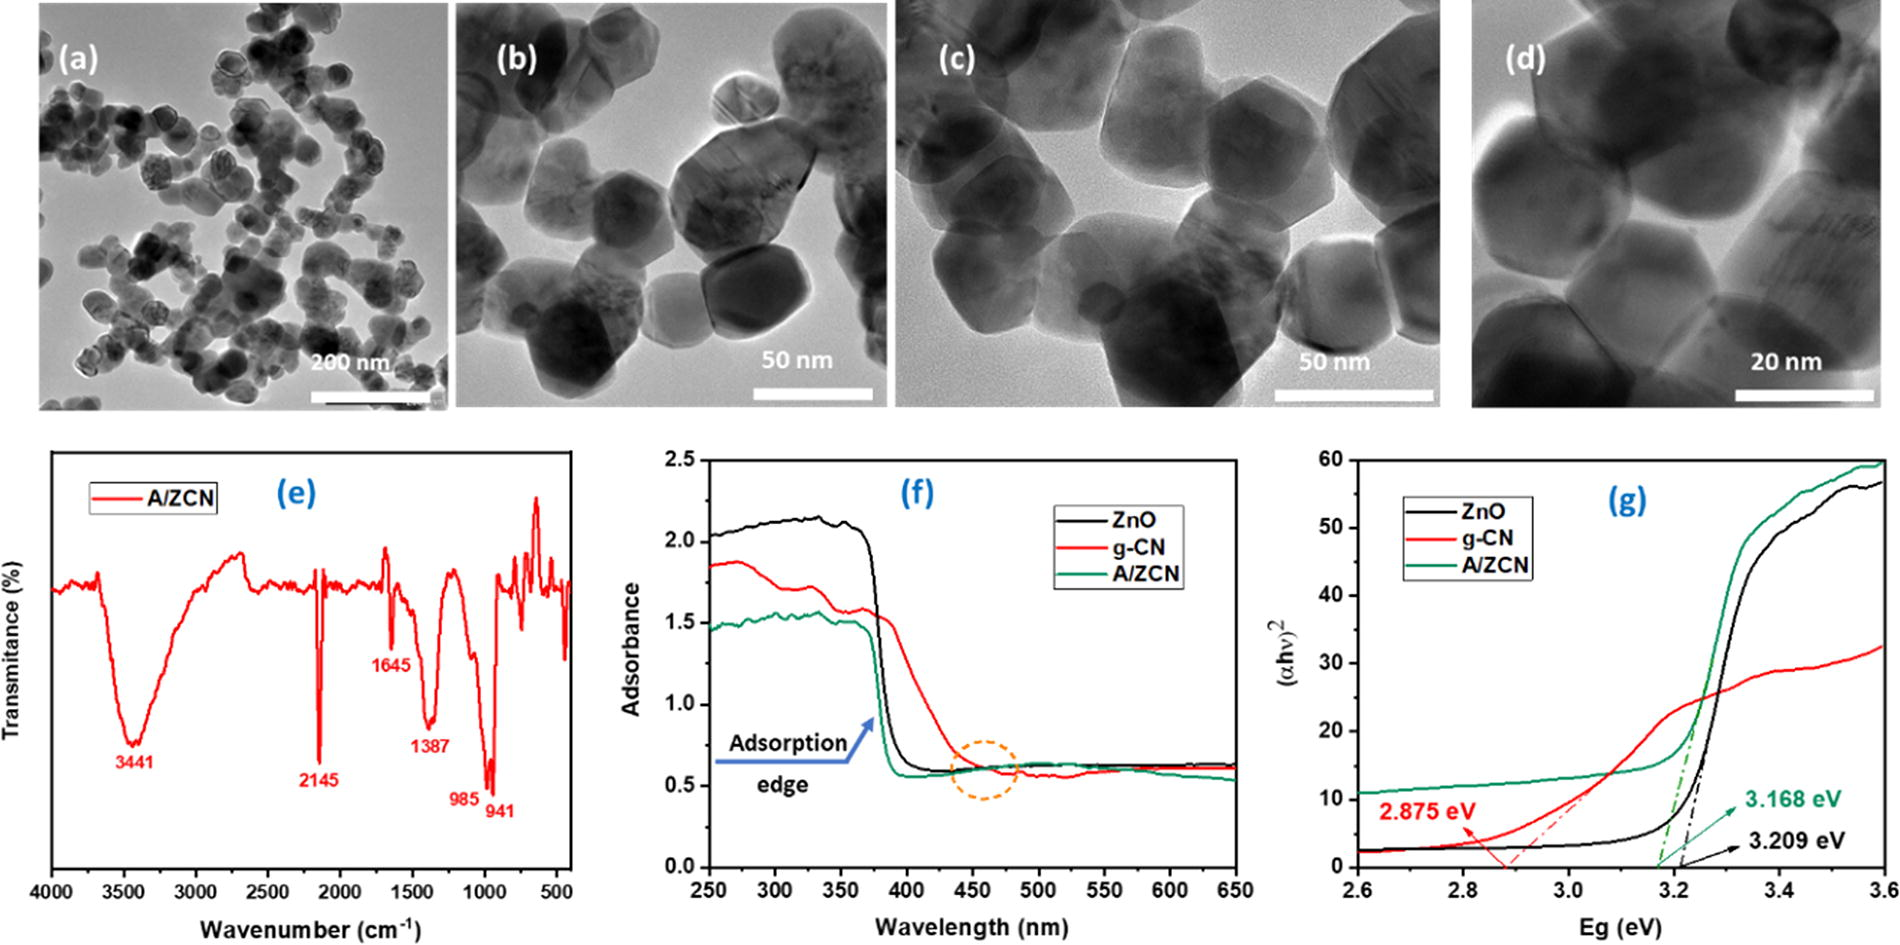
The FT-IR spectra of g-CN, ZnO, and ZnO/g-CN materials were analyzed and presented in Supplementary Fig. S1. For g-CN, a strong absorption band in the 1200–1650 cm−1 range is attributed to the stretching vibrations of -CN- rings. This band has a high resolution, reflecting a significant degree of the structural arrangement of these heterocycles. The band around 806 cm−1 corresponds to the out-of-plane bending vibrations of adjacent triazine or heptazine rings (Raeisi-Kheirabadi and Nezamzadeh-Ejhieh, 2020). In addition, the bands at 1202, 1225, and 1310 cm−1 are characteristic of the -C-NH-C- vibrations in melam. Absorptions in the N-H stretching region between 3242 and 3088 cm−1 indicate the presence of NH or NH2 groups, which are fundamental structural components (Ghattavi and Nezamzadeh-Ejhieh, 2020). For ZnO, a strong absorption peak at 3157 cm−1 is associated with the stretching vibrations of O-H from adsorbed H2O. Peaks at 1712 and 908 cm−1 in the high-frequency region correspond to the stretching vibrations of O-H bonds in Zn-OH. The strong absorption band at 567 cm−1 is linked to the stretching vibrations of Zn-O. The ZnO/g-CN composite shows similar spectral peaks to those of g-CN and ZnO, confirming the presence of both components, although the peak intensities are reduced. Notably, the broad absorption band of g-CN from 3242 to 3088 cm−1 shifts to lower wavenumbers in the presence of ZnO, indicating strong interfacial interactions between the components rather than merely a physical mixture. Similar to Fig. 2e, the A/ZCN sample also contains bands characteristic of the bonds of ZnO and g-CN. The absorption peaks having shifts such as the absorption band at 500–700 cm−1 indicates the stretching vibration of ZnO or the peaks at 941 and 985 cm−1 are the stretching vibration of O-H in Zn-OH. In addition, the vibrations corresponding to the C=N and C≡N bonds of g-CN are observed at 1645 and 2145 cm−1, respectively, indicating bonds between carbon and nitrogen in the heterocycle. Finally, a strong absorption peak at 3441 cm−1 can be attributed to the stretching vibration of the O-H bond in the adsorbed H2O (Noruozi and Nezamzadeh-Ejhieh, 2020).
In Fig. 2f, all samples strongly absorb light in the range of 300–500 nm. While g-CN exhibits relatively broad absorption edges, both the ZnO and A/ZCN samples show steep absorption edges in the range of 375–400 nm, which can be attributed to excitations from the valence band to the conduction band of the ZnO nanostructures. In addition, the A/ZCN sample exhibits a significant absorption peak in the visible light region, especially in the 500–525 nm (orange dashed circles). This absorption peak is mainly due to the surface plasmon resonance of silver and zinc oxide. Consequently, the A/ZCN sample demonstrates efficient light absorption in the visible light range compared with the other two samples. The Kubelka–Munk (K-M) equation and the Tauc plots were used to determine the optical bandgap energy of samples. The equation for the K-M model is as follows:
PL analysis was performed to evaluate the charge carrier separation efficiency of the catalysts. The PL spectra of ZnO, g-CN, ZnO/g-CN, and A/ZCN catalysts under 320 nm excitation are shown in Supplementary Fig. S2. ZnO exhibited weak emission peaks in the range of 400–550 nm and a shoulder peak at 560 nm, likely attributed to PL excitation caused by surface oxygen vacancies and defects in ZnO nanoparticles. In contrast, g-CN displayed a broad and intense emission peak centered around 440 nm, indicative of a high e-/h+ recombination rate. The PL emission peak of g-CN was barely visible in the ZnO/g-CN composite, potentially due to the low crystallinity of g-CN in the material. Compared with pure ZnO, the PL peak intensity of the ZnO/g-CN composite was significantly reduced, suggesting that the integration of ZnO and g-CN effectively suppressed e-/h+ recombination. ZnO acts as an efficient electron donor, while g-CN serves as a suitable electron acceptor. This synergistic interaction between the two components facilitates enhanced charge carrier separation and reduced recombination. Moreover, the A/ZCN ternary composite exhibited a notable decrease in emission intensity, indicating that the incorporation of Ag metal into the ZnO/g-CN system further inhibited the recombination of charge carriers and improved photocatalytic activity. This enhancement is attributed to efficient charge transfer between ZnO and g-CN, with Ag nanorods functioning as electron traps to extend the e-/h+ lifetime. Consequently, the A/ZCN composite is expected to demonstrate superior photocatalytic performance under visible light irradiation.
Influence of reaction parameters on the MB degradation
Effect of catalyst
First, the experiment without light was conducted to investigate the adsorption/desorption equilibrium time for the A/ZCN sample. In Supplementary Fig. S3, the MB adsorption capacity increased in the first 30 min, then the adsorption capacity almost does not change. Therefore, the adsorption equilibrium time was chosen as 30 min. Then, a blank test was conducted under visible light to evaluate the direct photodegradation ability, as shown in Fig. 3a. The results show that MB does not decompose when the reaction occurred under visible light irradiation without the catalyst. Meanwhile, the MB adsorption is negligible below 5% in ZnO, ZnO/g-CN, and A/ZCN samples, which demonstrates that the presence of the catalyst and visible light are necessary factors for effective MB degradation. However, the g-CN sample outperforms the others in MB adsorption. After 30 min in the dark, g-CN achieves remarkable adsorption efficiency of 44.2%. This may be because g-CN has a small particle size, porous structure, and large surface area, providing many active sites for adsorption. After 90 min of illumination, the DE values for g-CN, ZnO, ZnO/g-CN, and A/ZCN are 76.0, 84.0, 74.9, and 94.0%, respectively. The degradation process of MB by these materials follows the first-order kinetic (Nezamzadeh-Ejhieh and Banan, 2012). The degradation process is depicted in Fig. 3b. The rate constants of MB for A/ZCN, ZnO/g-CN, ZnO, and g-CN are 0.027, 0.01, 0.017, and 0.009 min−1, respectively.

The photocatalytic degradation mechanism of MB in the composite is illustrated in Fig. 3c. The photocatalytic efficiency of the A/ZCN composite is significantly higher than individual ZnO and g-CN, and this efficiency cannot be achieved without the role of Ag, because the rapid recombination phenomenon has reduced the number of strong oxidizing radicals. This has been overcome by the Surface plasmon resonance of Ag (Yousefi and Nezamzadeh-Ejhieh, 2021). In this case, most of the electrons from the CB of g-CN move to the surface of Ag and then transfer to the CB of ZnO or stay on the surface of Ag thereby helping to prolong the lifetime of e-/h+. The VB and CB values of ZnO and g-CN were calculated based on Mullikan electronegativity (Ghattavi and Nezamzadeh-Ejhieh, 2019). These results have been presented in previous group reports. The VB and CB of g-CN are 1.662 and −1.213 eV, and those of ZnO are 2.894 and −0.315 eV, respectively (Thi and Vu, 2022). Since the conduction band energy of ZnO is lower than the standard redox potential Eo(O2/O2−), the electrons accumulated in the CB of ZnO can be used to form superoxide radicals (•O2−) (Nezamzadeh-Ejhieh and Hushmandrad, 2010). The transfer of these charge carriers also can effectively reduce the e−/h+ recombination and enhance the photocatalytic effect of this catalyst (Yousefi and Nezamzadeh-Ejhieh, 2021). Meanwhile, each (e-) in the OH− species interacts with h+ at the VB of g-CN as well as on the surface of Ag to form hydroxyl radicals •OH, which facilitate the regeneration process of the material after the catalytic reaction. These hydroxyl radicals (•OH) and (•O2−) decompose MB into the final products (CO2 and H2O), significantly reducing the recombination process (e−)–(h+) (Kumaravel and Kim, 2023; Mohanty et al, 2021).
Photoexcitation of A/ZCN under visible light:
Water oxidation by valence band holes yields a hydroxyl radical:
Conduction band electrons reduce O2 to create superoxide radicals, which can also generate hydroxyl radicals via the following sequence of reaction (Arabpour and Nezamzadeh-Ejhieh, 2016):
The hydroxyl radicals (OH•) then attack aqueous MB, resulting in its photo-oxidation (Harris et al, 2020).
To investigate the role of active species in the photodegradation process, a series of experiments were performed with four scavengers AA, AgNO3, EDTA, and IPA to quench •O2−, e−, h+, and •OH, respectively (Ding et al, 2023). The evaluation process was similar to that of the photocatalytic experiment, but the scavengers were added to the reaction system after it reached adsorption equilibrium. The DE of MB in scavengers is shown in Supplementary Fig. S4.
Degradation decreases slightly in the presence of AgNO3, from 94.0% to 91.6%, indicating that the removal of electrons is not beneficial to the MB degradation process; in other words, electrons play a certain role. After the addition of IPA, EDTA, and AA, the degradation efficiencies decrease to 36.8%, 26.9%, and 10.1%, respectively. Therefore, it can be inferred that the degradation capacities follow the order: (•OH + •O2− + h+, with AgNO3) > (•O2− + e−, •OH, with IPA) > (•O2− + e− + h+, with EDTA) > (e− + h+ + •OH, with AA). Obviously, the •O2− radicals play the most crucial role in the MB degradation process, followed by the superoxide anion •OH, h+, and finally. This result is consistent with the mechanism proposed above, in which the •O2− radicals can directly interact and degrade MB, or interact with
Effect of catalyst dosage
As shown in Fig. 4a1, the highest DE (97.2%) is achieved at a catalyst dosage of 0.75 g/L, followed by 94.0%, 93.6%, and 76.9% after 90 min at dosages of 0.5, 0.25, and 0.125 g/L, respectively. The rate constant of degradation decreases gradually with the catalyst dosage. These values are 0.036, 0.028, 0.027, and 0.014 min−1 for 0.125, 0.25, 0.5, and 0.75 g/L, respectively. However, the DC decreases from 61.6 to 13.0 mg/g when the catalyst dosage increases from 0.125 to 0.75 g/L (Fig. 4a2 and a3).

As the dose of catalyst increases, the number of active sites on the surface also increases, promoting the formation of hydroxyl radicals (•OH) and superoxide radicals (•O2−). This facilitates the reaction process by enhancing the interaction between the catalyst and the substance molecules. In addition, the increased catalyst concentration leads to a higher density of catalyst particles in the illuminated region, which provides more opportunities for the substance molecules to interact with the active sites on the catalyst surface (Sheikhsamany et al, 2024). However, as the catalyst concentration increases, the amount of suspended catalyst in the solution also increases. This can reduce the penetration of light into the reaction mixture and thus reduce the efficiency of the photocatalytic process. Ultimately, although an increase in catalyst dosage means an acceleration of the reaction rate, it also means that each catalyst has less opportunity to interact with each substance molecule, leading to a reduction in the DC value of the process (de Moraes et al, 2018).
Effect of MB concentration
In Fig. 4b1, the DE value decreases as with increasing MB concentration. After 90 min, the DE value at 5 ppm reaches 98.6%, while the lowest DE value at 30 ppm is only 31.1%. The DE values at the concentrations of 10, 15, and 20 ppm are 94.0%, 88.7%, and 64.7%, respectively. In Fig. 4b2, the rate constant of the reaction gradually increases from 0.046 to 0.003 min−1 when the MB concentration increases from 5 to 30 ppm. However, the DC is highest at 15 and 20 ppm after 90 min of irradiation, reaching about 26 mg/g. This is followed by 10 and 30 ppm with over 18.6 mg/g and the lowest value at 5 ppm with only 9.9 mg/g (Fig. 4b3).
During the photocatalytic process, reactions take place on the catalyst surface between the generated free radicals (•OH and •O2−) at active sites and MB molecules. The increase in the initial concentration leads to an increase in the number of MB molecules adsorbed on the active sites of the catalyst surface, resulting in a decrease in the generation rate of free radicals (•OH and •O2−) at the same active sites. Therefore, the oxidation process at higher MB concentrations requires an additional catalyst or longer reaction times. In addition, increasing the dye concentration leads to the formation of a large number of intermediate compounds of dye molecules during the reaction, which can compete with MB molecules for the same unchanged active sites. Moreover, with increasing MB concentration at constant light intensity and illumination, the path length of photons into the solution decreases, so that fewer photons reach the catalyst surface, which reduces the decolorization capacity (Nezamzadeh-Ejhieh and Khorsandi, 2014).
Effect of solution pH
It is clear that pH significantly influences the degradability of MB on the A/ZCN composite. As shown in Fig. 4c1 and c2, the slowest degradation rate is observed at pH 4, increasing at pH 6.5 and decreasing as the pH increases further to 8. At pH 4 the DE value is 37.6% and the rate is constant at 0.005 min−1. MB decomposition efficiency in an acidic environment is low, this may be because ZnO is dissolved in an acidic environment. ZnO can react with acids to produce the corresponding salt (ZnO (s) + 2H+ (aq) → Zn2+ + H2O). Besides, at the initial pH value of 6.5, it also shows a high MB decomposition efficiency of 94% with a rate constant of 0.027 min−1. In particular, at pH of 10, the DE value is highest (97.6%) with a rate constant of 0.04 min−1. Under relatively alkaline conditions, the photocatalytic process can accelerate considerably. The high pH environment provides abundant OH- ions, which react with h+ to generate •OH radicals to increase the degradation efficiency (Ejhieh and Khorsandi, 2010). However, the high pH also increases the solubility of ZnO, resulting in lower stability and reusability of the catalyst (ZnO (s) + 2OH− (aq) + H2O (aq) → [Zn(OH)4]2− (aq)). Moreover, maintaining a pH 10 for the reaction can result in significantly higher costs in practical treatment processes. In addition, photocatalytic processes are often applied for wastewater treatment after pretreatment steps such as stream classification, stream pH stabilization, and removal of suspended solids, dust, and large organic compounds by sieving. Thus, the initial pH value of 6.5 was chosen for the MB treatment process because of its advantages such as high decomposition efficiency or low possibility of side reactions. In addition, selecting the optimal pH of 6.5 also helps save costs, chemicals, as well as environmental safety after treatment compared with other pH values (Ranade and Bhandari, 2014).
When studying the influence of the pH solution on the photocatalytic process, it is essential to consider the pH value at the point of zero charge pHpzc due to its close relationship with the surface properties of the catalyst. In Supplementary Fig. S5, the pHpzc value is 7.5. When the pH is near the pHpzc value, there is almost no electrostatic interaction between the catalyst surface and the ions or molecules in the solution, leading to weak MB adsorption. In addition, near the pHpzc value, the neutral surface charge provides fewer active sites to trap charge carriers. This increases the possibility of electron-hole recombination, reducing the photocatalytic efficiency of the material (Tangsiri and Nezamzadeh-Ejhieh, 2020). This is one reason the photocatalytic efficiency drops to 71.2% at pH 8. At a pH below 6.5, the surface of the composite is positively charged due to the adsorption of H+ ions, which interferes with the cationic dye molecules of MB and slows down the degradation process. In contrast, at a pH above 6.5, the surface of the composite is negatively charged, while MB is a cationic dye (Hemmatpour and Nezamzadeh-Ejhieh, 2022; Omrani et al, 2019). As a result, the increased adsorption of MB on the composite surface can accelerate the degradation process. In addition, when the pH of the solution exceeds the pHpzc value, the formation of •OH radicals can be enhanced, leading to increased catalytic efficiency. The working state of the A/ZCN photocatalyst at different pH values is shown in Fig. 5, where the blue arrows indicate the electrostatic attraction or repulsion of MB in water and the dashed red arrows indicate the formation and migration of OH• into the solution.

Schematic showing the working state of the A/ZCN photocatalysts at different pH.
Effect of different temperatures and light of irradiation
In Supplementary Fig. S6a1, when the reaction temperature increases from 30°C to 60°C, the MB decomposition efficiency decreases from 94% to 71.98%. The rate constant value as a function of temperature during the dye decomposition is shown in Supplementary Fig. S6a2. A high temperature causes the solution to evaporate during the reaction. In addition, the stability of the catalyst may also be impaired, which reduces the catalytic efficiency. On the contrary, as the temperature increases, the solubility of oxygen in water decreases, which reduces the number of superoxide radicals in the reaction (10). In addition, the thermal energy during the adsorption/desorption equilibrium shows that at lower temperatures, the adsorption of the catalyst onto the reaction surface is enhanced, leading to higher surface interaction. Therefore, 30°C was selected as the optimum temperature at which a decomposition efficiency of about 94% is achieved in 90 min.
Besides the reaction temperature, the type of irradiation light is also a factor that determines the photocatalytic activity of the material. The experiments were conducted under different types of lamps, including a 250 W Hg lamp and a 15 W UV lamp, as shown in Supplementary Fig. S6b1. In the first 10 min of illumination, the MB decomposition efficiency in the UV lamp is 34.65%, which is twice as high as 17.8% in the Hg lamp. However, after 90 min, the DE shows no major difference between the two lamp types: 95.7% for the UV lamp and 94% for the Hg lamp. It is noteworthy that the reaction rate increases from 0.027 min−1 in the Hg lamp to 0.033 min−1 in the UV lamp, as shown in Supplementary Fig. S6b2. This can be explained by the strong absorption of light in the UV region at wavelengths of 250–350 nm compared with the visible region.
Degradation of various dyes and comparison with other catalysts
In this study, different dyes were utilized to compare the photocatalytic efficiency of the A/ZCN composite, including TA, JGB, VBB, and CR. In Supplementary Fig. S7a, the DE values for TA, JGB, and VBB reach 94.6%, 98.2%, and 98.8%, respectively, after 90 min of illumination. Especially for CR, the dye is completely eliminated after 30 min and 96.9% of the dye is removed. Supplementary Fig. S7b shows the highest degradation rate for CR at 0.1 min−1, followed by JGB, TA, MB, and VBB with rates of 0.044, 0.030, 0.027, and 0.025 min−1 respectively. In Supplementary Fig. S7c, the DC values for all dyes were nearly identical, ranging from 19 to 20 mg/g. These promising results indicate that the ternary-composite A/ZCN is suitable for water treatment under real conditions.
Table 2 shows a brief comparison of the efficiency of MB removal with different catalysts by the photocatalytic process. A direct comparison of the different materials is relatively difficult because material has different processing conditions. However, we can indirectly compare the A/ZCN material with some materials from previous studies. Under visible light, the A/ZCN nanocomposite exhibits better MB degradation efficiency than TGO-15% (Wang et al, 2019) and MnTiO3-TiO2 (Alkaykh et al, 2020), although a shorter illumination time is required. Remarkably, the MB decomposition reaction rate of A/ZCN was five times higher at 5.96 × 10⁻³ min−1 compared with MnTiO3-TiO2 material. Ni-doped ZnFe2O4 nanoparticles (Padmapriya et al, 2016) and CeO2-NP/GO/PAM (Kalaycıoğlu et al, 2023) can degrade over 90.0% of MB after 90 min of light exposure but require more stringent reaction conditions at pH 3 and 12 compared with A/ZCN. In addition, FeOOH-LDO requires higher catalyst input to treat MB solutions with lower concentration and sustain the reaction twice as long as A/ZCN, although the removal efficiency is not significantly different (Xia et al, 2015). Similarly, Fe3O4/SiO2/MnO2/BiOBr-Bi (Ma et al, 2021) and VS2 nanoflake (Joseph and Aneesh, 2022) also required 150 and 105 min to remove 95.1% and 91% of MB, respectively. In addition, UiO-66/g-C3N4 (Zhang et al, 2018) and 1% nitrogen-doped quantum-ZIF-8-dots (Abd El Khalk et al, 2021) require 3 h of UV light and UV and sunlight irradiation exposure to remove only 49.2% and 93% MB, respectively. Moreover, the reaction rate of the A/ZCN sample was 2.6 times higher than that of 1% nitrogen-doped Quantum-ZIF-8-dot (0.0103 min−1). Therefore, it is anticipated that the A/ZCN composite synthesized by a simple method using urea can become a cost-effective and environmentally friendly catalyst for the large-scale treatment of textile wastewater.
Comparison of Degradation of Methylene Blue by Various Materials
Degradation of recalcitrant organic compounds
In addition to dyes, wastewater also contains various organic substances such as antibiotics and VOCs and antibiotics. Dyes, TCH, phenol, p-NP, and BPA were used to evaluate the photocatalytic efficiency of the A/ZCN sample. In Supplementary Fig. S8, the A/ZCN sample effectively degrades TCH with an efficiency of up to 99.7% and a rate constant k = 0.06 min−1, followed by p-NP and phenol with corresponding efficiencies of 91.4%, k = 0.023 min−1 and 78.8%, k = 0.016 min−1, respectively. BPA is relatively stable under the same reaction conditions compared with the other substances, with 34.1% of the initial BPA being removed with a rate constant k = 0.003 min−1. In Supplementary Fig. S8c, the DC is highest for TCH, reaching about 19.9 mg/g. This is followed by p-NP and phenol with over 18.3 and 15.8 mg/g, respectively, and the lowest value for BPA with only 4.5 mg/g. These results reveal the excellent photocatalytic reaction of A/ZCN not only for dyes but also for other recalcitrant organic compounds.
Chemical oxygen demand analysis
The mineralization process of MB was determined through the chemical oxygen demand (COD). The physicochemical parameter COD decreases from 52 to 14 mg O2/L after 90 min of reaction with A/ZCN catalyst. The decrease in oxygen levels during photodecolorization confirms the degradation of the dyes throughout the photocatalytic process. In Supplementary Fig. S9a, it can be seen that the COD removal rate is 73.08%, but the MB decomposition efficiency is 94%, proving that MB is partially converted into by-products during the treatment process. In addition, Supplementary Fig. S9b shows a significant change in the color of MB before and after treatment, the initial characteristic blue solution gradually fades to almost transparent. This discoloration shows that MB has been destroyed in terms of chemical structure, but intermediate decomposition products still exist. The mineralization of nitrogen in MB dyes may result in the formation of NO3−, NH3, or N2, while the mineralization of carbon, hydrogen, and oxygen may lead to the production of CO2 and H2O. So longer irradiation may be necessary to achieve complete mineralization of the dyes.
The reusability of the A/ZCN
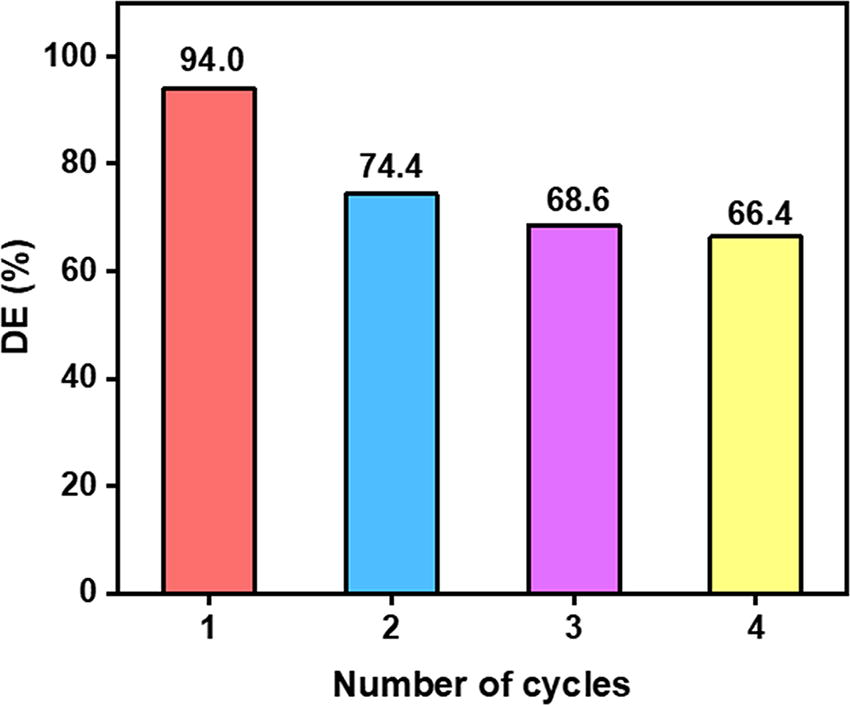
The reusability of the A/ZCN sample was evaluated in four consecutive cycles to assess its photocatalytic efficiency. After each experiment, the sample was subjected to thorough cleaning with distilled water and ethanol and then dried at 80°C for 15 h before being reused in the next experiment. The efficiency of MB after each cycle is shown in Fig. 6. The degradability of MB decreases after each cycle. After the first cycle, the MB removal efficiency decreases slightly from 94.0% to 74.4%. In the fourth cycle, the degradation efficiency decreased significantly to 66.4%. It is assumed that the decrease in DE is due to the loss of active sites and the increase of intermediates on the surface after each cycle.
Reusability test of A/ZCN sample.
The XRD patterns of the A/ZCN sample before and after MB decomposition are depicted in Supplementary Fig. S10a. We can see the presence of all peaks after MB treatment similar to the original material. This demonstrates the stability of the composition and structure of the material. However, peak intensity has decreased compared with the original, which can be explained by the fact that a small part of the MB dye is adsorbed on the surface of the material. This MB coating can partially obscure the crystal faces of the material or change the electron density of the surface atoms. In addition, during the MB decomposition process, the material under the influence of mechanical force will be dispersed or the particle size will decrease, which also leads to a decrease in X-ray intensity. SEM and EDS mapping were also performed on the sample after MB decomposition. In Supplementary Fig. S10b1 and b2, we can see that the surface of the A/ZCN-MB material becomes shiny, dense, and less porous, indicating that MB or decomposition products may be adsorbed onto the catalyst surface. The EDS spectrum shows no presence of other elements compared with the original material sample, which proves that the adsorption of other substances is negligible. In addition, the overall shape and structure do not change, once again demonstrating the structural stability of the A/ZCN material after MB decomposition.
Conclusions
The A/ZCN nanocomposite was successfully synthesized by a combination of physical mixing and annealing methods. The sample exhibited an average crystallite size of about 20.2 nm with an ordered arrangement of 3–4 particles in the form of a soap bubble. With a low bandgap energy (3.168 eV) and good absorption of visible light in the wavelength range of 500–525 nm, the combination of three components Ag, ZnO, and g-CN can enhance the separation of electron–hole pairs (e−) and (h+) while reducing their recombination rate. As a result, the photocatalytic efficiency of A/ZCN is increased compared with ZnO and g-CN. The A/ZCN sample decomposes 94.0% of MB at a rate of 0.027 min−1. The conditions of the photocatalytic process were also investigated by varying catalyst dosage, dye concentration, and pH solution. The pHpzc of the catalyst is 7.5 and a pH of 6.5 is a favorable condition for MB degradation and meets the economic and technical requirements for practical applications. In addition to MB degradation, the A/ZCN composite also shows good degradation of other organic dyes, especially when CR was completely degraded after only 30 min of exposure to light. The A/ZCN sample also shows effective degradation of TCH and phenol and its derivatives. These positive results underline the great potential for further research and development of this nanocomposite material as well as the photocatalytic wastewater treatment method in practical applications.
Footnotes
Authors’ Contributions
A.-T.V.: Methodology, investigation, review, editing, and validation; A.N.T.T. and V.D.T.C.: Methodology, investigation, experiment, and writing draft. All authors have read and agreed to the published version of the article.
Author Disclosure Statement
The authors declare that they have no known competing financial interests or personal relationships that could have appeared to influence the work reported in this article.
Funding Information
The work was performed at the Vietnam Germany Catalysis Centre—RoHan Project funded by the German Academic Exchange Service (DAAD, No. 57315854) and the Federal Ministry for Economic Cooperation and Development (BMZ) inside the framework SDG Bilateral Graduate school program. V.D.T.C. was funded by the Master, PhD Scholarship Programme of Vingroup Innovation Foundation (VINIF), code VINIF.2024.ThS.21.
References
Supplementary Material
Please find the following supplemental material available below.
For Open Access articles published under a Creative Commons License, all supplemental material carries the same license as the article it is associated with.
For non-Open Access articles published, all supplemental material carries a non-exclusive license, and permission requests for re-use of supplemental material or any part of supplemental material shall be sent directly to the copyright owner as specified in the copyright notice associated with the article.