
Abstract
Railways are embedded in the American imagination and have long been a core component of industrialization and economic productivity. However, train accidents, particularly accidents involving cars carrying hazardous materials (hazmat), can expose nearby residents to environmental and health hazards, and consequently have deep implications for the production of environmental injustice. This article considers the relationship between train accidents: the total number of hazmat cars involved, hazmat cars damaged, and hazmat released from cars, with area deprivation across U.S. counties from 2009 to 2022. The results show that area deprivation is an important predictor of train accidents. Counties with higher financial strength experienced fewer hazmat-involved train accidents, including cars that released hazmat, suggesting train accidents do produce economic injustice.
INTRODUCTION
Railways and trains are embedded in the American imagination and have long been deeply tied to economic production and growth, supporting the nation through industrialization. In the mid-1800s, the United States was home to over 30,000 miles of railways, growing to over a quarter of a million miles by the early 1900s, and then decreasing to today’s 140,000-mile network of freight railways. Integral to the supply chains for a variety of industries, railroads are regularly used to transport hazardous materials, which raises the possibility that railroad accidents may release hazardous materials and expose nearby environments and residents. The Federal Railroad Administration (FRA) argues railroads are the safest mode of transportation for hazardous materials,1 and trains are safe relative to other modes of transportation. However, accidents involving trains do occur, and among those tracked by the FRA since 1975, the most common type of accident is derailments, which occur when a vehicle comes off its rails. Derailments constitute over 60% of all accidents, followed by side collisions and “other impacts,” which each represent just under 10% of all rail accidents since 1975.2 Although some train accidents are minor and may be remediated in a matter of hours, major incidents can take weeks to resolve. Furthermore, when train accidents occur involving cars carrying hazardous materials, the cars may be damaged and materials may be released, leaving the surrounding areas exposed to gasses and liquids that may be flammable, explosive, or poisonous, including crude oil, ethanol, chlorine, caustic soda, plastics, and fertilizer ingredients.3
In their conceptualization of a “risk society,” Beck describes a society that is chiefly concerned with the distribution of technological or manufactured risks, arguing that environmental injustice is created through the segmenting of the “bads” and “goods” that result from the continued pursuit of increased economic production.4 Crucially, in this theory the principal risks are associated with the same forces of industrialization that initially created wealth, as the logic of economic productivity is undeterred in the face of accumulating environmental risks. The constant push for economic growth is driven by coalitions of businesses and governments, known as the “treadmill of production,” which creates both economic wealth and environmental degradation and disorganization.5 Although the risk society posits common risk of exposure to environmental hazards in the long run, through climate change for example, in the short term, risk is tied to social class. Indeed, economic wealth may purchase safety, while economically and politically deprived regions “…have to pay with their economic existence for the damage and its unaccountability.”5[p. 29] An instantiation of this theory occurred in 2023, when 38 cars of a 150-car train owned by Norfolk Southern carrying hazardous materials, including toxic flammable gasses and liquids, came off the tracks in East Palestine, Ohio, and numerous cars carrying hazardous materials were damaged. After several days of attempting to mitigate the flow of hazardous materials from the damaged cars into the surrounding environment, responders became concerned that a reaction would create an explosion. To avoid such a scenario, the responders conducted a “controlled burn” or “vent and burn”—an intentional burning off of the hazardous materials to empty the cars, which was paired with a precautionary evacuation of those living within the vicinity of the derailment site.6,7 At the time of the incident, Norfolk Southern had a market capitalization of well over 50 billion dollars (U.S.), while the village of East Palestine, Ohio, had a median household income of under 50,000 dollars annually, over 30% below the national rate.
The U.S. Environmental Protection Agency defines environmental justice as the “fair treatment and meaningful involvement of all people regardless of race, color, national origin, or income, with respect to the development, implementation, and enforcement of environmental laws, regulations, and policies,” where fair is defined as the “the same degree of protection from environmental and health hazards.”8 Indeed, the existing literature has demonstrated a variety of ways that environmental injustice operates across the lines of social class, including the distribution of noise, crowded housing, particulate matter, water quality, lead-based paint, and radon.9,10,11,12,13 However, as demonstrated above, the distribution of train accidents, and particularly accidents involving cars carrying hazardous materials, has environmental justice implications that remain unexplored in the extant literature. Indeed, the study of train accidents has been carried out, almost exclusively, from engineering perspectives, often focusing on train properties and rail conditions.14,15,16 To address this gap in the literature, this article considers the relationship between train accidents and area deprivation, defined as the extent to which a region is deprived or disadvantaged across four domains (income, education, employment, and housing quality), among U.S. counties.
MATERIALS AND METHODS
The preceding discussion suggests that train accidents are unequally distributed over space, producing environmental injustice as residents are differentially exposed to the resulting environmental hazards.17,18 Accordingly, this study focuses on the relationship between area deprivation and train accidents across U.S. counties and county equivalents from 2009 to 2022. A county is a geographic subdivision of a state, which can vary widely in land mass and population; however, they are important political and administrative units, sharing responsibility for running elections as well as public health and social welfare programs. The data in this study are aggregated by county and year from 2009 to 2022 and include 14 measurements on 3,127 counties, resulting in 43,778 total observations.
To provide a holistic assessment of the risk of accidents involving hazardous materials, as well as environmental impact, this article considers three main outcomes: (1) the total number of train cars carrying hazardous materials involved in the accident, 2) the total number of train cars carrying hazardous materials damaged in the accident, and 3) the total number of train cars that released hazardous materials as a result of the accident. These data, captured in the FRA’s form 54, are published publicly by the FRA. Hazardous materials are defined by U.S. transportation law (49 U.S.C. 5103) as any substance that is “capable of posing an unreasonable risk to health.” The FRA has published aggregate Form 54 data beginning in 1975 (see Fig. 1); however, to map train accident data to measures of area deprivation created with U.S. census variables, this study focuses on accidents from 2009 to 2022.
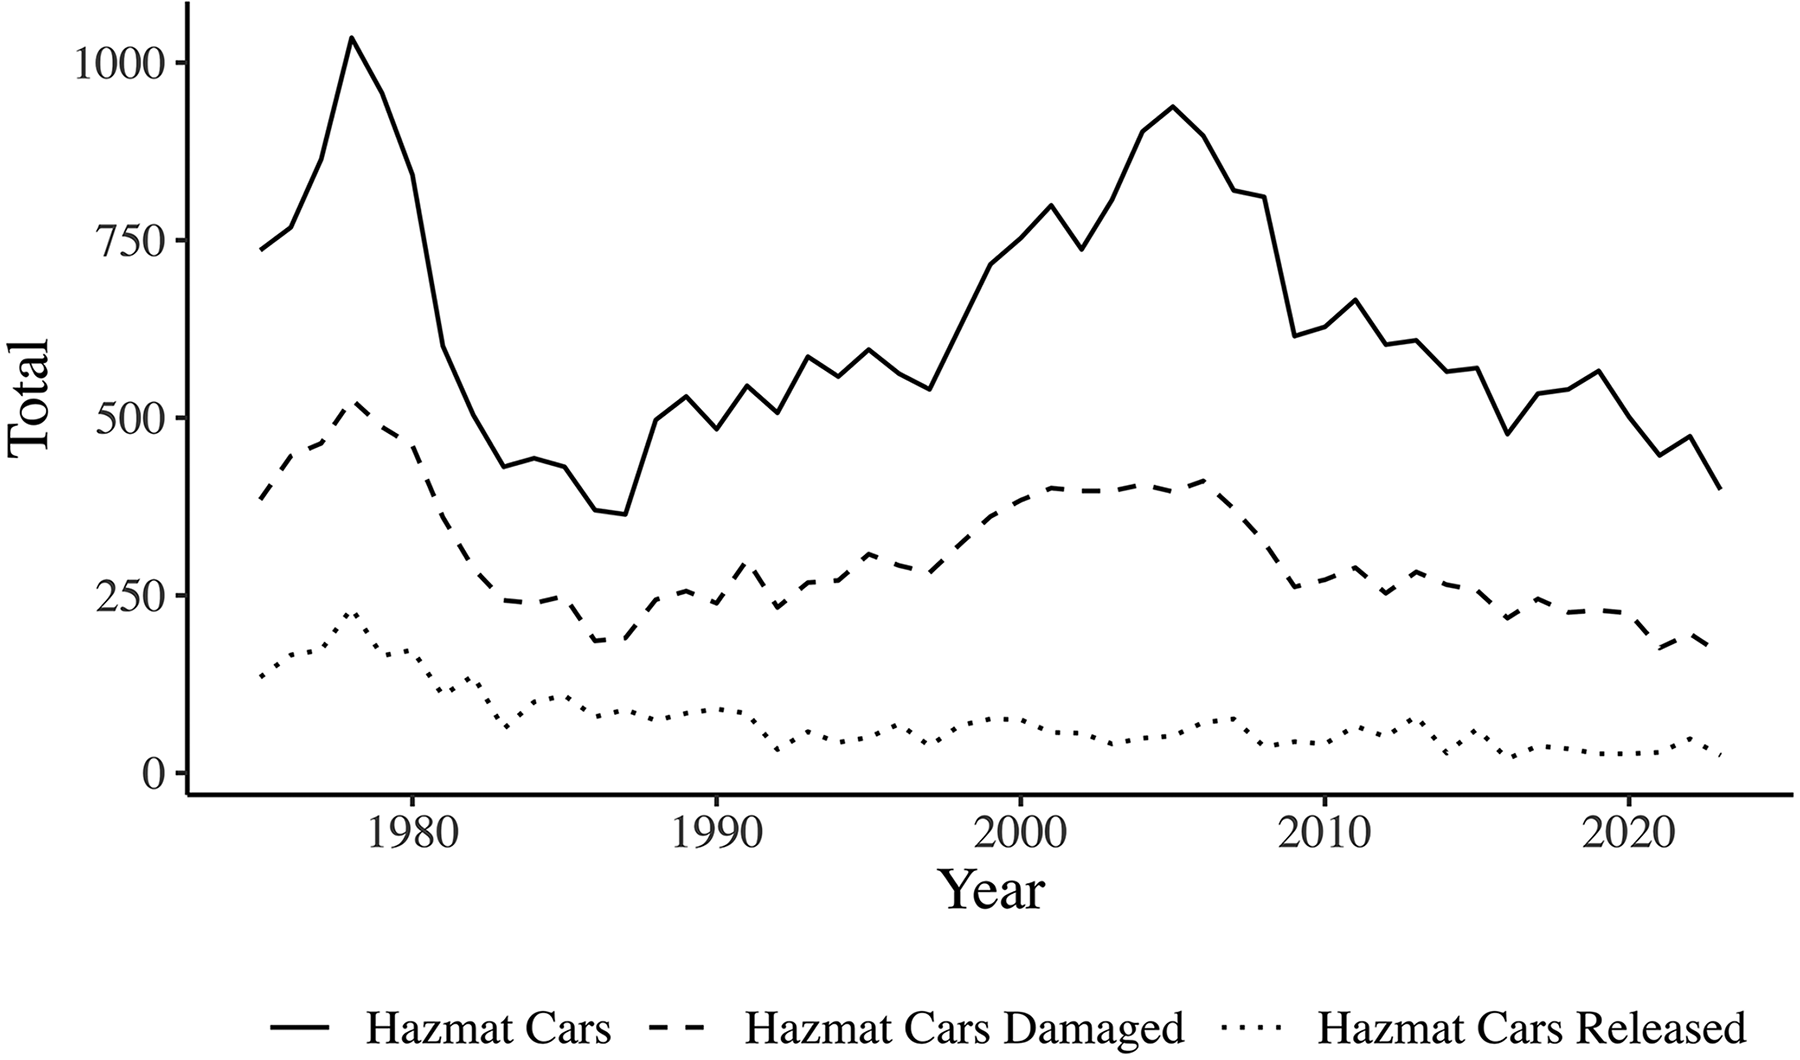
Total train cars carrying hazmats involved in accidents, damaged, and cars that released hazmats over time (1975–2023).
The key independent variable in this study is area deprivation. Area deprivation measures the extent to which a region is deprived or disadvantaged across the areas of income, education, employment, and housing quality. Originally developed as a single-factor measure constructed from U.S. census data,19 called the Area Deprivation Index (ADI), the ADI has been widely applied across health domains to understand equity and differential exposure due to disadvantage.20 The single-factor ADI, however, has been critiqued for conflating distinct domains, and a recently developed refinement suggests it is better measured using three correlated factors representing financial strength, economic hardship and inequality, and educational attainment.21 The indices are created by taking the first component from a principal components analysis on a distinct set of variables for each domain. Financial strength includes median family income, median mortgage, median rent, median home value, and the percent of residents in white-collar jobs. Economic hardship and inequality include the percent of families in poverty, the percent of owner-occupied housing, the percent living under 150% of the poverty line, the percent of children in single-parent households, the percent of households with no vehicle, the percent unemployed, and the percent of households with income between 10,000 and 50,000 annually. Educational attainment includes the percent of residents with more than a high school education, the percent of residents with less than 9 years of educational attainment, and the percent of households with greater than one person per room. Finally, the study also measures the total resident population of each county over the study period to control for the possibility that accident frequency is correlated with county population size.
EMPIRICAL MODEL
This study focuses on the relationship between area deprivation and cars carrying hazmats involved in train accidents. Aggregated by county and year, the three outcomes considered in this study are positive and unbounded counts, which suggests a Poisson likelihood has the correct support. However, accidents are relatively rare: pooled over counties and years, the outcomes are 90%, 95%, and 99% sparse for total hazmat cars, total damaged hazmat cars, and total cars that released hazmat, respectively. Table 1 shows the mean for the three outcomes, and Poisson distributions with the means shown in Table 1 have expected zero-producing probabilities of approximately 83, 92, and 98, respectively. Comparing the values suggests total hazmat cars and damaged hazmat cars may be zero-inflated. This study uses a hierarchical Bayesian methodology, integrated nested Laplace approximation, to implement hierarchical zero-inflated Poisson (ZIP) models22 for total hazmat cars and damaged hazmat cars, with a random effect that varies over counties in the Poisson component. The ZIP model is shown in equation (1), where


Mean, Standard Deviation, Minimum, and Maximum for Study Variables (N = 43,778)
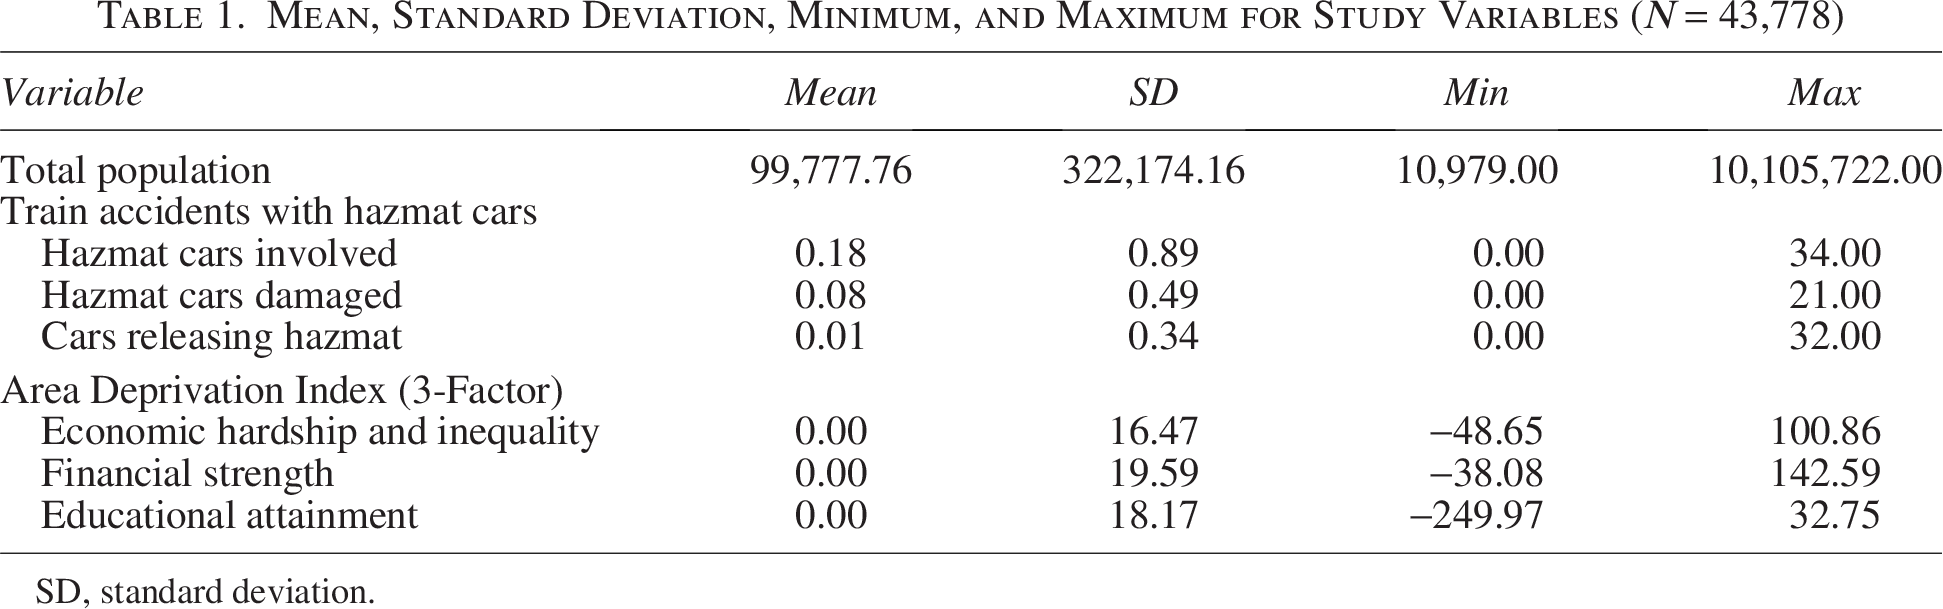
SD, standard deviation.
RESULTS
Table 1 shows select descriptive statistics for the variables included in the study, pooled over the 14 year study period. The table shows the average county has just under 100,000 residents and averages just under a fifth of a hazmat car involved in a crash per year. The table also shows that hazmat cars being damaged or releasing hazmat is relatively rare, with means of 0.01 and 0.08, respectively. The table also shows the three-factor ADI, which range widely, with ranges of 149.51, 180.67, and 282.72 for economic hardship and inequality, financial strength, and educational attainment, respectively. As the independent variable in this study, the range of these indices shows the empirical approach will have ample support to compare deprivation over space and time.
Table 1 shows the average hazmat car accident statistics by county and year; however, it does not capture the time trends in hazmat car accidents. The totals for cars carrying hazmats involved in each class of train accidents by year are shown in Figure 1. To provide additional context, this figure displays data from 1975, when the Form 54 data became available. Figure 1 shows the highest level for each type of incident occurred before 1980, and each total shows a negative, however inconsistent, trend toward smaller totals of hazmat cars involved each year.
The results for the hierarchical ZIP models described in equations (1)–(4) for the total hazmat cars involved in train accidents and total hazmat cars damaged, as well as the hierarchical Poisson model for the total number of cars releasing hazmat, are shown in Table 2. The constant shows counties at the mean of the covariates experienced few train accidents involving hazmat cars in 2009, reflecting the low base rate of train accidents across categories. The model results show several important trends in the covariates. The results for the first model show the resident population, economic hardship and inequality, and financial strength are important predictors of the number of hazmat cars involved in train accidents. The hyperparameter summary shows the zero-inflated component captures a minority of zeros in the outcome of the first two models, consistent with the empirical distributions described above.
Model Results, Train Accidents and Area Deprivation
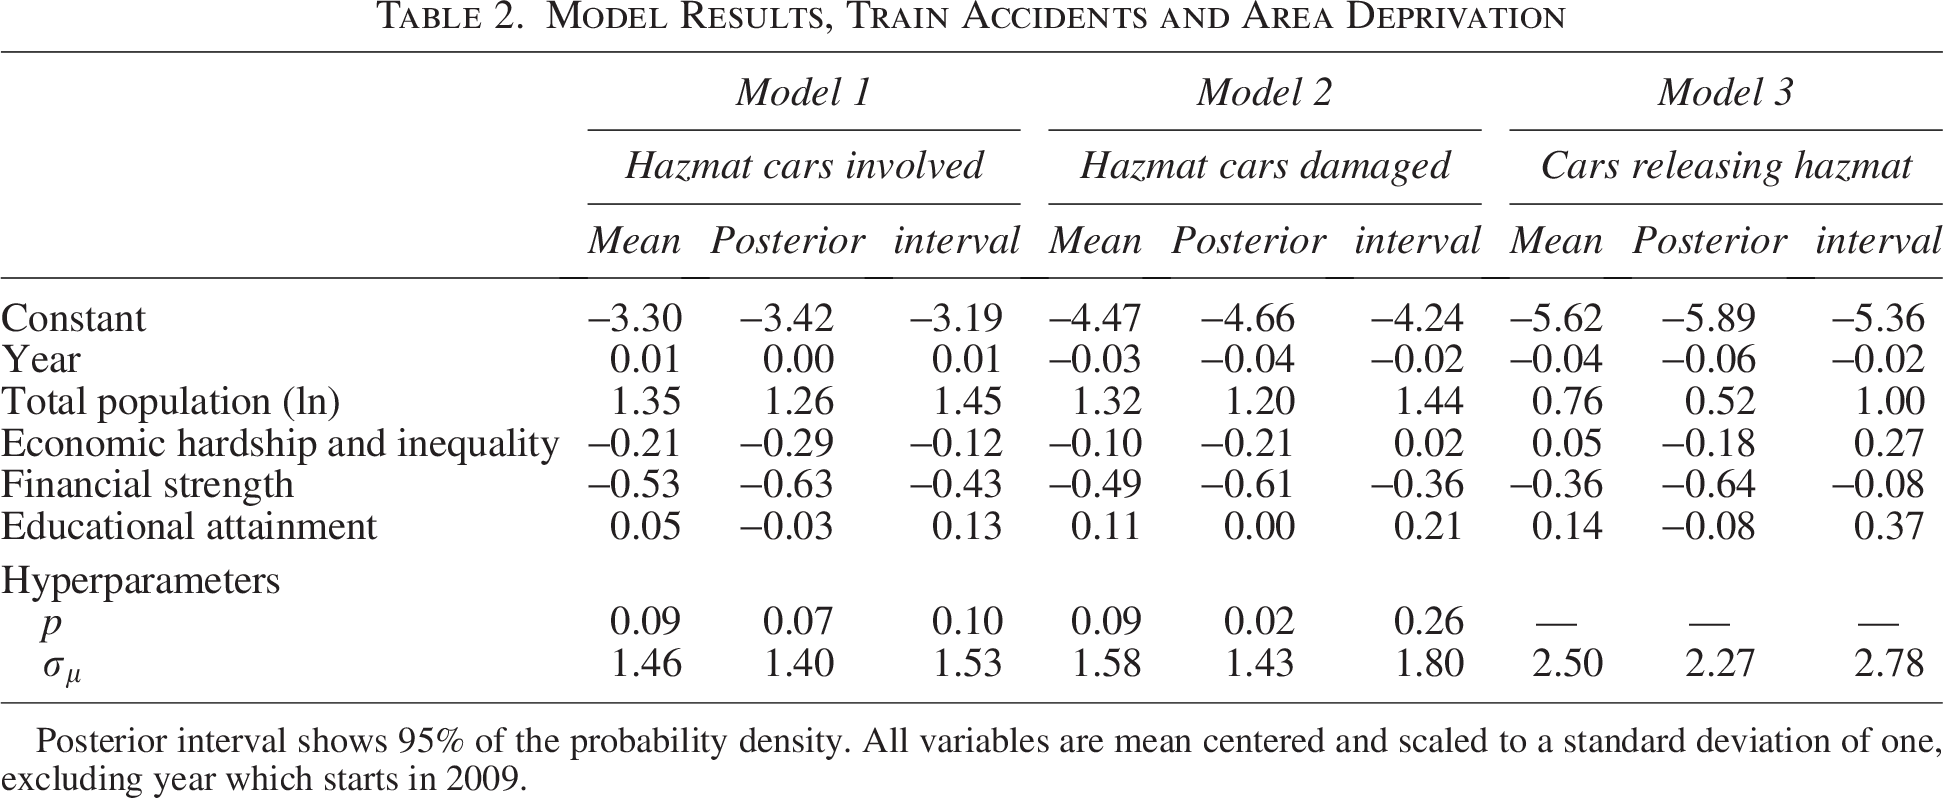
Posterior interval shows 95% of the probability density. All variables are mean centered and scaled to a standard deviation of one, excluding year which starts in 2009.
A one standard deviation increase in the economic hardship and inequality index predicts an 18% decrease in the number of hazmat cars involved in accidents; however, financial strength appears to be a stronger predictor, a one standard deviation increase predicts a 41% decrease in the number of hazmat cars involved in accidents. In the second model, using the outcome of the number of hazmat cars damaged, economic hardship and inequality are no longer significant predictors, as the posterior interval includes zero. Financial strength remains an important predictor, however, showing a similar estimate—a one standard deviation increase in the index predicts a decrease of 38% in the expected number of hazmat cars damaged. The final model considers the number of cars that released hazmat. The results show a one standard deviation increase in the financial strength index predicts a 30% decrease in the expected number of cars that release hazmat. Overall, these results suggest financial strength and train accidents involving hazmat have a strong negative relationship: counties with higher levels of financial strength experience fewer hazmat-involved train accidents, and have hazmat released from trains less frequently.
Although not the focus of this study, the total population of the county appears positively related to all three outcomes, suggesting accidents involving trains carrying hazmat occur in more populated regions, on average. Additionally, while consistent with zero for the total number of hazmat cars involved in the accident, the time trend shows the number of hazmat cars and the number of hazmat cars that released hazmat have decreased over the study period by roughly 3% a year.
DISCUSSION
Decades ago, a perspective emerged that focused on the future distribution of the negative side effects of the economic production process and posited that the chief environmental concerns would be those that were manufactured through the pursuit of economic growth.24 In contrast to economic theories that suggest increases in resources create demand for lower levels of pollution,25 the theory of risk society posits that the distribution of these side effects would concentrate in areas that are under-resourced and likely otherwise without power to resist exposure to environmental hazards and increased environmental disorganization.26 Trains are embedded in the logic and mythos of economic production and are often owned and run by large corporations. Railroads are also regularly used to transport hazardous materials, raising the possibility that train accidents produce economic injustice by creating differential exposure to explosive, poisonous, or flammable contents. To understand the implications of train accidents for the creation of environmental injustice, this paper has considered the distribution of accidents involving trains carrying hazardous materials among U.S. counties from 2009 to 2022, as a function of area deprivation with a Bayesian hierarchical model. The results show that area deprivation is an important predictor of all three indicators: the total number of cars carrying hazmat involved in the accident, the number of cars damaged, and the number of cars that released hazmat. Primarily, the results emphasize that counties with higher financial strength experience fewer total hazmat car accidents, with a substantial negative estimate found for financial strength for each outcome under consideration. These results suggests that, consistent with the theory described above, the manufactured risks associated with the transportation of hazardous materials over railroads are not equally distributed across the United States. Rather, lower-income and financially weaker regions experience higher numbers of hazmat train accidents, including the release of hazmat from train cars, exposing nearby residents to materials that pose “unreasonable risk to health.”
The theory of risk society suggests that environmental risk is socially constructed, as risk of exposure is magnified by socio-political and cultural processes.27 The results from this paper support the theory of socially constructed environmental risk; however, they shed limited light on the stratification process that created the differential risk positions we observe. On one hand, much of the U.S. rail infrastructure was developed decades ago and has degraded over time,28 suggesting that rail infrastructure may have predated the social stratification that results in differential risk positions, or rather that the process of social stratification emerged over time as underinvestment left many areas with poor infrastructure. Although much of the rail system was established long ago, private rail has continued to expand. For example, private rail has laid roughly 6 million tons of new rail track in the past 10 years, and future research may benefit from considering the location of new rail and accidents involving hazardous materials to assist in understanding the way risk positions emerge over time.29 This study is also limited insofar as it has not explicitly controlled for train schedules. The zero-inflated model employed in this study will adjust for this, as areas with zero or few scheduled trains with hazardous materials will have an increased probability of zero accidents; however, explicitly incorporating the scheduling of trains carrying hazardous material may improve our understanding of the distribution of risk over space. For example, future research may consider the number of scheduled trains as an outcome, rather than train accidents.
The introduction of this article described the accident of East Palestine, Ohio, in 2023, which created immense environmental disorder and resulted in the evacuation of many residents. Following the accident, the U.S. president expressed plans to visit the town, while other lawmakers began to work on a bill that would, among other changes, increase fines for violating railway safety regulations and provide funding for research and development to improve rail safety.30,31 However, neither of these have materialized. This article has shown that improving the safety of trains carrying hazardous materials is not simply a railway safety issue, but also an opportunity to reduce environmental injustice and disorganization.
CONCLUSION
This article has considered the relationship between area deprivation and (1) the total number of train cars carrying hazardous materials involved in the accident, (2) the total number of train cars carrying hazardous materials damaged in the accident, and (3) the total number of train cars that released hazardous materials as a result of train accidents using data on U.S. counties from 2009 to 2022. The results suggest counties with higher financial strength regularly experience lower totals across all three categories, suggesting that train accidents create environmental injustice.
AUTHORS’ CONTRIBUTIONS
D.J.M.: Conceptualization, methodology, formal analysis, data curation, writing—original draft, writing—review and editing, visualization, project administration, and software.
Footnotes
AUTHOR DISCLOSURE STATEMENT
The author has no relevant financial or nonfinancial interests to disclose.
FUNDING INFORMATION
No funding was received to assist with the preparation of this article.