
Abstract
Abstract
Introduction:
Patients with cancer experience multiple symptoms that frequently appear in groups or clusters. We conducted a comprehensive clinical review of cancer symptom cluster studies to identify common symptom clusters (SC), explore their clinical relevance, and examine their research importance.
Methods:
Published studies and review articles on cancer SC were obtained through a literature search. We identified 65 reports. These varied in assessment instruments, outcomes, design, population characteristics, and study methods.
Results:
Two main approaches to symptom cluster identification were found: clinical and statistical. Clinically determined SC were based upon observations of symptom co-occurrence, associations, or interrelations. These included fatigue-pain, fatigue-insomnia, fatigue-insomnia-pain, depression-fatigue, and depression-pain. They were analyzed by multivariate analysis. They had low to moderate statistical correlations. Disease- or treatment-related SC were influenced by primary cancer site, disease stage, or antitumor treatment. SC determined by statistical analysis were identified by factor and cluster analysis through nonrandom symptom distribution. Nausea-vomiting, anxiety-depression, fatigue-drowsiness, and pain-constipation consistently clustered by either or both of these statistical methods. The individual symptoms of pain, insomnia, and fatigue often appeared in different clusters. A consensus about standard criteria and methodological techniques for cluster analysis should be established.
Conclusions:
Several important cancer SC have been identified. Nausea-vomiting, anxiety-depression, and dyspnea-cough clusters were consistently reported. The techniques of symptom cluster identification remain a research tool, but one with considerable potential clinical importance. Further research should validate our analytical techniques, and expand our knowledge about SC and their clinical importance.
Introduction
Psychology, psychiatry, and general medicine have examined the co-occurrence of symptoms in clusters for many years. Such studies provided important clinical and research findings.5,6 Cancer cluster type and composition vary across studies.5,7 These differences may in part be explained by different assessment instruments, design, statistical methods, and population characteristics. 7 Furthermore, there is a lack of common criteria to identify symptom clusters (SC). In this state of the art review, we will comment on symptom interrelationships, summarize important features of cancer symptom cluster studies, and discuss methodological problems.
Definitions
One definition of a symptom cluster has been that of three or more concurrent symptoms related to each other that group together.5,8 The definition was later revised so that two symptoms could form a cluster. 9 Currently, there is no consensus on clusters either conceptually or methodologically. Clusters imply symptoms which group together in a nonrandom fashion.9,10 This may imply that SC have a common mechanism, and symptoms within a cluster might respond a single treatment. 11 SC may be stable throughout the disease course 12 within the context of a particular cancer or population and have clinical outcomes that are different from individual symptoms.5,7,8,13,14
The number of symptoms reported within a cluster varies. Symptoms change in intensity during the disease course. It is possible that cluster composition will be influenced by symptom severity or other domain measured (prevalence or distress). The assessment instrument, timeframe, and statistical methodology will potentially alter cluster composition. An individual symptom can occur in different clusters,15–17 which suggests multiple mechanisms for a symptom. This observation suggests that individual symptoms arise from multiple mechanisms.11,17 Relationships between two symptoms may be indirect, perhaps mediated by a third symptom 18 or co-occurrence influenced by performance status (PS). 18 Complex neuroimmunologic pathways, differences in statistical methodology or symptom assessment instruments, and varied symptom cluster definitions account for the differences in the reported cluster compositions. 17 Whether SC should be defined based solely on a statistical method, clinical experience, symptom domain, or by a common mechanism is unclear.4,5,14
Methods
Cancer symptom cluster studies in adults were evaluated. A MEDLINE database was searched using OVID MEDLINE (Ovid Technologies Inc, New York, NY). “Symptom cluster” was not indexed as a MESH term. Therefore, we used the key words: symptom cluster, multiple symptoms, symptom constellation, or concurrent symptoms and neoplasm. A hand search of references was also performed. Searches were limited to original reports in English (1948–2010). The search methodology is listed in the Appendix. A total of 238 abstracts were identified for initial review (Fig. 1). All studies were independently assessed by J.K. and A.A.
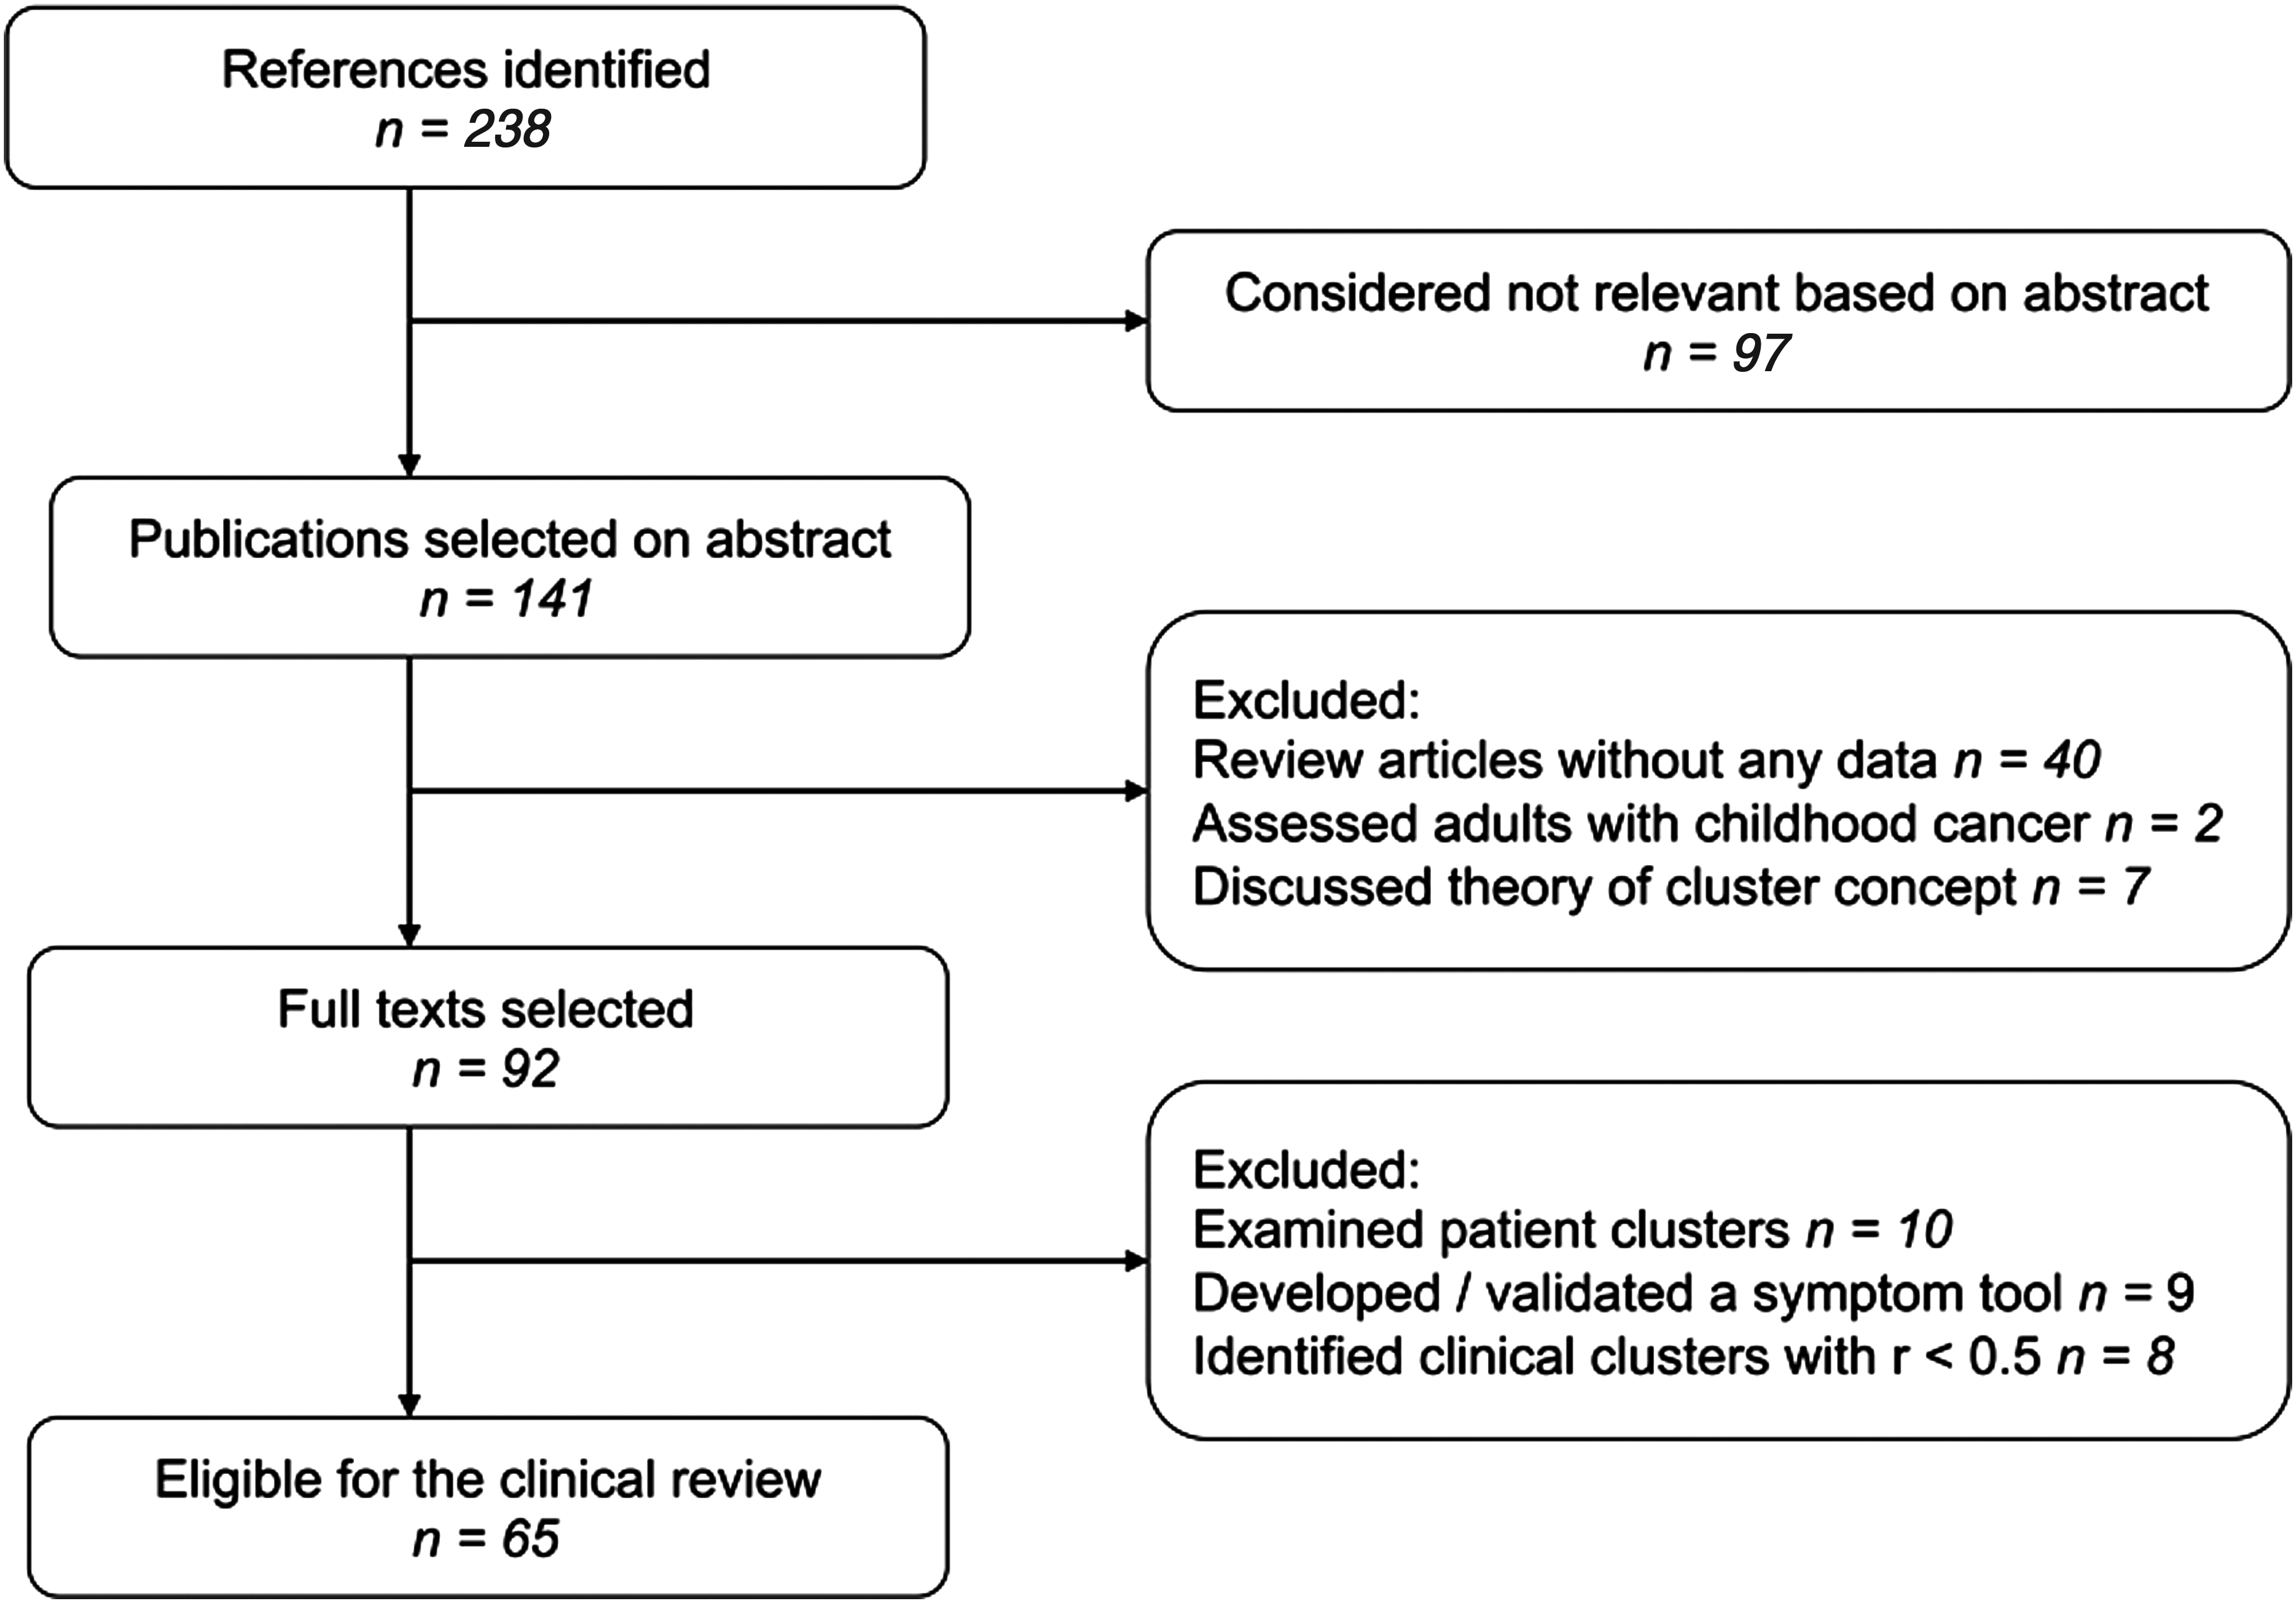
Flow chart of study identification and selection. The flow chart shows the inclusion and the exclusion of the publications used in the study.
We then selected studies based on specific inclusion and exclusion criteria. Studies were included if they:
1. Aimed to identify SC or interrelationships between two or more concurrent symptoms. 2. Reported associations of clustered symptoms and patient outcomes (e.g., QOL, functional status, survival) using validated instruments or nonvalidated symptom checklists. 3. Reported at least one moderate to high correlation (r≥0.5) between cluster symptoms.
Studies were excluded if they:
1. Used cluster analysis to identify different groups of patients based on common symptom experiences. 2. Reported SC as a secondary outcome through validation of a symptom assessment instrument or multidimensional assessment scale.
Results
Sixty-five studies that met inclusion/exclusion criteria were identified (Fig. 1). Two main approaches to symptom cluster analysis were found: clinical and statistical. 7
Clinical SC (to include cancer- and treatment-specific clusters) were identified from studies that focused on a small number of preselected symptoms. The rationales were predominantly based on clinically observed associations of symptoms that were likely to cluster such as pain, fatigue, and depression. The quality of studies widely varied. However, they usually had low to moderate statistical correlations (r<0.5). Among the 18 reports that identified clinical SC, most used correlational methods; 1 study used patient-based cluster analysis and equation model, 19 2 studies used either equation model 20 or another model, 21 and 3 studies used mediation model18,22–23 to identify symptom interrelationships. All were descriptive, except 1 interventional. 24 Five underwent secondary data analyses15,21,22,25–27; 2 used data from randomized controlled trials (RCT).21,22 Five studies were longitudinal8,19,21,24,28 and the others13,15,18,20,22,23,25–27,29–32 cross-sectional.
Statistically defined SC were derived from either a multisymptom assessment tool (e.g., Edmonton Symptom Assessment Scale) or a symptom checklist that included larger number of symptoms. Most used factor or cluster analysis to identify clusters. Among 47 reports, 733–39 assessed at least 10 symptoms, but used correlation analyses. Most studies were descriptive, except for three RCT.39–41 One study used both qualitative and quantitative methods. 38 Sixteen reports were post hoc.9,10,12,16,33,42–52 Twenty-one reports were longitudinal33,36,37,39–41,43,49,53–65; 26 had a cross-sectional design.9,10,12,16,34,35,38,42,44–48,50–52,66–75 Eleven used factor analysis,9,43–45,48,49,51,59–61,69 1 a confirmatory factor analysis (CFA), 47 and 12 principal component analysis (PCA).37,39,40,50,53,55,56,58 63,66–68 Eight used cluster analysis,10,12,16,42,46,65,70,72 9 more than one analytical technique,41,50,54,55,59,71,73–75 2 used structural equation model,57,62 and 3 used other models.16,52,64
Clinical Clusters
Clinical observation
Clinically defined SC often focused on a few symptoms (usually 2 or 3) empirically considered clinically important. 7 They were selected after multisymptom patient assessment, or formed a preselected group of symptoms named as a cluster (Table 1). This approach is based on:
Note: The studies are listed in chronological order.
r, correlation coefficient; α=Cronbach's α coefficient; CI, confidence interval; GI, gastrointestinal; SOB, shortness of breath; QOL, quality of life; PTSD, post-traumatic stress disorder; KPS, Karnofsky Performance Status, ECOG PS, Eastern Cooperative Oncology Group Performance Score; RCT, randomized clinical trial; VAS, visual analogue scale; VRS, verbal rating scale, BDI, Beck Depression Inventory; BFI, Brief Fatigue Inventory; BPI, Brief Pain Inventory; HADS, Hospital Anxiety and Depression Scale; SSI, Symptom Severity Index; GSDS, General Sleep Disturbance Scale; POM, Painometer; MOS-SF, Medical Outcomes Study-Short Form, CES, Cranial Electrical Stimulation; CES-D, Center for Epidemiological Studies Depression; QOL-CA, Quality of Life-Cancer; FPI, Functional Performance Inventory; SF-36, Short-Form 36; FSQOLS, Fox Simple QOL Scale; COGMOS, Cognitive Functioning Subscale of the Medical Outcomes Scale; FACT-BR, Functional and Brain Subscales of the Functional Assessment of Cancer Therapy, PSQI: Pittsburgh Sleep Quality Index, MFSI-SF: Multidimensional Fatigue Symptom Inventory Short Form; SDS, Symptom Distress Scale; SDI, Symptom Distress Inventory; HCA, hierarchical cluster analysis; CFA, confirmatory factor analysis; EFA, explanatory factor analysis; NCI CTC, National Cancer Institute Common Toxicity Criteria; POMS, Profile of Mood States; FACT, Functional Assessment of Cancer Therapy; PSET, Physical Symptom Experience Tool; MSAS, Memorial Symptom Assessment Scale; MDASI, M.D. Anderson Symptom Inventory; ESAS, Edmonton Symptom Assessment Scale; C-PET, Checklist for Patients with Endocrine Therapy; IBCSG, International Breast Cancer Study; EORTC QLQ-C30, European Organization for Research and Treatment of Cancer Quality of Life Questionnaire; ULL, upper limb lymhedema; WCLS, Wesley Clinic Lymhedema Scale; FACT-Hep EWB, Functional Assessment of Cancer Therapy-Hepatobiliary Emotional Well-Being; SQLI, Spitzer Quality of Life Index; FSI: Fatigue Symptom Inventory.
Post hoc statistical analysis explored the relationships between these target symptoms to support symptom interrelationships. This was done by correlation (Pearson product moment correlation or Spearman's ρ) or by multiple regression analysis, with the dependent variable the target symptom of interest.8,13,20,21,25,26,28,30,31 The degree of association is reported by a correlation coefficient (0=no correlation, 1=excellent correlation), or interaction (significant or not) from regression models. Common symptoms like fatigue-depression-pain; fatigue-insomnia-pain; nausea-vomiting-poor appetite have been clustered in this fashion. It is noteworthy that such correlations were done on symptom pairs only.4,8,13,76
Fatigue, sleep disturbance, depression, and pain have been studied together in relation to Karnofsky Performance Status (KPS) and QOL through clustering patients, not symptoms. 77 This particular study identified patient subgroups based on fatigue and pain severity by cluster analysis: Those who reported low levels of all symptoms had the best KPS and QOL.
Antitumor treatment
Animal and human studies suggest symptoms may be mediated by a common neuroimmunologic mechanism. Sickness behavior theory links symptoms like depression, cognitive impairment, fatigue, and pain to proinflammatory cytokines.15,78 The therapeutic use of interferon-α (IFN-α) and interleukin-2 (IL-2) for renal cancer and melanoma produces neuropsychological symptoms, which are similar to the sickness syndrome of advanced cancer. Anxiety, asthenia, depression, fatigue, nausea, and pain are evident. They group together dependent on whether IFN-α or IL-2 were used alone or together. 79 Single cytokine immunotherapy generates different SC than do cytokine combinations.80,81 Paroxetine improves cytokine-induced depression, anxiety, and cognitive deficits but not anorexia or fatigue. Paroxetine during chemotherapy improves depression, but not fatigue.80,82 Genetic make-up may also play a role in cytokine generated symptoms. 83 The depression-fatigue-pain cluster is associated with serum CRP levels in women receiving treatment for breast cancer. 24 Certain clusters are likely to be influenced by antitumor treatments.
A major limitation is that the number of symptoms selected in a cluster directly determined the cluster observed. Significant correlations might still exist between symptoms not included in a predefined cluster, or perhaps symptom relationships would differ based on the symptom used as the dependent variable. It is important to justify the theoretical foundations for the choice of symptoms for analysis.
Statistical Clusters
Both hierarchical cluster (HCA) and factor analyses place multiple symptoms into groups (clusters) without any prior assumptions about the symptom relationships (Table 2). Large data sets are analyzed to identify associations among symptoms that may define a clinically important (but previously unknown) relationship, but this is speculative. Some used one analysis to identify clusters but validate the cluster by another. 9
Note: The studies are listed in chronological order.
r, Correlation coefficient; α, Cronbach's α coefficient; CI, confidence interval; GI, gastrointestinal; SOB, shortness of breath; QOL, quality of life; PTSD, post-traumatic stress disorder; KPS, Karnofsky Performance Status; ECOG PS, Eastern Cooperative Oncology Group Performance Score; RCT, randomized clinical trial; VAS, visual analogue scale; VRS, verbal rating scale; BDI, Beck Depression Inventory; BFI, Brief Fatigue Inventory; BPI, Brief Pain Inventory; HADS, Hospital Anxiety and Depression Scale; SSI, Symptom Severity Index; GSDS, General Sleep Disturbance Scale; POM, Painometer; MOS-SF, Medical Outcomes Study-Short Form; CES, Cranial Electrical Stimulation; CES-D, Center for Epidemiological Studies Depression; QOL-CA, Quality of Life-Cancer; FPI, Functional Performance Inventory; SF-36, Short-Form 36; FSQOLS, Fox Simple QOL Scale; COGMOS, Cognitive Functioning Subscale of the Medical Outcomes Scale; FACT-BR, Functional and Brain Subscales of the Functional Assessment of Cancer Therapy; PSQI, Pittsburgh Sleep Quality Index; MFSI-SF, Multidimensional Fatigue Symptom Inventory Short Form; SDS, Symptom Distress Scale; SDI, Symptom Distress Inventory; HCA, hierarchical cluster analysis; CFA, confirmatory factor analysis; EFA, explanatory factor analysis; NCI CTC, National Cancer Institute Common Toxicity Criteria; POMS, Profile of Mood States; FACT, Functional Assessment of Cancer Therapy; PSET, Physical Symptom Experience Tool; MSAS, Memorial Symptom Assessment Scale; MDASI, M.D. Anderson Symptom Inventory; ESAS, Edmonton Symptom Assessment Scale; C-PET, Checklist for Patients with Endocrine Therapy; IBCSG, International Breast Cancer Study; EORTC QLQ-C30, European Organization for Research and Treatment of Cancer Quality of Life Questionnaire; ULL, upper limb lymhedema; WCLS, Wesley Clinic Lymhedema Scale; FACT-Hep EWB, Functional Assessment of Cancer Therapy-Hepatobiliary Emotional Well-Being; SQLI, Spitzer Quality of Life Index; FSI, Fatigue Symptom Inventory.
Cluster analysis
Cluster analysis is used either to group subjects or symptoms. Patients are clustered into subgroups based upon particular common symptoms. 77 This is very different from clustering symptoms into groups, since individuals can experience multiple symptom clusters. HCA uses co-occurrences between pairs of symptoms to form clusters similar to gene mapping; this is usually conducted post hoc. The number of symptoms included and cluster content depends on the assessment instrument, and statistical cut-off value for significant correlation level.
Factor and principal component analysis
Factor analysis and PCA are used when validating symptom assessment instruments. This technique combines symptoms from datasets by assigning several symptoms into one group that is relatively independent in associations with other groups of symptoms. The underlying factors or components are based on the statistical strength within a correlational matrix. Correlations are not based on a single dependent symptom variable unlike multiple regression analysis used in identification of clinical SC. Internal consistency (tested by Cronbach α coefficient) is an other statistical method used to determine consistency. 84 An α value >0.7 or even 0.9 for clinical purposes supports internal consistency. 85 There are two types of factor analysis: exploratory (EFA) and confirmatory (CFA). EFA establishes the strength of relationship between symptoms, and determines the symptom factor structure, which explains the maximum amount of variance. CFA establishes the validity the factor model in the settings of convergent and divergent validity. EFA generates a theory about a cluster construct, while CFA uses a model supported by theory or previous research to validate a cluster. 86 Cluster studies that use only EFA should be interpreted as exploratory and associations should not be mistaken for causation. Therefore, any cluster also needs to be critically examined to see whether it is clinically consistent.
Controversies
Fatigue clusters: Role of primary cancer site or disease stage
Fatigue was sound to be the most frequent dependant symptom variable. Despite differences in population and design, fatigue consistently clustered with pain. 76 Fatigue-insomnia, fatigue-depression, and depression-pain clustered less so.8,30,76,87–93 The depression-fatigue cluster had a consistent negative effect on QOL across all studies.25,30,31 The fatigue-pain relationship varied based on pain severity, fatigue duration, disease stage, and treatment.94,95 Time of data collection during therapy affected symptom severity within a cluster. 20 Depression-fatigue-insomnia-pain cluster was associated with the lowest KPS and worst QOL when these symptoms were severe, and vice versa. 77 Correlations between fatigue and anxiety or depression were weak in advanced cancer but strong in healthy controls.15,96 In advanced lung cancer, fatigue correlated with depression. 97 Two studies (and a clinical review) found severe fatigue clustered with dyspnea in advanced cancer.96,97 Fatigue, pain, lack of appetite, dry mouth, insomnia, and drowsiness formed a “sickness cluster” in those with advanced cancer undergoing chemotherapy or radiation therapy.9,47,64
Depression clusters: Symptom numbers and severity
The depression-fatigue-pain cluster during palliative radiation had different relationships which depended on symptom severity. Depression correlated with both pain and fatigue in different regression models depending on severity. 15 Depression-fever-pain-trouble sleeping were one cluster, depression-fatigue-dyspnea-trouble sleeping another. Symptoms can participate in different clusters based on severity. 15 Another study identified SC based on change in severity over time. 64 Both symptom prevalence and severity seem important in cluster analysis. Limited symptom numbers and different time frames for assessment “past month” and “past week” also influenced these symptom interactions, and consequent cluster composition.15,76
Depression, fatigue and pain: Statistical methods and populations
Clusters of clinically selected symptoms involve depression, fever, fatigue, pain, dyspnea, and weight loss. Such clusters differ based on disease stage, population, symptom severity, and symptom number. 15 Methodology also influences cluster composition. By HCA the relationship between depression, fatigue, and pain is inconsistent, although these symptoms cluster by factor analysis.9,44,46,47 Differences in the symptom domains used may have influenced the cluster composition. 7 In general, factor analysis uses symptom severity and distress; whereas HCA uses prevalence data.
Study populations also influenced the SC independent of statistical method. In newly diagnosed lung cancer, fatigue did not cluster with depression and pain by factor analysis.43,44 The three symptoms clustered by the same method in breast cancer after completion of chemotherapy. 49 Depression, fatigue, and pain clustered by HCA at various stages of breast cancer 46 but not in advanced cancer. 10 Variability in the depression-fatigue-pain cluster (analyzed by factor analysis or HCA) suggests either a multiple or complex symptom etiology, or an important influence of the statistical analysis itself.
Clusters and Body Systems
Gastrointestinal symptoms: Clusters and assessment instruments
Nausea and vomiting clustered consistently.9,10,44,98–100 Constipation also clustered with pain. 10 Other gastrointestinal (GI) symptoms are found in various clusters: anorexia with nausea and vomiting,44,45,49,99 dry mouth, 72 constipation and dry mouth, 34 or with early satiety, weight loss, and taste changes.10,91 In four studies anorexia clustered with fatigue, weight loss, and certain GI symptoms.10,43,44,61 Dry mouth and early satiety are common, but are infrequently included in cancer symptom assessment instruments. This will significantly bias any cluster identified by these instruments.
Respiratory symptoms: Same symptoms, different clusters
Dyspnea consistently clusters with cough10,45 but also with dysphagia and muscle weakness. 10 This suggests that dyspnea has multiple mechanisms (e.g., muscle wasting, diaphragmatic fatigue). Dyspnea also clusters with insomnia and memory problems, perhaps from a neuropsychological etiology.45,101
Psychologic symptoms: Are they a cluster?
Anxiety and depression cluster together consistently.10,46 Insomnia and/or drowsiness cluster with anxiety and/or depression,10,100 cough and difficulty breathing, 45 pain, fatigue, anorexia, 5 and cognitive symptoms. 102 Two studies found that anxiety and depression clustered before and after palliative radiotherapy.37,53 Similar cluster patterns involving various affective symptoms are reported in other studies.9,67,69
Cluster Validity
Methodological heterogeneity makes it difficult to draw firm conclusions about cluster validity and reliability. Neither clinical nor statistical symptom associations can be interpreted as causal.4,14,17,103 The clinical relevance of cancer SC is still not defined. Clinically defined SC explore symptom interrelations only between two symptoms (or correlate a single symptom with function, PS, and comorbidities).18,77 They cannot be used to validate SC that contain more than two symptoms without comprehensive data collection. In addition, low to moderate statistical correlations (r<0.5) were frequently used as significant values for such clusters; this is unconvincing evidence. Clusters during or after antitumor treatment cannot be generalized to advanced cancer.82,102
Factor analysis or HCA objectively examines nonrandom symptom distribution without a preconceived relationship as a bias. Neither factor analysis nor HCA will correct for assessment bias; both are sensitive to outliers. 104 It is unclear if a single factor or a cluster of a limited symptom numbers can form a separate cluster with any reasonable internal consistency.9,91 Clusters identified by HCA but have low to moderate correlation (r<0.70) should be treated cautiously. If clinically validated against patient outcomes, they might suggest a common underlying mechanism.8-10,13,43,44,46,98
Few SC have been consistently reproduced even using similar assessment instruments and methods.9,43,44,47,98 Consistent symptom pairs such as nausea-vomiting, anxiety-depression were nevertheless identified as clusters by both methods, and thus support the cluster concept.9,10,45,99 All studies involve significant subjective judgments about symptom numbers, dimensions, time frame, and correlation coefficients.
Cancer Symptom Clusters and Patient Care
The National Hospice Study endorsed a common terminal pathway in advanced cancer. 105 Others believe specific symptoms in terminal illness differ in prevalence, severity, and association, and depend on the disease. 106 Pain, fatigue, depression, and insomnia (although frequently clustered clinically) do not cluster consistently by statistical analysis. This supports the idea of complex symptom interrelationships, and also challenges the clinical utility of this particular cluster.
Presumably a common mechanism for some SC may exist, e.g., cytokine-induced symptoms.79–81 Treatment of one symptom may positively influence the rest within the cluster. A common cluster pathophysiology would thus facilitate both assessment and optimize treatment. Symptoms within clusters may respond similarly to drug regimens. There is some evidence that this is true for gastrointestinal 107 and psychologic 108 symptoms. Specific treatment may not produce the same response for symptoms within a cluster. 108 Nausea and vomiting after chemotherapy is an example of a consistent treatment-related cluster.9,47 Both improve with antiemetics. Opioids suppress cough and dyspnea 109 ; this is not true however for pain and constipation, the latter worsens with opioids.
Future Research
In this comprehensive clinical review, SC had an important clinical implication in cancer assessment, and symptom control although the clinical message of some clusters is unclear. Cluster type and composition depends on the populations, disease stage, assessment method (e.g., symptom domain, chronology, symptom wording), instrument, timeframe, and statistical method. All symptoms within a cluster should be considered and targeted for assessment and intervention; otherwise important therapeutic benefits might be overlooked. The link between individual clusters and specific pathophysiologic mechanisms is still unknown; this challenges the mechanistic cluster theory. Association does not mean causation; symptoms may cluster, but actually be indirectly related, i.e., pain, opioids, and constipation. Longitudinal cluster studies are needed to examine such relationships. Clinically and statistically identified cluster symptoms should be evaluated within treatment outcomes. A consensus around any statistical methodology employed should be established. Cluster methodology is not well established. Limited research data provides some methodological guidance. For cluster validation, symptom numbers, dimensions, timeframe, and scales are to be explicit and uniform. Clusters may change with disease stage. Different SC may also occur due to the cancer, or a result of antitumor treatment. Relationships between neuroimmunologic responses, proinflammatory cytokines, and SC need to be explored. Given a relationship between clusters and a specific biologic mechanism, a single treatment may ameliorate all symptoms within that cluster, rather than any individual symptom. Any relationship between cancer prognosis and SC also needs to be explored further.
Footnotes
Acknowledgments
Jordanka Kirkova was partially supported by a fellowship grant in end-of-life care from the Mt. Sinai Health Care Foundation. The Harry R. Horvitz Center for Palliative Medicine is a World Health Organization Demonstration Project in Palliative Medicine and an ESMO Designated Center of Integrated Oncology and Palliative Care.
Author Disclosure Statement
The authors declared no conflicts of interest with respect to authorship and/or publication of this article.
The authors received no financial support for the research and/or authorship of this article.
| The following key words and search processes were used in this study: |
| 1. MEDLINE (OVID) review was performed using the following key words: (neoplasms) AND (symptom cluster (words with any ending, in either order, in the article title, abstract, or indexing) OR symptom constellation OR concurrent symptom OR cluster study OR cluster studies OR multiple symptoms). |
| 2. The study abstracts were examined by two individuals (J.K. and A.A.) independently. |
| 3. Reference search by hand was performed using hard copies of the studies identified through MEDLINE. |
| 4. Full texts selected for the review were independently assessed by J.K. and A.A. |