
Abstract
Abstract
Background:
The Palliative Performance Scale (PPS) is a tool that is widely used to predict end of life. In Ontario, Canada, the PPS is used to mark the terminal phase of life and eligibility for terminal care.
Objective:
The aim of this retrospective study was to confirm that a PPS level of 40% can be used as a marker for the terminal phase of life.
Method:
PPS levels from 78 patients were calculated based on the intake reports made at admission to an inpatient hospice.
Results:
Although 77 patients passed away within a period of 3 months, PPS levels at admission varied from 10% to 70%. Fifty-six percent of all patients had a PPS level of 40% or less. Regarding survival, three significant PPS profiles, consisting of two or more PPS levels could be distinguished.
Introduction
D
The PPS was introduced as a systematic tool for end-of-life prognostication by Anderson et al. 2 in 1996 and is basically a modification of the Karnofsky Performance Scale. 3 It represents an observational instrument, which requires no effort from the patient and that consists of the 5 functional domains: ambulation, activity level and evidence of disease, self-care, oral intake, and level of consciousness. Each of the 5 domains is divided into 11 levels ranging from 0% to 100% (10% increments). The overall PPS level reflects the best composite of the 5 domains and has been suggested to be a rather valid and reliable instrument in end-of-life prognostication.4–7 Higher PPS levels are associated with longer survival times. However, the level of discrimination between different PPS levels regarding prediction of life expectation is questioned in current literature. While Morita et al., 8 Harrold et al., 4 and Head et al. 9 reported a lack of distinction between PPS levels regarding life expectancy and suggested that 2 or more PPS levels should be combined, Lau et al. 10 found distinct survival curves from a PPS level of 10% through 50%. The differences between these studies can be explained by size and characteristics of the patient populations. Morita et al. 8 studied a population of patients with cancer and found differences in survival times between groups when patients with a PPS level of 10% or 20% were compared to a group patients with a PPS level between 30% and 50% or to a group of patients with PPS levels above 50%. Similarly, Cancer Care Ontario published the Palliative Care Collaborative Care Plans (CCPs) in 2013. These consist of three separate plans in accordance with the PPS level: the Stable Stage (PPS 100% through 80%), the Transitional Stage (PPS 70% through 40%), and the End-of-Life Stage (PPS 30% through 0%).11,12 In order to prepare patients for the end-of life stage, a PPS level of 40% or lower is used to determine eligibility for hospice care. The PPS is also used as an instrument to determine whether or not a patient qualifies for home nursing care programs. 5 Harrold et al. 4 concluded that the PPS is useful in confirming hospice eligibility for reimbursement purposes and in guiding plans for hospice care.
In The Netherlands, the physicians' subjective estimate of life expectancy is used as an indicator in determining the terminal phase of life and eligibility for hospice care, whereas the PPS plays only a minor role as an instrument to predict life expectancy or to determine hospice eligibility. In this pilot study we aim to determine the additional value of using the PPS in marking the terminal phase of life using established cutoff points and the eligibility for hospice care, with a focus on patients with cancer.
Methods
In order to assess the usefulness of the PPS in determining the terminal phase this retrospective patient record study was performed under the following assumptions: (1) adequate determination of the terminal phase and therefore hospice admission is accepted for those patients who have an estimated length of life of 3 months (92 days) or less; (2) taking the PPS level of 40% or less as a reference point, all patients admitted to the hospice should have a PPS value of 40% or less; (3) a positive correlation should be found between length of stay in a hospice and the score on the PPS; and (4) significant differences should be found between different PPS severity profiles as established by Morita et al. 8 in terms of length of stay. This retrospective study was performed using patient records from a high-care hospice in Amsterdam. Before admission to the hospice, an intake report was made for each patient in a systematic and structured manner, containing all the information required to determine the PPS. All intake reports from patients admitted to the residential hospice in 2010 with an indication for terminal care and cancer as primary diagnosis have been included in this study. Intake forms were screened by a resident in anaesthesiology, pain management, and palliative care (S.B.). Patient characteristics (age, gender, disease) and scores for the five domains of the PPS were derived from the intake report. The overall PPS score was determined as described by Anderson et al. 2 The patient file was used to determine the length of stay, which was the time between admission and death of the patient. Questions regarding the interpretation of the intake form were discussed with the medical manager, responsible for patient administration.
Data storage, presentation, and analysis
Data relating to each patient were collected in an Excel spread sheet (Microsoft® version 2010, Redmond, WA). Data were represented as counts, percentages, means and standard deviations (SD), or medians and interquartile ranges (IQR) where appropriate based on the type of data and distribution. For visual representation of length of stay (i.e., survival) Kaplan-Meier curves were used. Correlation between length of stay and PPS score was expressed by means of Spearman's ρ, in which coefficients between 0.25 and 0.50 were considered to be fair, between 0.50 and 0.75 moderate to good, and higher than 0.75, excellent. 13 The percentage of variability explained by the observed association is calculated by 100r 2 . 14 We used the profiles as suggested by Morita et al. 8 Profile 1 contained PPS levels of 10% and 20%; profile 2 contained PPS levels of 30%, 40%, and 50%; and profile 3 contained all PPS levels above 50%. Statistical differences between profiles were analysed using the Kruskall-Wallis test, and subsequently the Mann-Whitney U test for further post-hoc exploration. All statistical analyses were performed with SPSS version 18 (SPSS Inc., Chicago, IL), with a two-sided p value<0.05 indicating statistical significance.
Results
Of all the patients admitted to the residential hospice, 78 patients met the criteria (diagnosed with cancer and an indication for hospice care). There were no missing data with regard to information needed for determination of the PPS scores or patient characteristics. No further analysis was required regarding the interpretation of data from the medical records.
Of the 78 patients included in the study, 47 were male and 31 female. Mean age was 70.6 years (SD±13.7 years). The median length of survival after admission was 17 days (IQR 9–14 days). On admission, the PPS level varied from 10% to 70% (range, 10%–100%) with a median of 40% (IQR 30–50; Table 1).
PPS, Palliative Performance Scale.
Survival times of all patients, except one who survived 93 days, did not exceed 3 months (92 days), and fulfilled the Dutch criterion for eligibility for terminal care (Fig. 1). Thirty-nine patients passed away within 17 days of admission. Only 44 patients (56%) had a PPS level of 40% or less at the time of admission.
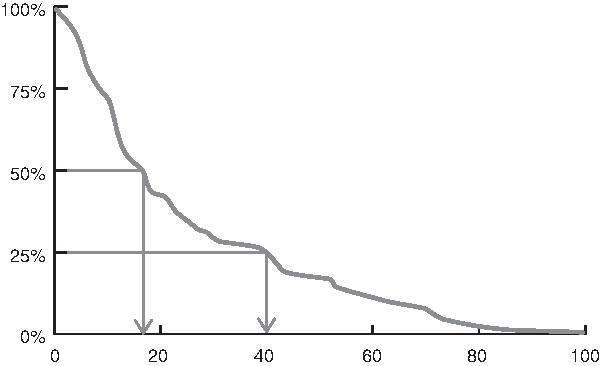
Kaplan-Meier survival curve of all included patients
Correlation between length of stay and PPS score was moderate (r=0.531, p<0.001).
In Figure 2 the survival times are presented in clustered PPS profiles as suggested by Morita et al. 8 Patients with a PPS level of 10% or 20% (n=15), had a median length of stay of 6 days (IQR 4–11) with a maximum of 30 days. Patients with a PPS level between 30% and 50% (n=50) had a median length of stay of 17.5 days (IQR 11.75–41.5) days with a maximum of 41 days. Patients with a PPS level above 50% (n=13) had a median length of stay of 41 days (IQR 22.5–75). The differences between PPS profiles with regard to the length of stay were statistically significant on general analysis (Kruskal-Wallis test; p<0.001) and all post-hoc paired analyses (Mann-Whitney U; p range 0.007 to<0.001).

Caption: Kaplan-Meier curves of combined PPS-levels at intake.
Discussion
This concise retrospective pilot study examined the additional value of using the PPS in end-of-life prognostication and hospice eligibility for Dutch patients with cancer. Based on the intake reports from all the patients included, a PPS level was determined. The PPS levels at intake varied between 10% and 70%. Almost all patients passed away within a period of 3 months, the main criterion in The Netherlands for eligibility for hospice care. Thirty-four of these patients (44%) had a PPS level of greater than 40%, which would not have met the criteria used in Ontario for eligibility for terminal care (PPS<50%).
Similar to Morita et al. 8 for a population of patients with cancer we used three PPS profiles (1: PPS 10%-20%; 2: PPS 30%–50%; 3: PPS>50%) for further analysis. We found significant differences between these profiles in median survival time (PPS 10%–20%: 6 days; PPS 30%–50%: 17.5 days; and PPS>50%:41 days). Interestingly the 50% survival rate at a given PPS level in our study is comparable with the data presented by Lau et al. 10
For interpretation and extrapolation of our data the following limitations should be considered.
First, our sample size is rather small so that subgroup analysis, for example based on gender and age, 10 is not possible. Second, we calculated the PPS level retrospectively, only based on the documented observations during intake of the patient. Normally the PPS is determined prospectively and based on the clinical judgement of best fit. A prospective study of adequate sample size is required, which would allow the opportunity to follow patients after admission and would provide real time determination of the PPS instead of a derivative from an intake document.
Finally, the profiles used to cluster the PPS levels (10%–20%, 30%–50%, and 60%–100%) are based on previous research done by other investigators. However, despite clustering the sample sizes of the individual clusters remained small. In addition, we cannot conclude on other clustering methods of PPS levels reported in literature. The differences in the median survival time between the three profiles were significant, the small sample sizes should be considered.
Conclusions
In this retrospective pilot study, 34 of the 78 patients (44%) did not meet the main requirement used in Ontario, Canada, to be eligible for hospice care (PPS level of 40% or lower). Nevertheless, all the patients in this retrospective study passed away within 3 months, the main condition for hospice care eligibility in The Netherlands. A prospective study is needed to confirm the results of this retrospective pilot study and to follow patients after admission during the last phase of their life. With a sufficient inclusion number of patients the influence of disease type, gender, and age could be specified.
Footnotes
Acknowledgments
We would like to thank Hospice Kuria in Amsterdam for supporting our study.
Author Disclosure Statement
No competing financial interests exist.