
Abstract
Abstract
Objective:
Loss of daily living functions can be a marker for end of life and possible hospice eligibility. Unfortunately, data on patient's functional abilities is not available in all settings. In this study we compare predictive accuracy of two indices designed to predict 6-month mortality among nursing home residents. One is based on traditional measures of functional deterioration and the other on patients' diagnoses and demography.
Methods:
We created the Hospice ELigibility Prediction (HELP) Index by examining mortality of 140,699 Veterans Administration (VA) nursing home residents. For these nursing home residents, the available data on history of hospital admissions were divided into training (112,897 cases) and validation (27,832 cases) sets. The training data were used to estimate the parameters of the HELP Index based on (1) diagnoses, (2) age on admission, and (3) number of diagnoses at admission. The validation data were used to assess the accuracy of predictions of the HELP Index. The cross-validated accuracy of the HELP Index was compared with the Barthel Index (BI) of functional ability obtained from 296,052 VA nursing home residents. A receiver operating characteristic curve was used to examine sensitivity and specificity of the predicted odds of mortality.
Results:
The area under the curve (AUC) for the HELP Index was 0.838. This was significantly (α <0.01) higher than the AUC for the BI of 0.692.
Conclusions:
For nursing home residents, comorbid diagnoses predict 6-month mortality more accurately than functional status. The HELP Index can be used to estimate 6-month mortality from hospital data and can guide prognostic discussions prior to and following nursing home admission.
Introduction
O
The decision to recommend hospice use is often made after an event leads to acute hospitalization and before return of the resident to the nursing home. Depending on where the decision is made, different data are available. Typically, in nursing homes functional data are available,12–16 whereas in hospitals diagnostic history is more readily available. Although functional status is a good prognostic indicator for cancer patients, this is not the case for the vast majority of other patients, such as residents with circulatory problems, dementia,17,18 pneumonia, 19 or cachexia. 20 For example, end-stage heart failure is not always accompanied by progressive loss of functional ability.21,22 Some heart failure patients have no functional deterioration prior to death and enjoy good to excellent quality of life between exacerbations.23–26 For these patients, reliance on functional ability would lead to inaccurate predictions. We examine the relative role of functional status and diagnoses in predicting mortality for nursing home patients.
Methods
Study approvals
Approval was obtained from the Bay Pines Veterans Administration (VA) Health Care System Institutional Review Board and Research and Development Committee prior to study commencement. Additionally, approval was acquired to conduct the study in the Veterans Administration Informatics and Computing Infrastructure (VINCI), a secure, password protected, virtual workspace with restricted access. VINCI personnel established a unique project workspace to which only approved personnel had access. Data were acquired from the Corporate Data Warehouse, which includes patient medical records, and the Minimum Data Set (MDS). Permission to use these data was acquired from VINCI and the Department of Veterans Affairs Office of Geriatrics and Extended Care Operations. All data were housed and all data analyses conducted in VINCI. All personnel with access to the data were granted access by VINCI personnel, and trained in security and privacy issues.
Sources of data
Data were obtained from electronic health records of veterans across 126 medical centers through VINCI. These data included all diagnoses for hospital admissions within the VA for nursing home patients within the VA system from 2003 to 2012. In addition, we obtained access to the MDS (version 2.0), a separate database kept for 296,052 residents of VA nursing homes. The merge of the two databases yielded 140,699 unique nursing home residents on which both sets of data were available.
Dependent variable
The dependent variable in the study was all-cause mortality within 6 months after discharge from the last hospital admission. Dates of death were verified from the Veterans Affairs Beneficiary Identification and Record Locator System File. The VA uses not only its own records but also reports of death from the Social Security Administration.
Measurement of Barthel Index
We used data obtained from the MDS to construct the Barthel Index (BI) for nursing home patients seen within the VA. The BI is applied frequently in geriatric populations to assess functional status according to an individual's ability to attend to activities of daily living. The index contains 10 items: feeding, bathing, grooming, dressing, bowels, bladder, toilet use, transfers, mobility, and stairs. Each of these items is rated according to level of independence. The sum of itemized scores produces a total score that ranges from 0 to 100 with lower scores indicating dependence. The BI has high inter-rater reliability (r=0.95) and test-retest reliability (r=0.87); as well as high internal consistency (Cronbach's α >0.80) and concurrent validity.27,28 To derive the BI, a crosswalk was created including items in the BI and corresponding items in the MDS. Assessment scales were then compared, and the MDS scores were converted to an equivalent BI score. For example, the MDS Item “Eating” was assessed as: 0=Independent; 1=Supervision; 2=Limited Assistance; 3=Extensive Assistance; and 4=Total Dependence. Scores on this item were converted to the corresponding BI item “Feeding,” which is assessed as: 0=Unable; 5=Needs help cutting, spreading butter, etc.; and 10=independent. The MDS score for “Eating” was converted to “Feeding” as follows: MDS=3 or 4, BI=0; MDS=1 or 2, BI=5; and MDS=0, BI=10). A computer algorithm was designed to automatically convert MDS to BI scores, applied to the dataset, and total BI scores calculated. Cases missing any of the BI items were excluded. A total of 1,153,131 BI scores for 296,052 unique nursing home residents was calculated. The most recent BI score was used for prediction of mortality.
Measurement of HELP Index
The Hospice ELigibility Prediction (HELP) Index was calculated using the steps proposed by Alemi and Walter
29
and later validated in claims-based measures of severity for childhood diseases
30
and in predicting severity of heart failure.
31
The independent variables used to predict probability of mortality in the next 6-moanths included:
1. Hospital diagnoses: Each unique diagnosis, as indicated by the International Classification of Diseases, 9th Revision (ICD-9), within a hospital discharge was considered a separate indicator variable. This leads to many independent variables, some of which occur too rarely to obtain a stable estimate of the effect. In these situations, the hierarchical structure of the ICD-9 codes was used to identify a broader category. A typical ICD-9 code has 6 digits. For the purposes of specifying diagnoses for this model, the first 5 digits were used to indicate the diagnosis without classifying it into subgroups within the diagnosis. The first 3 digits were used to indicate a large category of diagnoses. There were 8073 unique 6-digit, 1450 unique 5-digit, and 453 unique 3-digit hospital diagnoses codes in the training cases. Hospital diagnoses in the validation set that did not match to 6-, 5-, or 3-digit codes were not scored and de facto were assumed to be irrelevant in predicting mortality. 2. Age on admission: Patients age on admission was calculated as the difference from year of birth to date of admission. 3. Number of diagnoses in the last hospital admission: The number of diagnoses on admission in the training dataset ranged from patients with 1 diagnosis to patients with more than 14 diagnoses on admission.
The HELP Index was measured on 140,699 unique nursing home residents, for whom there were 365,786 admissions and 3,326,486 inpatient diagnoses.
Prediction of mortality in HELP Index
To predict the probability of mortality of a patient in the next 6 months, or to calculate the score for the HELP Index, we used the naïve Bayes approach. In this method, all variables are assumed to be independent of each other. This assumption is clearly false but serves as a first approximation of the estimate of the odds of mortality. In the naïve Bayes approach, the posterior odds of mortality is calculated as:
Table 1 shows an example of how Bayes model works. The case in Table 1 involves an 81 year old widow with 10 diagnoses on last admission. Some diagnoses (e.g. chronic airway obstruction not elsewhere classified) do not show in the online Table; these are ignored and scored with a likelihood ratio of 1. Once the likelihood ratio associated with each diagnosis has been looked up in the online table, the product of all likelihood ratios is calculated. In this case, we calculate it as 71.86. The product of the likelihood ratio is multiplied by the prior odds of 0.16 to obtain the posterior odds. The posterior odds can be expressed as a probability. This patient has 0.92 probability of dying in the next 6-months. The main reason for this high estimate has to do with lung cancer, anorexia and cachexia. The kidney disease and advanced age also contributed to the high probability of mortality.
Available online at http://hdl.handle.net/1902.29/11763 or by contacting corresponding author. Items marked as “Not found” are scored as 1, leading to no change in product of all likelihood ratios.
Variables are calculated on last admission.
Calculated as posterior odds divided by one plus the odds.
The likelihood ratios associated with each of the indicators are provided in a comma-separated file available online at http://hdl.handle.net/1902.29/11763. The file can be used to make calculations for any patients with known medical history and for whom coded ICD-9 data and age are available. The file is accompanied with description of columns, as well as a brief instruction on how to make calculations.
Methods of Analysis
In examining the validity of the HELP index, we split the data into two sets: training and validation sets. We used the training data set of 112,897 cases to calculate the severity scores associated with the diagnoses. The validation data set of 27,832 cases was used to test the accuracy of the predictions. The accuracy of predictions was calculated using the Area Under the Curve (AUC).47–49 We used the pROC function in R to calculate 95% confidence interval for the AUC from 2,000 stratified bootstrap replicates. The parameters of the Barthel Index were not derived from our training data set. Instead, we used the scoring procedure provided in the literature. For this reason, the combined validation and training data sets were used to calculate the accuracy of Barthel Index.
Results
Table 2 demonstrates similarities between the training and validation cohorts. As expected, the majority of subjects in a VA population were white males. Gender, marital status and race did not differ across the training and validation cases except for minor but statistically significant differences in rate of divorce and rate of missing information for race.
Statistically significant at level of 0.05.
Table 3 shows the top 20 most serious diagnoses observed in the data that repeat in at least 100 cases. The majority of diagnoses found to be highly predictive of 6-month mortality included malignancies such as malignant pleural effusion (LR 11.52) and secondary malignant neoplasms (brain and spinal cord (LR 8.03), kidney (LR 7.96), pleura (LR 7.72), some digestive organs (LR 7.60), spleen (LR 7.60), adrenal gland (LR 7.60), retroperitoneum & peritoneum (LR 6.30), lung (LR 5.77), liver (LR 5.67), pancreas (LR 5.62), mediastinum (LR 5.60), and other urinary organs(LR 5.60) in addition to neoplasm-related pain (LR 6.03). The other highly predictive diagnoses were history of cardiac arrest (LR 9.67), cardiogenic (LR 5.93) and septic shock (LR 5.70).
Figure 1 provides a Receiver Operator Curve for predicting 6-month mortality. The area under the curve, the C-statistic, was 0.838 for the HELP index and 0.692 for the Barthel index. The HELP index was significantly (alpha levels less than 0.01) more accurate than the Barthel index.
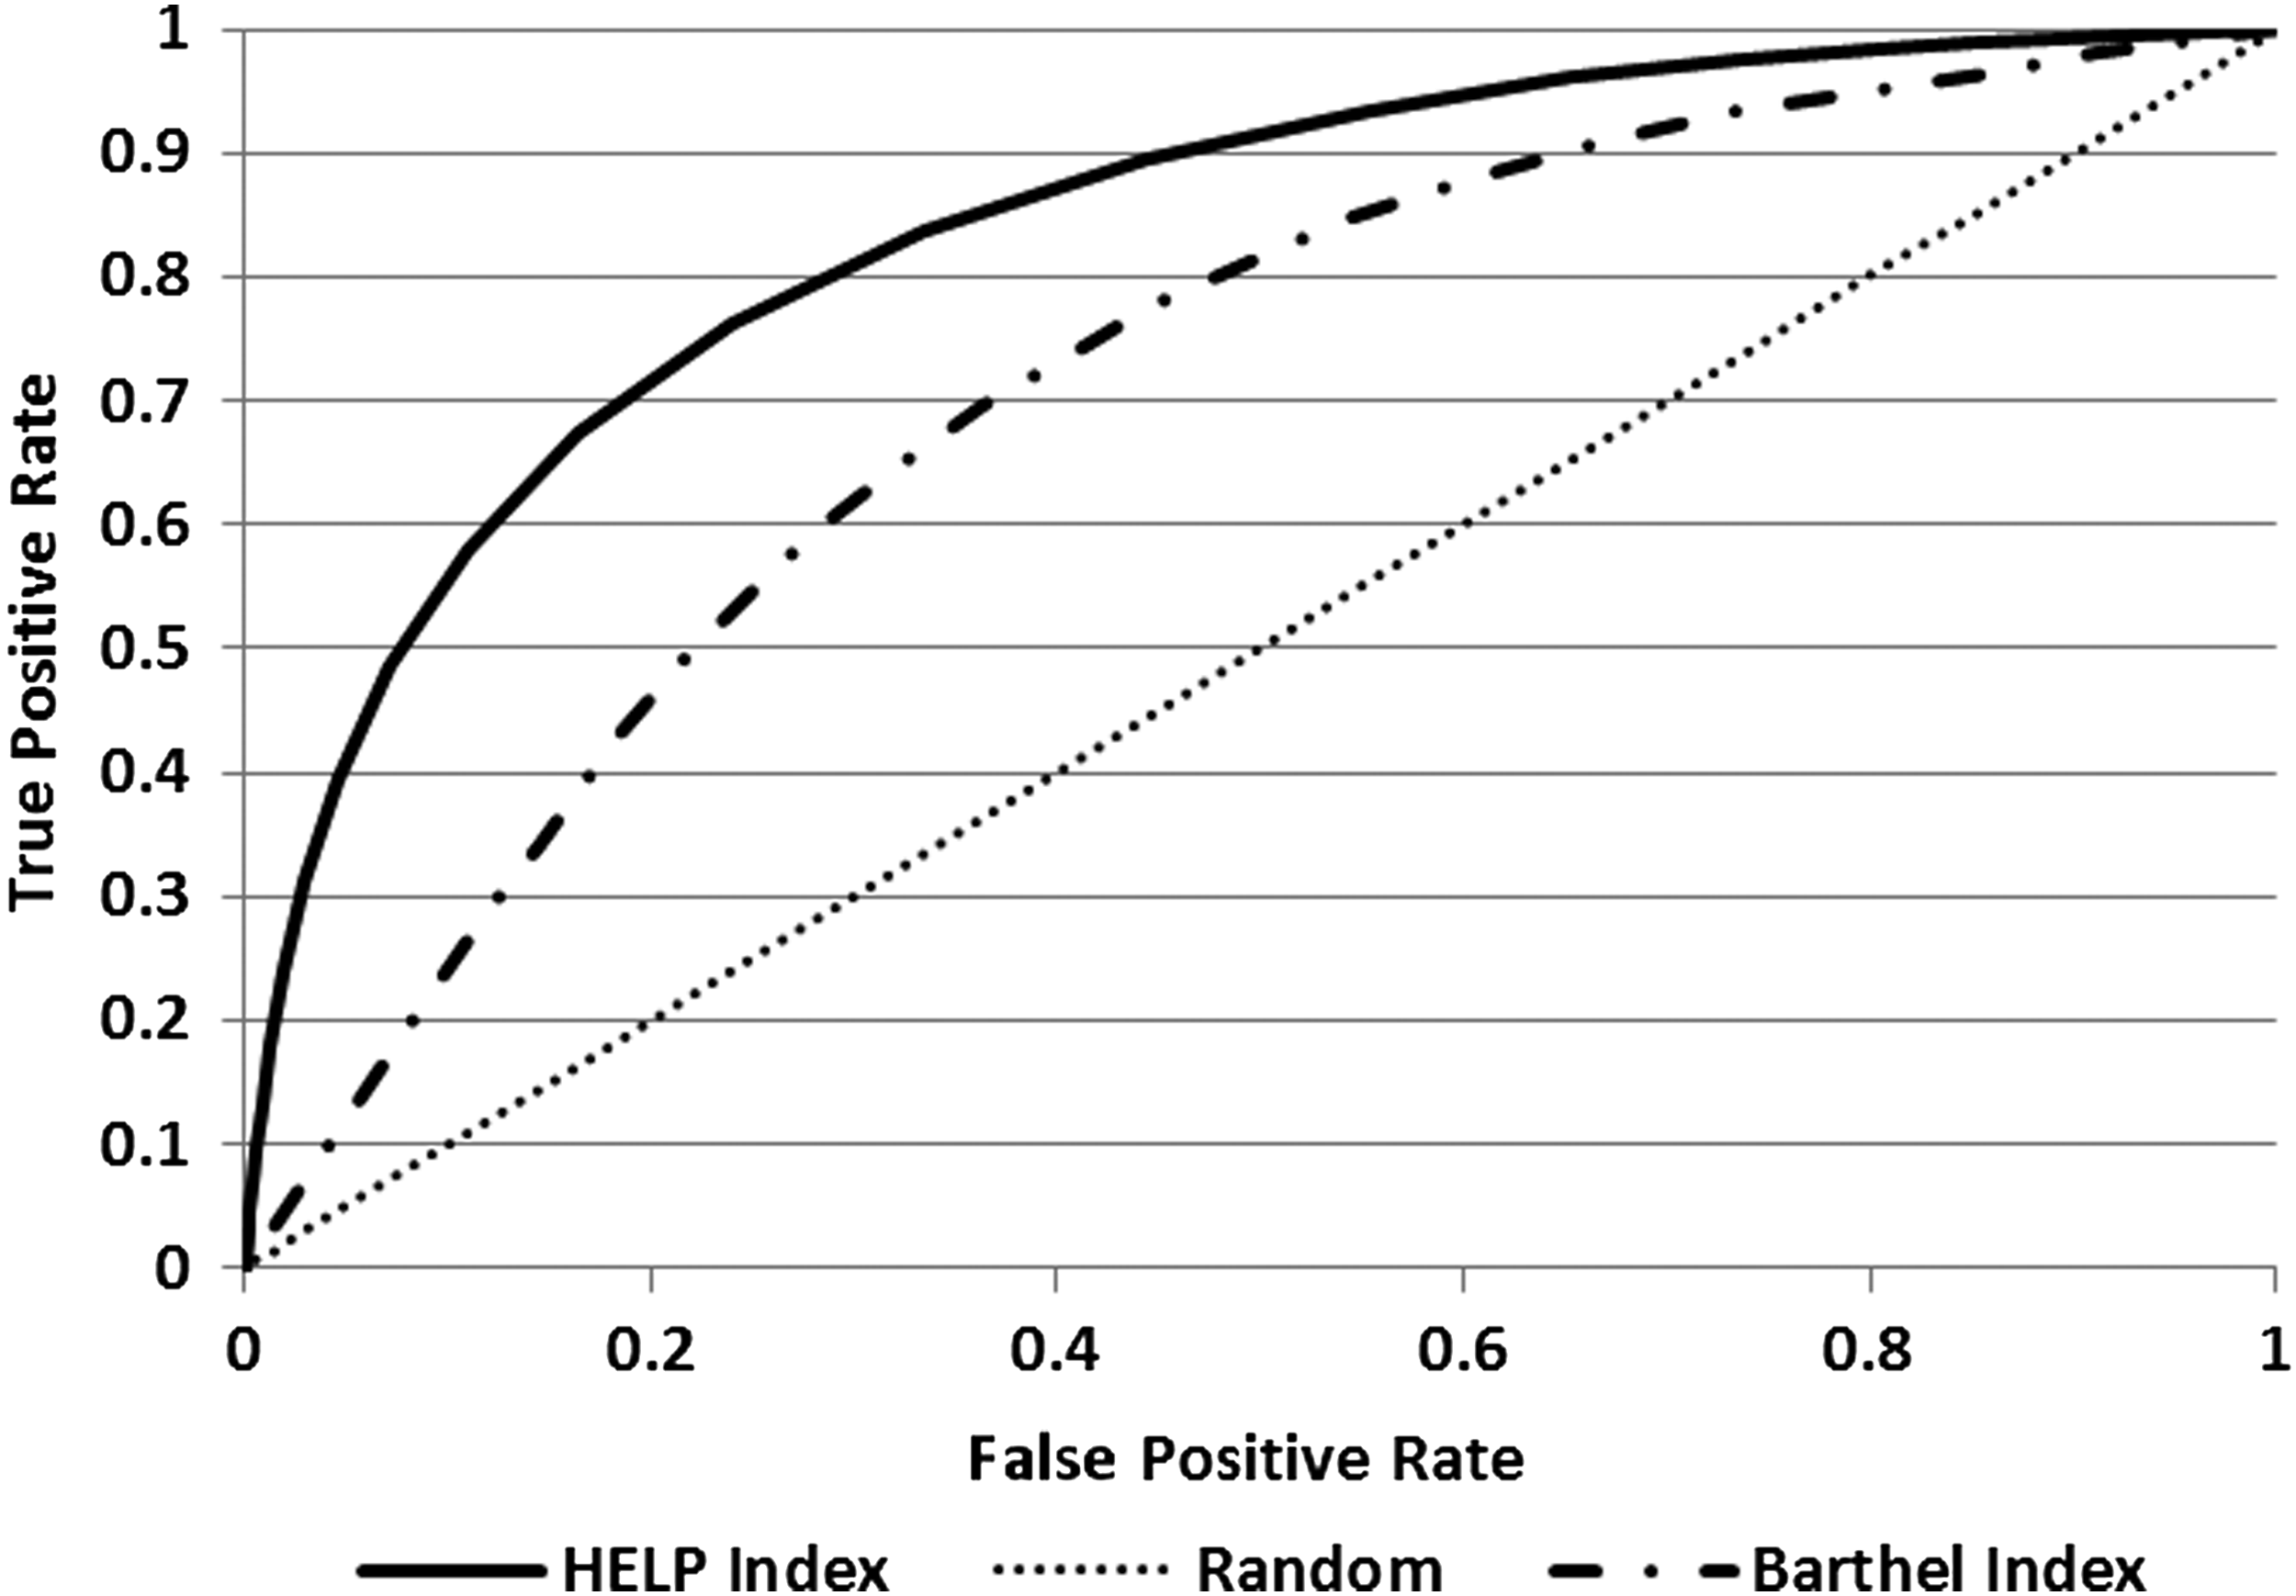
Receiver operator curve for predicting 6-month mortality.
Discussion
The HELP index constructed from the history of patients' diagnoses was more predictive of mortality in 6-months than the Barthel functional ability. This suggests that an index based on patients' diagnoses may be more useful than an index that is solely based on functional ability. It is possible, though not tested in the current paper, that if the HELP index was combined with the Barthel Index, it may achieve even higher accuracy levels.
A recent review of prognostic indices for older adults identified 16 validated indices that rely on a mix of functional abilities and/or diagnostic categories; none rely on individual diagnostic codes.32–48 The cross-validated AUC reported for these indices ranged from 0.68 to 0.82. The HELP index had a cross-validated AUC of 0.84, which was higher than the cross-validated AUC reported for these 16 indices. In 2010, Levy improved the Porock et al. index and obtained an AUC of 0.84. All indices reported in the literature use a mix of functional ability and groups of diagnoses. The HELP index achieved higher or equivalent level of accuracy exclusively with diagnoses.
For example, consider the Advanced Dementia Prognostic Tool.49–53 These investigators examined nineteen diagnostic categories: (1) diabetes mellitus, (2) arteriosclerotic heart disease, (3) cardiac dysrhythmias, (4) congestive heart failure, (5) hypertension, (6) peripheral vascular disease, (7) stroke, (8) Alzheimer's disease, (9) seizure disorder, (10) Parkinson's disease, (11) chronic obstructive pulmonary disease, (12) anemia, (13) cancer, (14) renal failure, (15) pneumonia or respiratory tract infection, (16) urinary tract infection, (17) other infections, (18) hip fracture prior, and (19) other (nonhip) fractures. The developers of this index found that in predicting mortality, none of these 19 diagnostic categories were as predictive as patients' functional abilities. They therefore abandoned the use of these broad diagnostic categories. In contrast, we relied on specific diagnoses (e.g., not all cancers but specific types of cancers). We found that relying on specific diagnoses leads to an index that is more predictive of mortality than functional disabilities.
There are several theoretical reasons why a model that predicts prognosis from diagnoses may be more accurate than one that is solely based on functional ability. As reviewed earlier, except for major cancers, many patients die without significant functional deterioration. For these patients, an index of functional ability will not provide correct guidance. In addition, many patients have temporary problems with function after illness or a major surgery. These problems often resolve, and thus using these temporary dysfunctions could be misleading. For hospitalized patients, diagnoses are readily available and may be used to conduct an initial screening of patients at elevated risk of dying within the next 6 months.
This study was done using data from nursing home patients within the VA. Veterans who use nursing home services represent a unique population. They differ in significant ways from civilian nursing home residents. For example, veterans are mostly male with multiple comorbidities. The index developed here may not extend to other populations with more women or with fewer comorbid conditions. Research is needed to examine the performance of the index developed here with independent datasets. Although this analysis illustrates that mortality of nursing home residents may be predictable from hospital records, use of this tool requires access to hospital data, which may be difficult in a system that is not integrated. The scoring of the HELP Index is time-consuming. One has to look up the likelihood ratios and find the corresponding ratio among thousands of reported items followed by a series of multiplications. All of this takes time and increases the possibility of error. We encourage automation of the HELP Index in electronic health records such that prognostic information can be generated automatically for clinicians and their patients.
Patients may use different hospitals and a merged dataset may not be available. However, in recent years, the use of electronic health records has made it possible to merge data from various providers and insurers. If these data are available, medical encounters may be more informative than functional ability in predicting patients' prognosis.
Although the HELP Index represents an improvement over current Medicare eligibility guidelines, an index with an AUC of 84% will be in error for 1 in 6 patients. A comprehensive approach may include the use of the HELP Index as an initial screen. For example, one can imagine a two-stage hospice eligibility review. At discharge from the hospital a screen could be performed electronically to determine if patient diagnoses suggest a prognosis of 6 months or less. For patients at risk, additional clinical review of functional ability could be performed to add to the prognostic information and generate appropriate palliative care consultation. Future research needs to explore the performance of combinations of diagnoses and functional ability in predicting mortality among nursing home residents.
Conclusions
Patients' diagnoses may be more accurate than functional disability in predicting 6-month mortality of patients. The HELP index represents a tool to assist clinicians and policy makers in identification of patients who have a prognosis of 6 months or less and who may be appropriate for hospice enrollment based on prognosis.
Footnotes
Acknowledgments
This project was funded by appropriation #3620160 from the VA Office of Geriatrics and Extended Care. We acknowledge the valuable guidance we received from Thomas Edes, MD, Chief of Geriatrics and Extended Care Operations and the National Medical Foster Home coordinators, Dan Goedken and Aida Fonseca. The research team also included James A. Blankenship, Lisa Argyros, Phan Giang, PhD, Willy Liao, MD, Etienne Pracht, PhD, and Bruce Citron, PhD. The views expressed in this paper do not represent the views of the VA.
Author Disclosure Statement
No competing financial interests exist.