




Abstract
Background:
The importance of high-quality care for terminal patients is being increasingly recognized; however, quality of care (QOC) and quality of death and dying (QOD) for noncancer patients remain unclear.
Objectives:
To clarify QOC and QOD according to places and causes of death.
Design, Subjects:
A nationwide mortality follow-back survey was conducted using death certificate data for cancer, heart disease, stroke syndrome, pneumonia, and kidney failure in Japan. The questionnaire was distributed to 115,816 bereaved family members between February 2019 and February 2020. Measurements included QOC, QOD, and symptoms during the last week of life. Analyses used generalized estimating equations adjusting for age, sex, and region.
Results:
Valid responses were returned by 62,576 (54.0%). Family-reported QOC and QOD by the place of death were significantly higher at home than in other places across all causes of death (for all combinations with hospital p < 0.01). In stroke syndrome and pneumonia, QOD significantly differed between hospital and home (stroke syndrome: 57.1 vs. 72.4, p < 0.001, effect size 0.77; pneumonia: 57.3 vs. 71.1, p < 0.001, effect size 0.78). No significant differences were observed in QOC and QOD between cancer and noncancer. The prevalence of symptoms was higher for cancer than for other causes of death.
Conclusions:
QOC and QOD were higher at home than in other places of death across all causes of death. The further expansion of end-of-life care options is crucial for improving QOC and QOD for all terminal patients.
Introduction
The specialty of end-of-life care grew out of oncology. In Japan, efforts to improve this type of care are expanding from cancer to noncancer patients. However, patients may not be adequately receiving the care they desire. Internationally, the importance of high-quality end-of-life care for noncancer patients is being increasingly recognized, particularly in countries with rapidly aging populations.1,2 In addition, the findings of a national questionnaire survey in the United Kingdom support the need for improved quality of care (QOC) for dying people and have been incorporated into U.K. policies.3,4
Population-based mortality follow-back designs have been used in several countries to evaluate end-of-life care.5–7 These surveys use death certificate data to examine a population of decedents and contact bereaved family members. This methodology represents an efficient data collection strategy with a clearly defined denominator. One approach involves conducting interviews with bereaved family members, which offer highly insightful perspectives despite being time and cost intensive.8,9 Questionnaire surveys are less insightful, but enable efficient nationwide data collection.
Previous studies compared family perceptions of end-of-life care by the place of death and disease.10–14 However, QOC and quality of death and dying (QOD) for terminal noncancer patients in Japan remain unclear.
Therefore, the present study examined family-reported outcomes of end-of-life care according to the locations and causes of death among patients with the five common causes of death (cancer, heart disease, stroke syndrome, pneumonia, and kidney failure). The investigation used a questionnaire survey using death certificate data in Japan.
Methods
Design and procedures
We conducted a cross-sectional, nationwide mortality follow-back survey. Two questionnaire surveys were distributed via postal mail to patients’ addresses in February 2019 and February 2020. We asked bereaved family members about the end-of-life experiences of decedents between 13 and 25 months after the patient died. Our feasibility study demonstrated the availability of mortality data based on death certificates as well as the acceptable response rate and representativeness of this survey method. 15
Study population
We used the most recent available mortality data from 2017 and 2018 for the survey. The inclusion criteria were as follows: (1) an age older than 20 years at death and (2) death at a hospital, long-term care facility, or at home. The 2017 target population included patients who died from any of the top five leading causes of death in Japan (cancer, heart disease, stroke syndrome, pneumonia, and renal failure), excluding natural and accidental deaths. In the 2018 target population, we added the sample size of cancer deaths for a prefecture-specific analysis to the cancer control evaluation. Japan has 47 prefectures.
A stratified random sample was used to generate national estimates of the end-of-life experiences of decedents, which was designed to select individuals who died of each cause of death for each place of death and each prefecture. The sample size was selected based on a 95% confidence level (n = 384 to achieve a 5% margin of error; n = 96 to achieve a 10% margin of error) by clustering subjects (cancer: 384 samples for each of the three places of death in 47 prefectures [141 stratification]; heart disease: 96 samples for each of the 47 prefectures; and others: 384 samples for the three places of death). Based on feasibility studies, the number of subjects was increased with an expected response rate in consideration of undeliverable questionnaires of 30–50% according to the causes of death. 15 We performed two surveys and distributed questionnaires to 135,037 bereaved families (Fig. 1).
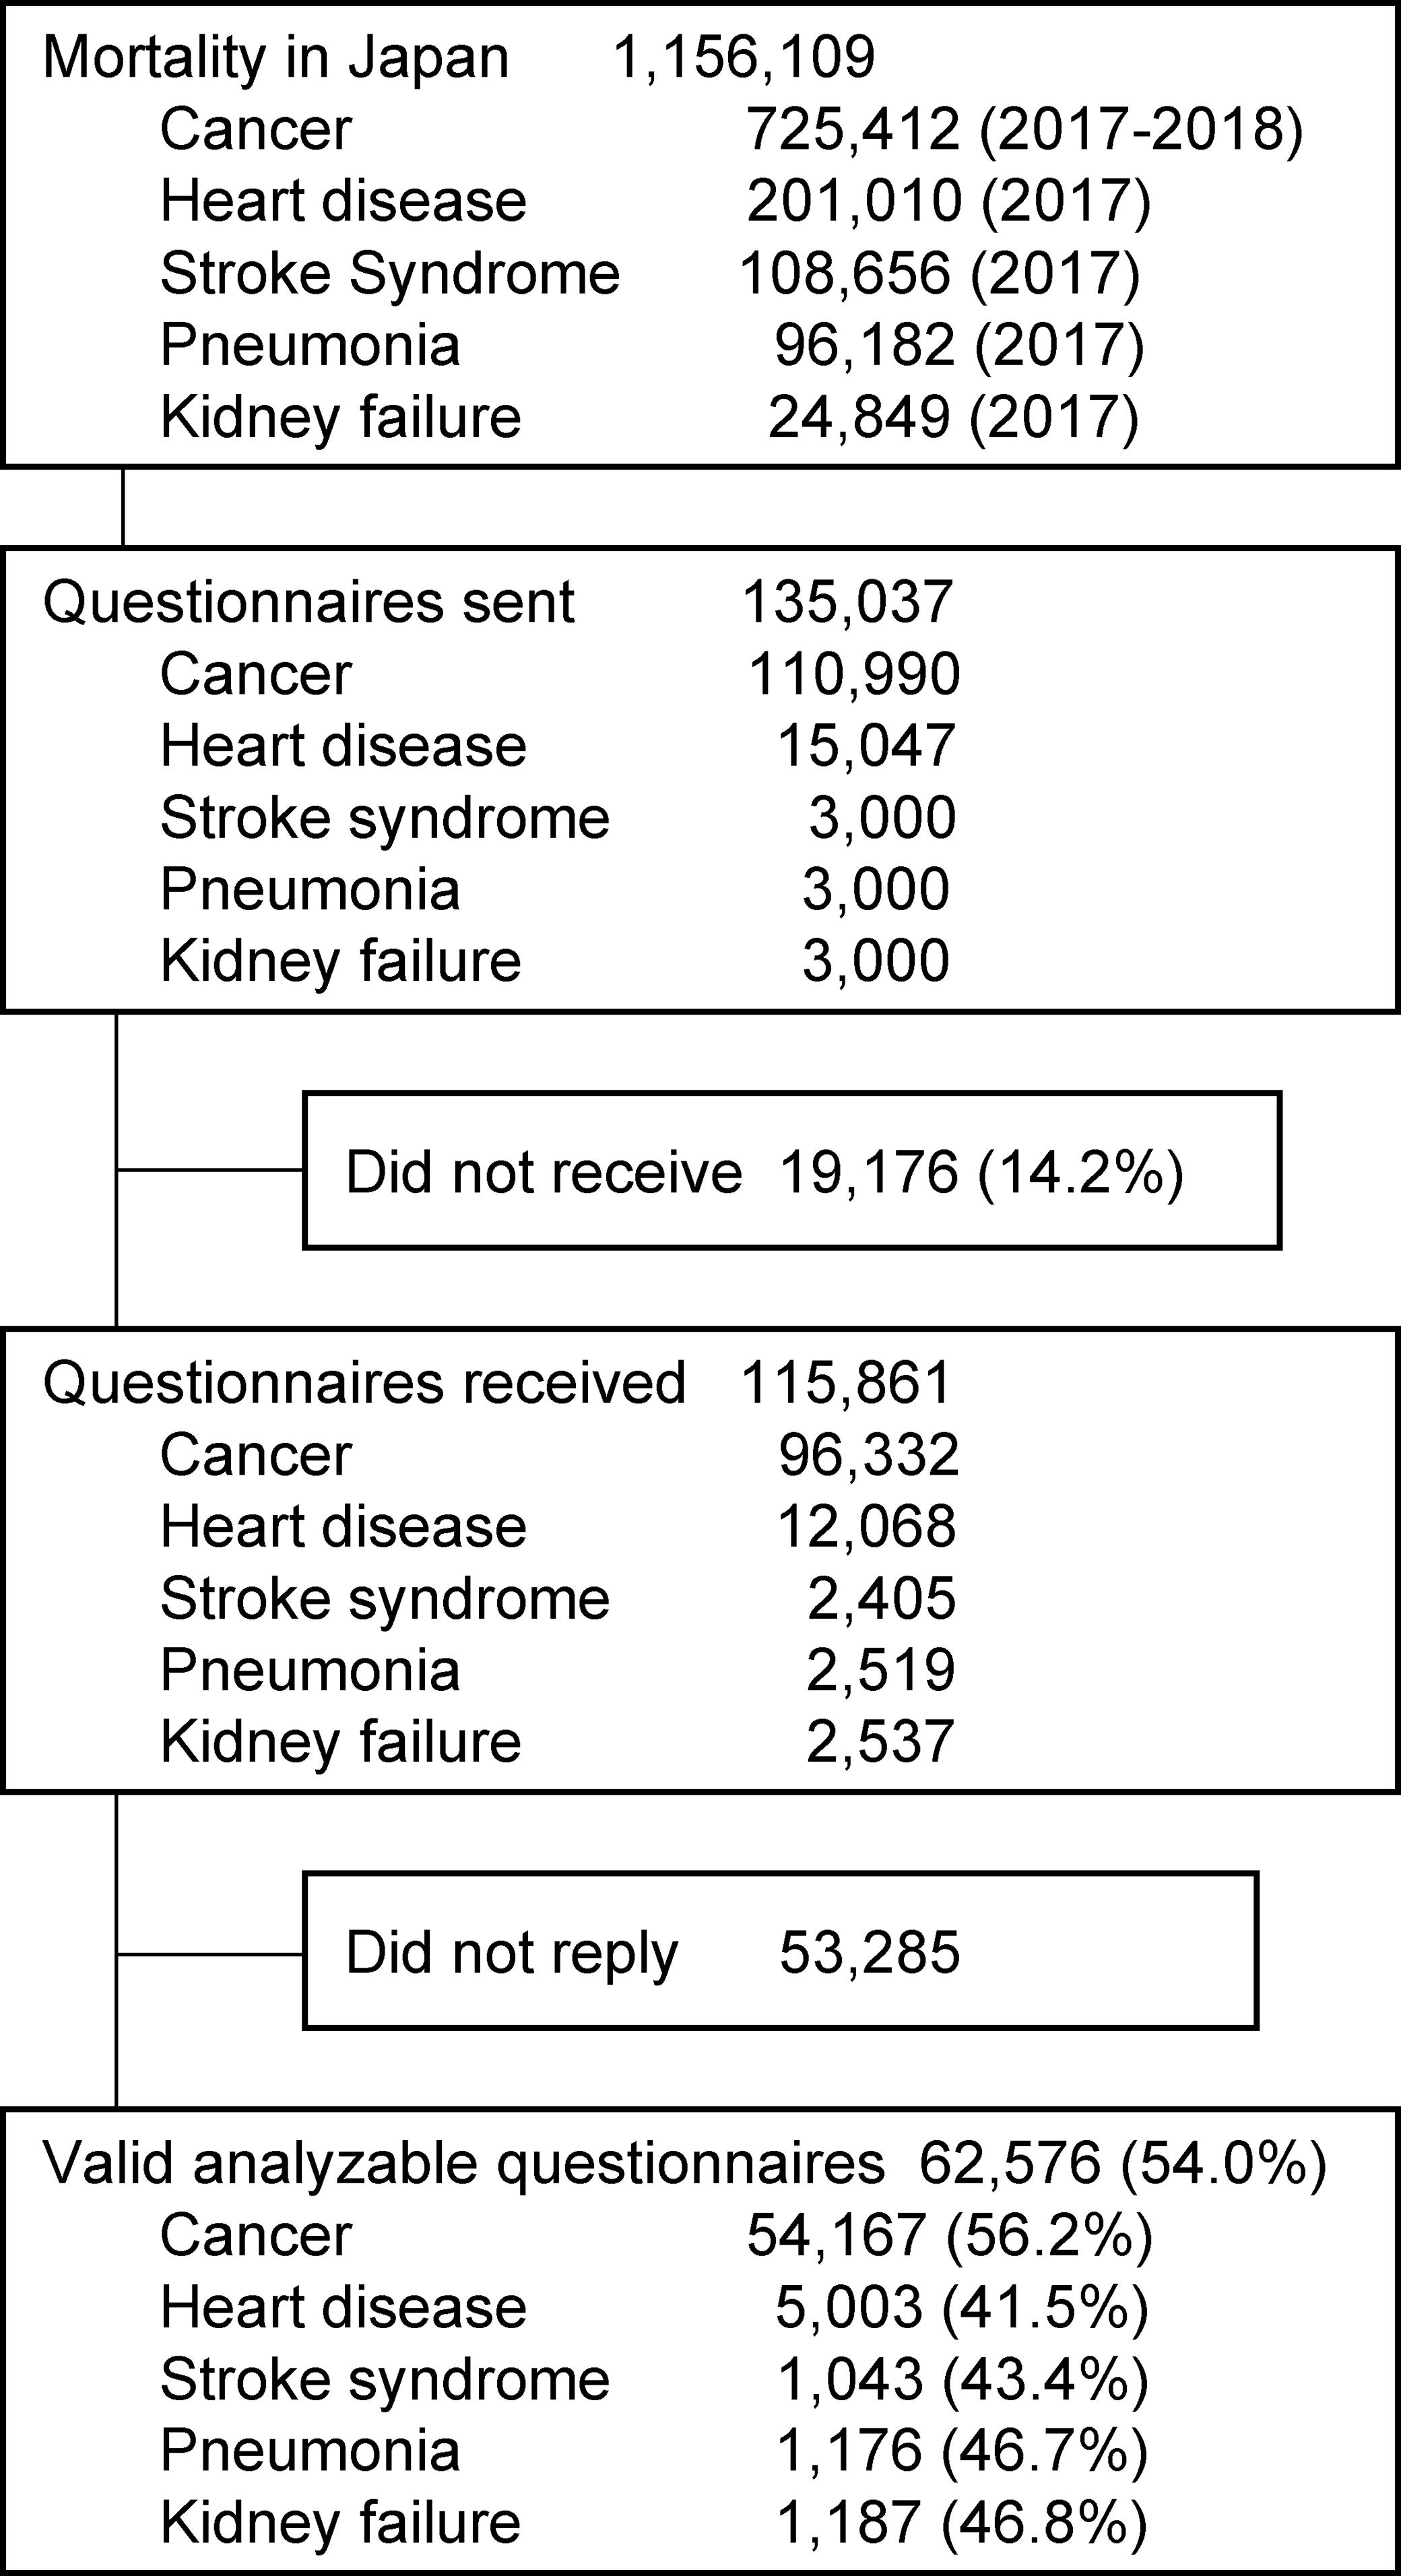
Flow of the mortality follow-back survey.
Outcomes
The main outcome was QOC received at the last place before death. Secondary outcomes were QOD in the last month of life and symptoms during the last seven days of life.
QOC at the last place before death
QOC was evaluated using the Japanese version of the Care Evaluation Scale 2.0 (CES). 16 The short version of CES has 10 domains representing concepts that are important to end-of-life care, including “physical care by physician” and “patient decision support.” We also assessed overall care satisfaction. CES was previously shown to have sufficient reliability and validity and has been used in large-scale quantitative studies.12,17–20 Family members were asked to rate QOC at the decedents’ last place of care using a 6-point Likert scale (ranging from 1: absolutely disagree to 6: absolutely agree).
Domain proportions were the percentage of respondents who answered between 4 (somewhat agree) and 6 (absolutely agree) for each subscore. The total score was obtained by the summation of 10 subscores and converted into a 100-point scale. A higher score indicated better QOC.
QOD in the last month of life
QOD was evaluated using the Japanese version of the Good Death Inventory (GDI). 21 The core items of the GDI consist of 10 domains representing concepts important to a good death, including “being free from physical distress” and “dying in a favorite place.” Furthermore, we evaluated pain relief using one item from the GDI. The GDI has sufficient reliability and validity and has been used in large-scale quantitative studies.12,17–20 Family members were asked to rate decedents’ experiences in their last month of life on a 7-point Likert scale (ranging from 1: absolutely disagree to 7: absolutely agree).
Domain proportions were the percentage of respondents who answered from 5 (somewhat agree) to 7 (absolutely agree) for each subscore. The total score was obtained by summation from 10 subscores and converted to a maximum of 100. A higher score indicated better QOD.
Severe symptoms during the last seven days of life
Severe symptoms of patients were evaluated using the Memorial Symptom Assessment Scale-Short Form (MSAS-SF) translated into Japanese. 22 Through discussions among researchers, we selected 11 symptoms (pain, lack of energy, nausea, drowsiness, difficulty sleeping, shortness of breath, itching, loss of appetite, difficulty swallowing, weight loss, and constipation) for assessment among patients dying of the five major causes of death. Family members were asked to rate decedents’ symptoms in the last week of life using a 5-point Likert scale (from 0: not at all to 4: very much). Domain proportions were the percentage of respondents who answered 3 (quite a bit) and 4 (very much). The MSAS-SF has demonstrated acceptable validity and has been used in previous studies.23–25
Statistical analysis and survey weights
To compare family ratings of each outcome among decedents by the three places of death and by the causes of death, we used Pearson’s χ2 test for discrete variables, the Student’s t-test for continuous variables, and ANOVA for variations among groups to examine unadjusted associations. Among cancer cases, four settings were utilized to discern palliative care unit (PCU) deaths included in hospital data. The identification of PCU deaths was distinguished based on family reports.
We used generalized estimating equations to estimate the outcomes of generalized linear models for clustering patients by the place and cause of death. To adjust for nonresponses to the surveys, we utilized inverse probability weighting. This method accounts for the nonresponse bias without relying on specific imputation models; therefore, it is suitable for nonresponses exhibiting complete missing data. Specifically, after fitting a logistic regression model predicting survey completion that included covariates using mortality data (age, sex, region, and place of death), we calculated the weight for each decedent equal to the reciprocal of the probability of that decedent’s family member completing the survey. The distributions of covariates were similar between the weighted nonresponse and weighted response groups (Supplementary Table S1).
We reported adjusted domain proportions, adjusted total score means, and p values for each outcome based on the place and cause of death. We compared each setting to hospital care and each cause of death to cancer. Effect sizes (ES) were assessed using Hedges’ g, according to which 0.2, 0.5, and 0.8 are regarded as small, moderate, and large effects, considering that a large sample size may lead to an excess of significant results.26,27
The original dataset included 14.7% missing outcomes (ranging from 4.6% for supporting family decision making for QOC to 32.5% for itching symptoms according to the MSAS). In the calculation of total score means for QOC and QOD, imputations were made using the mean of nonmissing outcomes in individuals under the guidance of the scale developer. We conducted a sensitivity analysis by repeating the main analysis using complete data for each outcome to assess how the results obtained may be affected by missing data imputations. Total scores for each outcome were similar between mean imputations and the complete data analysis.
In the analysis, we provided a comprehensive evaluation of end-of-life care that included cases of sudden death because their exclusion did not significantly impact the results. We added “unknown” as an option to all response choices. Responses marked as “unknown” by bereaved families were treated as missing to ensure data reliability. All analyses were performed with SAS 9.4 software (SAS Institute, Cary, NC).
Research ethics and patient consent
The National Cancer Center Japan Institutional Review Board approved this study (reference number 2017-346; date of approval June 5, 2018). Consent to participate in the study was assumed by completing and returning the questionnaire.
Results
Sample characteristics
Of the 115,816 family members who received the questionnaires, valid survey responses were returned by 62,576 (response rate: 54.0%; Fig. 1).
Table 1 shows the weighted proportions of sociodemographic characteristics by the cause of death. Cancer patients were younger (weighted mean, 77.4 y) than other causes of death (ranging from 84.0 y for stroke syndrome to 87.7 y for pneumonia). Pneumonia patients had the greatest comorbid dementia (weighted proportion, 49.1%).
Characteristics of Decedents by the Cause of Death
Data are presented as No. (%) unless otherwise noted. All data are weighted for survey nonresponses.
Weighted sample size adjusted for nonresponses to the survey using inverse probability weighting.
Data are calculated using death certificate data on vital statistics.
Quality outcomes by the place of death
Figure 2 shows the means of family-reported outcomes by the place of death. All values are shown in Supplementary Table S2.
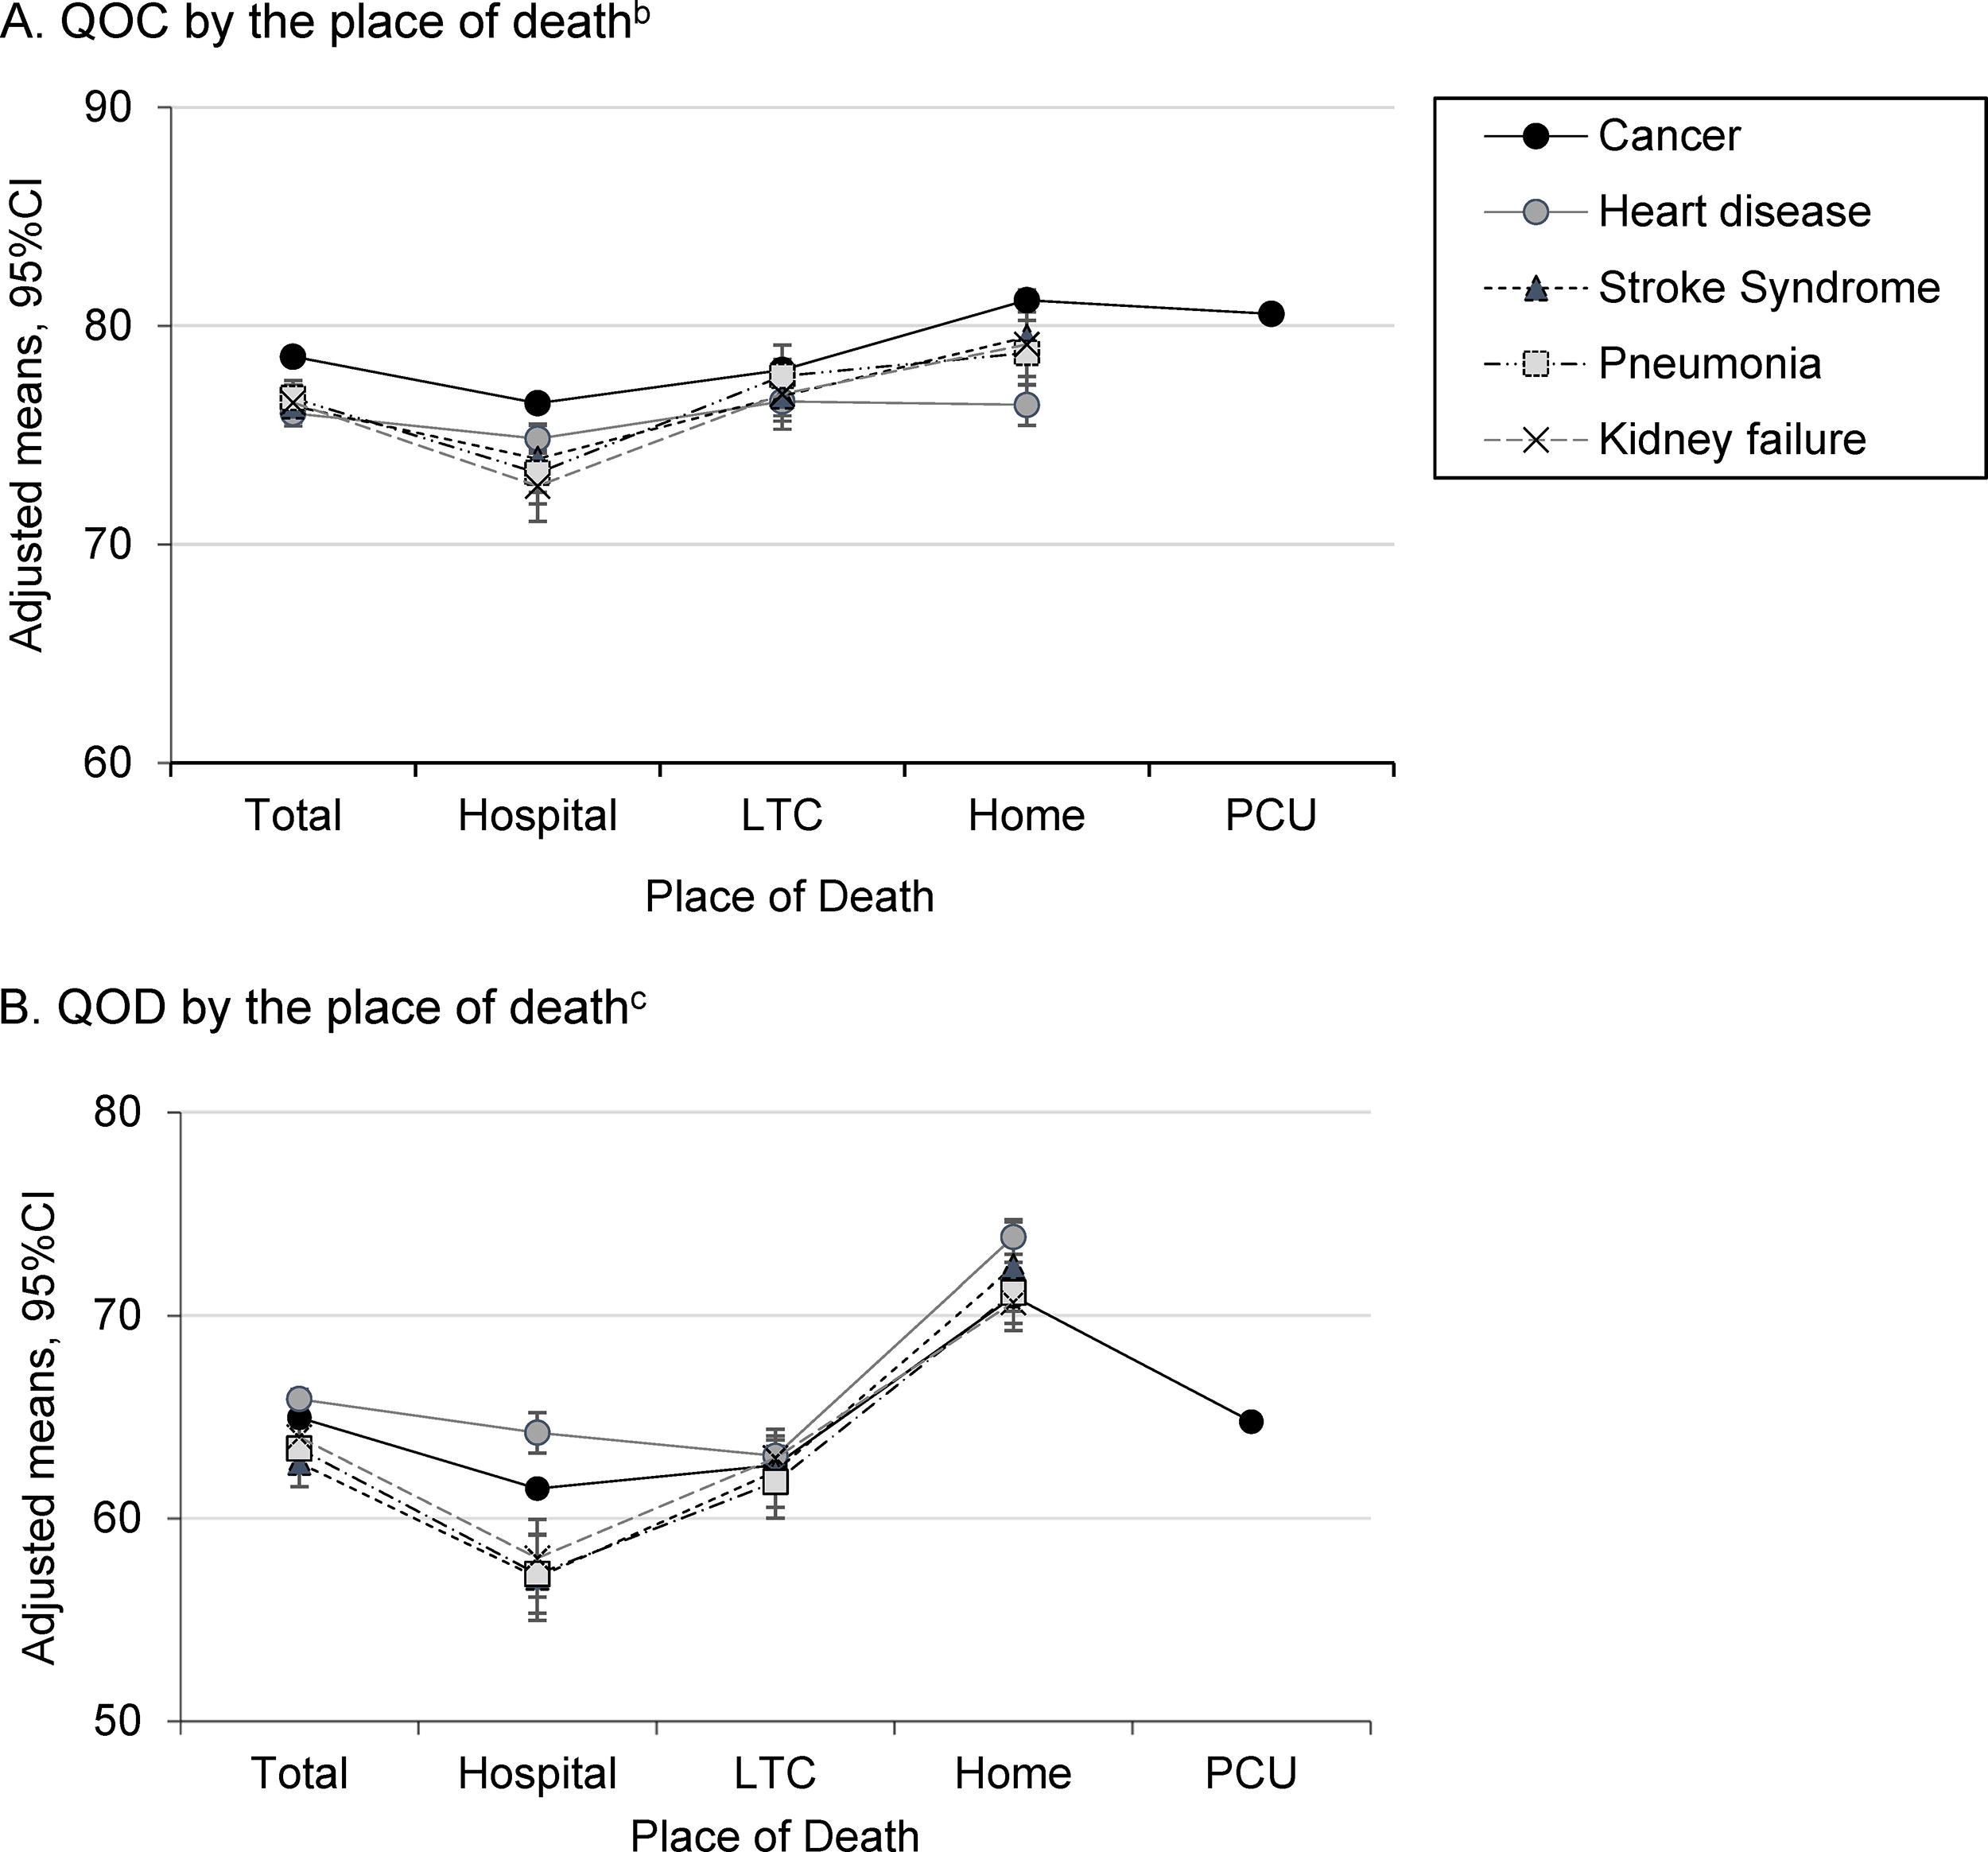
Adjusted mean total scores for quality outcomes by the place of deatha.
The total mean scores for QOC were significantly higher at home (and PCU for cancer) across all causes of death, with moderate ES observed for cancer, stroke syndrome, pneumonia, and kidney failure: cancer 81.2 [95% CI 81.0 to 81.3, ES 0.36], heart disease 76.4 [95% CI 75.4 to 77.3, ES 0.09], stroke syndrome 79.5 [95% CI 77.3 to 81.7, ES 0.32], pneumonia 78.8 [95% CI 77.3 to 80.2, ES 0.37], and kidney failure 79.1 [95% CI 77.7 to 80.6, ES 0.41] (for all combinations with hospital p < 0.01). Supplementary Table S3 shows the domain proportions for QOC by the place of death.
The total mean scores of QOD were also significantly higher at home among all causes of death, with large ES being observed: cancer 70.9 [95% CI 70.8 to 71.1, ES 0.66], heart disease 73.8 [95% CI 73.0 to 74.7, ES 0.51], stroke syndrome 72.4 [95% CI 70.2 to 74.6, ES 0.77], pneumonia 71.1 [95% CI 69.6 to 72.6, ES 0.78], and kidney failure 70.6 [95% CI 69.3 to 72.0, ES 0.74] (for all combinations with hospital p < 0.001). Regarding stroke syndrome and pneumonia, the greatest difference was observed in QOD between hospital and home. Supplementary Table S4 shows the adjusted domain proportions of QOD by the place of death. “Dying in a favorite place” and “spending time with family” proportions were significantly higher at home among all causes of death.
The domain proportions of symptoms showed that “pain” in all causes of death, except for heart disease, was slightly lower in long-term care than at hospital, home, and in the PCU (Supplementary Table S5).
Quality outcomes by the cause of death
The total mean score for QOC was slightly lower in noncancer than in cancer patients, but was not clinically significant: cancer 78.6 [95% CI 78.5 to 78.8], heart disease 76.0 [95% CI 75.6 to 76.4, ES 0.18], stroke syndrome 76.3 [95% CI 75.4 to 77.2, ES 0.15], pneumonia 76.7 [95% CI 75.9 to 77.5, ES 0.13], and kidney failure 76.5 [95% CI 75.7 to 77.3, ES 0.15], for all combinations with cancer p < 0.01 (Fig. 2 and Supplementary Table S2). The domain proportions for QOC were also slightly lower in noncancer than in cancer patients, but were not clinically significant (Fig. 3 and Supplementary Table S6).

Adjusted domain proportions for quality outcomes by the cause of deatha.
The total mean score for QOD slightly differed among causes of death (Fig. 2 and Supplementary Table S2). The domain proportions for QOD “feeling that life is complete” were slightly lower in cancer patients 57.6% [95% CI 57.1 to 58.0] than for other causes of death: heart disease 75.6% [95% CI 74.2 to 77.1, ES 0.35], stroke syndrome 69.8% [95% CI 66.3 to 73.3, ES 0.21], pneumonia 77.5% [95% CI 74.4 to 80.3, ES 0.41], and kidney failure 74.9% [95% CI 72.1 to 77.8 ES 0.35], for all combinations with cancer, p < 0.001 (Fig. 3 and Supplementary Table S6).
The domain proportions for symptoms were higher in cancer patients than for other causes of death (Fig. 3 and Supplementary Table S6). “Pain” was the highest among cancer patients (36.6% [95%CI 36.1 to 37.1] for all combinations with cancer, p < 0.001). However, “shortness of breath” was common among causes of death (cancer 33.9% [95% CI 33.5 to 34.4], heart disease 24.9% [95% CI 23.4 to 26.4], stroke syndrome 21.8% [95% CI 18.5 to 25.0], pneumonia 31.6% [95% CI 28.5 to 34.7], and kidney failure 24.4% [95% CI 21.6 to 27.2]).
Discussion
An important result of the present study was that family-reported QOC was higher at home than in other places of death across all causes of death. The present results support the findings of previous studies that investigated QOC at cancer patients’ last place of life and clarify the situation for noncancer patients in Japan.12,13,28 In Japan, approximately 68% of deaths occur in hospitals. 29 The present medical system in Japan relies on a hospital-centric model. Depending on the region, access to home-based medical care and hospice care may be limited. Therefore, it is important not only to enhance awareness among health care providers regarding the choice of end-of-life care settings for all terminally ill patients, but also to change the systems and policies that lead to deaths in hospitals.
QOD was higher at home among all causes of death. These quality differences were attributed to dying in a favorite place and spending time with family. The setting of end-of-life care makes a difference to QOD for patients. The greatest difference was observed in QOD for stroke syndrome and pneumonia among the settings examined. Patients with stroke syndrome face various symptoms after the acute and rehabilitation phases, including anxiety, central pain, delirium, and depression. Many of these symptoms, if recognized, may be treated or alleviated.30–32 If symptoms may be alleviated and patients select a place of death, it may improve QOD. The majority of elderly people prefer to die at home.33–37 However, this preference may not be applicable to everyone. It is crucial to consider the level of care required based on the patient’s condition and offer end-of-life care options that align with the patient’s preferences.
Another result of the present study was that family-reported QOC and QOD were similar among causes of death. We hypothesized that there may be a greater difference in end-of-life care between cancer and noncancer patients because end-of-life care in Japan has expanded from cancer patients. Although the results obtained suggest that the quality of end-of-life care was similar among diseases, it is important to further reduce differences between diseases based on the disease-specific outcomes of QOD domains and symptoms during the last week of life. To further enhance access to appropriate end-of-life care for all terminally ill patients, adequate national policies, programs, resources, and training for health care professionals are essential.
We observed a relatively high prevalence of severe dyspnea in the last week of life across all causes of death, which is consistent with previous studies reporting a high prevalence of dyspnea in terminally ill patients. The present results confirm this situation in Japan.38,39 In addition, we identified a high prevalence of severe pain and lack of energy among cancer patients, who are known to have a high risk of experiencing multiple symptoms concurrently. 40 Urgent attention and further research are necessary to develop treatment and care strategies that effectively manage intractable symptoms in dying patients.
We clarified important differences in places of death for end-of-life care for patients by the five common causes of death. The strengths of our study include a large national population with a rich set of outcomes on end-of-life care from a family survey, the first national data in Japan, and a comprehensive evaluation of end-of-life care experienced by patients. We obtained the most important clinically relevant results regarding the primary outcome.
Limitations
The present study has several limitations that need to be addressed. The findings of groups containing patients with multimorbidity may differ from those with a single condition; however, adjusting for this is challenging to implement.41,42 The experience of end-of-life care for patients with multimorbidity may differ from those with a single condition. Furthermore, no significant difference was observed in QOD total mean scores by the cause of death. The interpretation of this result is challenging due to the presence of comorbidities, such as frailty syndrome. Further research is needed to address these limitations, including validating comparisons of disease-specific total scores and making comparisons between groups with similar backgrounds.
Furthermore, the medical service system and cultural background in Japan are different from those in other countries; therefore, the present results may not be generalizable to patients outside of Japan.
Moreover, patients who died at home included individuals who did not regularly use home-based health care services due to sudden death or other reasons.
In addition, although our survey response rate was 54%, the nonresponse bias was possible. Respondents’ perceptions may differ from those of nonresponders. We attempted to minimize this possibility by adjusting survey analyses for nonresponses.
Another limitation is that responses from bereaved family members that were collected between 13 and 25 months after the patient’s death may have been affected by recall bias.
Previous studies also reported that concordance between patients and family members was high for ratings of QOC, but was lower for ratings of subjective symptoms, which may affect the validity of severe symptom prevalence.43–45 In addition, the relationship between decedents and family members as well as the frequency of caregiving may have affected the present results.
Despite these limitations, we consider this rich data source to have enabled a robust assessment of end-of-life care among multiple care settings and causes of death. Aspects related to end-of-life discussions, including the preferred place of death and advance care planning, which were measured concurrently in the survey, will be reported in a separate study in consideration of the potential effects of recall bias.
Conclusions
To improve QOC and QOD for all terminally ill patients, the present results suggest that some aspects, such as dying in a preferred care setting and spending time with family, significantly contribute to QOD. These insights are valuable for health care providers to obtain a more detailed understanding of their roles and incorporate them into patient care plans. Additionally, the differences observed in QOD for stroke syndrome and pneumonia provide crucial information for considering tailored approaches for patients with specific conditions. These results highlight the need to expand end-of-life care options for all patients and provide important information for policymakers.
Footnotes
Acknowledgments
The authors would like to express their gratitude to the bereaved family members who participated in the study.
Authors’ Contributions
Conceptualization and methodology: Y.N., M.M., T.M., Y.K., and A.O. Investigation: Y.N., E.T., and R.Y. Writing—original draft preparation: Y.N., M.M., Y.O., T.M., and A.O. Writing—reviewing and editing: Y.N., M.M., Y.O., T.M., Y.K., S.K., H.Y., and A.O. Data curation and visualization: Y.N., M.M., Y.O., and T.M. Funding acquisition: A.O.
Data-Sharing Statement
The data of decedents are not publicly available due to restricted use.
Author Disclosure Statement
No competing financial interests exist.
Funding Information
This study received support from the mortality follow-back survey project budget of the

References
Supplementary Material
Please find the following supplemental material available below.
For Open Access articles published under a Creative Commons License, all supplemental material carries the same license as the article it is associated with.
For non-Open Access articles published, all supplemental material carries a non-exclusive license, and permission requests for re-use of supplemental material or any part of supplemental material shall be sent directly to the copyright owner as specified in the copyright notice associated with the article.
