
Abstract
This study examined whether the number of options in the Likert scale influences the psychological distance between categories. The most important assumption when using the Likert scale is that the psychological distance between options is equal. The authors proposed a new algorithm for calculating the scale values of options by applying item response theory and the ideas of Wakita to reveal the influence of the number of categories. Three types of questionnaires that were composed of the same items, but used different numbers of options to assess these items (specifically, 4-, 5-, and 7-point scales), were completed by 722 undergraduate students. The results indicated that the number of options influenced the psychological distance between options, particularly for the 7-point scale. This influence was revealed only by the authors’ algorithm; descriptive statistics and coefficients of reliability did not show that the number of options had a prominent influence. The importance of the number of options and the new algorithm are discussed.
Background
The Likert scale is the most commonly used psychometric scale among psychological measurements that require self-reporting. For this scale, it is assumed that if the psychological distance between categories is equal, the scale will provide exact measurements of the psychological trait being assessed. This assumption about the psychological distance between categories is the most important factor in the Likert scale. However, no conclusion has been reached regarding the influence of a different number of options on the Likert scale, and no previous research has examined the impact of the number of options on the psychological distance between the options.
The number of options has been a central issue for researchers in extracting information from participants since Garner (1960) reported that psychological scales require more than 20 categories to derive complete information from answers. A decade later, Green and Rao (1970) reported that six or seven categories were appropriate. In contrast, Schuts and Rucker (1975) suggested that the number of options might not affect participants’ responses. Consequently, no consensus has been reached regarding the number of options required.
Most Likert scales include four to seven categories. An odd number of options is used when researchers need a neutral anchor, such as “Neither agree nor disagree,” whereas an even number of options is used when researchers intend to elicit participants’ opinions or attitudes through answers such as “Agree” or “Disagree.”
Previous research also investigated the appropriate number of options from the perspective of statistical reliability. Lissitz and Green (1975) and Boote (1981) suggested that a 5-point scale was reliable. Cicchetti, Showalter, and Tyrer (1985) examined the interrater reliability using a Monte Carlo simulation and reported an increase in reliability when the number of categories was less than eight. Oaster (1989) indicated that a 7-point scale showed the highest test–retest reliability. Preston and Colman (2000) also revealed that a scale with two to four categories showed the lowest test–retest reliability, and a scale with seven or more categories showed the highest test–retest reliability; however, there was no relation between the number of options and criterion-related validity among scales with 2 to 11 categories. These results indicate that 7-point scales are likely to show higher reliability than are any other number of options. Chang (1994) compared 4- and 6-point scales for the same items and suggested that an increase in the number of categories did not always result in higher reliability. However, other studies have indicated that reliability is independent of the number of options (Bendig, 1953, 1954; Brown, Wilding, & Coulter, 1991; Komorita, 1963; Matell & Jacoby, 1971). In these previous studies, the number of options was discussed from the perspective of reliability, which estimates only the random error in the error of measurement. The main target of the present study, the psychological distance between options, is considered to be more suitable for assessing the systematic error in the error of measurement than Cronbach’s α, intraclass correlation, and test–retest reliability. The number of options has also been examined from the perspective of how participants feel when considering the appropriate option. Preston and Colman (2000) examined the following questions with the same participants: (a) ease of rating, (b) time required to select an answer, and (c) participants’ satisfaction with their ability to express their feelings. Their results suggested that 5 to 10 categories were easy to rate. In addition, 5 categories were evaluated as being short enough to select an answer quickly and 3 or 4 categories were evaluated as being complete enough for participants to express their feelings satisfactorily. Thus, these results indicate that a maximum of 5 categories is adequate for most scales.
Although the number of options has been considered from the viewpoints of researcher orientation, statistical reliability, and participant evaluation, no previous studies focused on the assumption of the original Likert scale—that is, psychological distance between categories is equal—when evaluating the appropriate number of options.
Many psychological scales include a neutral category, such as “Neither agree nor disagree,” to allocate equal psychological distance between the neutral category and the adjacent side categories in line with the assumption that the psychological distance between categories must be equal.
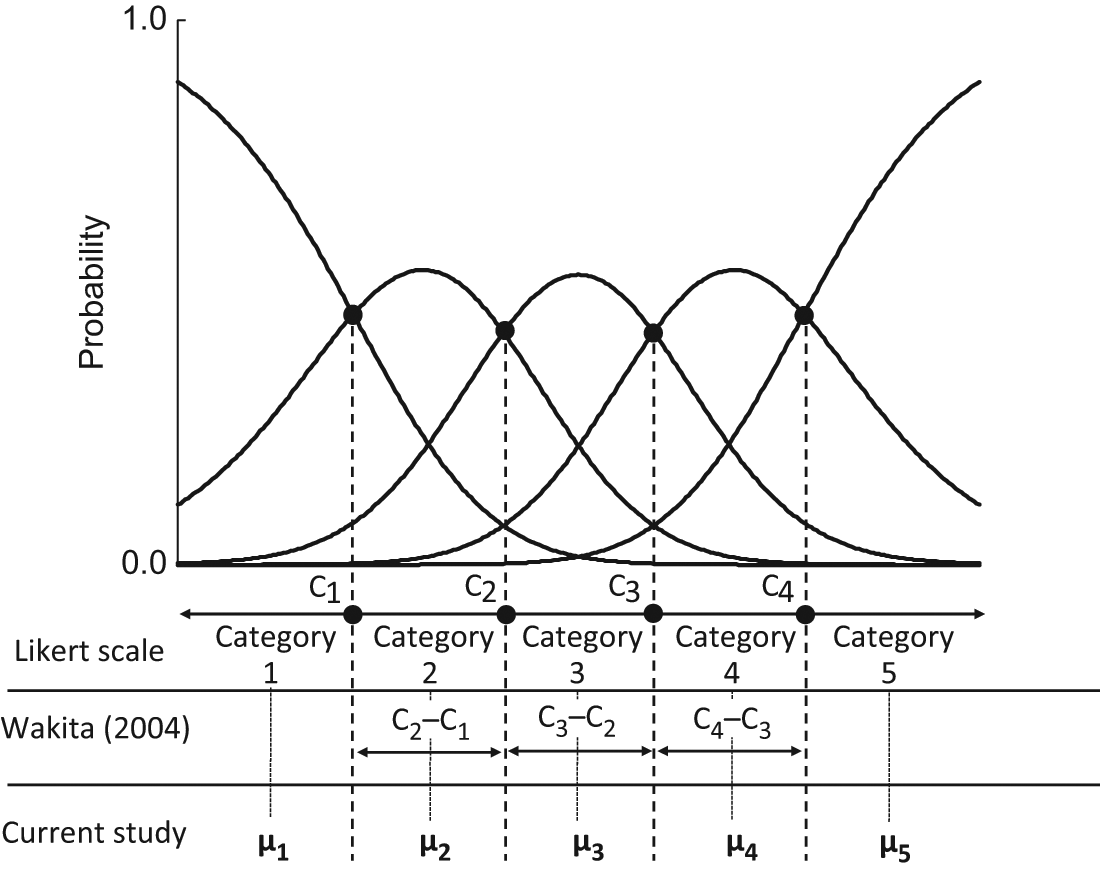
Wakita (2004) described a method for estimating the widths of each category (Figure 1) and showed that the widths were affected by the item contents. The widths were defined as W1 = C2−C1, W2 = C3-−C2, W3 = C4−C3, and it was shown that the psychological distances between each category were equal when W1:W2:W3 = 1:1:1. W1:W2:W3 was skewed when the item contents were negative; specifically, the width of the neutral category was significantly narrower than the widths of the other categories. However, this tool is not adequate for discussing the psychological distance between options. To discuss psychological distance in detail, we must obtain scale values for the categories shown in Figure 1.
Calculating scale value (µ)
The present study presents a new formula for obtaining scale values that correspond to each original category in order to reveal the differences between these scale values and the original categories. We aimed to examine the appropriate number of categories for Likert scales, focusing on the psychological distance between categories, and clarify how the number of options affects this distance. For the purpose of this study, 4-, 5-, and 7-point scales were used for the same personality scale.
Method
Formula for Calculating Scale Values
Item response theory (IRT) was applied to calculate the scale values of each category in this study. IRT applies the generalized partial credit model (GPCM) by Muraki (1992). This new formula was organized according to the following two assumptions:
Assumption 1: In the Likert scale, a latent continuum is assumed to exist behind each category, and this continuum is divided to give the interval to each category. A border to the next category is assumed to exist at a midpoint between the adjacent categories on the rating scale continuum (Figure 1). Thus, the category of the rating scale has a certain range of length on the rating scale continuum; however, both ends of the categories are open intervals.
Assumption 2: In the GPCM, the intersection of two adjacent categories is defined as the point representing category parameters. This intersection is assigned on the borders of the rating continuum in the Likert scale (Assumption 1).
Scale Value
If the scale values are normally distributed according to category parameters, the expectations of each interval are defined as scale values. For example, the expectation of the interval between −∞ and the first category parameter (C1) is defined as the scale value of the first category (µ1), and the expectation of the interval between the first category parameter (C1) and the second category parameter (C2) is defined as the scale value of the second category (µ2). Therefore, in the case of

the scale value (µ P ) of the Pth category, which is the expectation of [C P −1, C P ], is obtained by

When C0 is −∞ and f(C0) = 0 and the number of categories is m, C m for the mth category would be +∞ and f(C m ) = 0. Thus, the resulting µ P is defined as the scale value of the Pth category.
Management of Number of Options
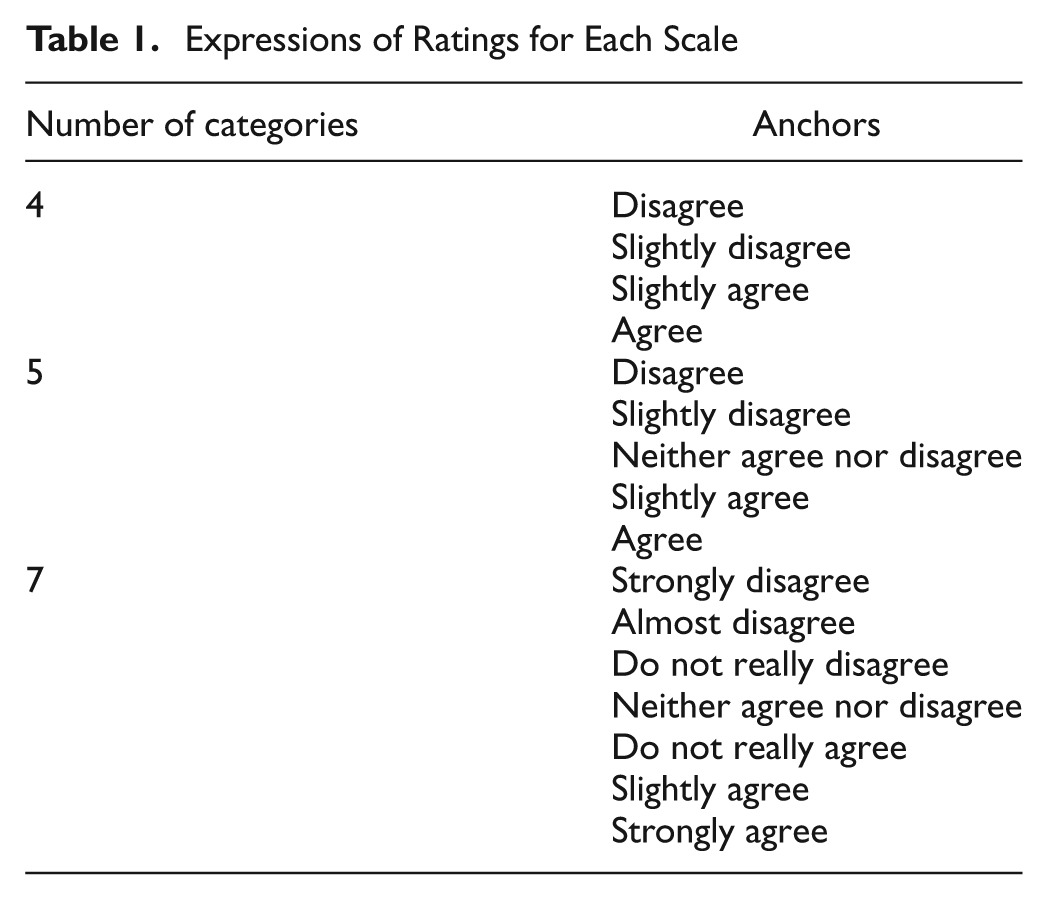
The Big Five Scale (Wada, 1996), which is a major personality scale, was modified into three types of questionnaires with different numbers of options. This scale is one of the major psychological scales that is commonly used with different numbers of options. From its subscales, 11 neuroticism items (BF-N) and 12 extraversion items (BF-extraversion normal [EN] and BF-extraversion reversed [ER]) were selected. BF-N comprises items that ask about socially negative attitudes, BF-EN asks about socially positive attitudes, and BF-ER asks about socially positive attitudes toward extraversion. For these items, 4-, 5-, and 7- point categories were used as follows: (a) a 4-point scale was adopted based on its frequency of use and participants’ satisfaction of expressing their feelings (Preston & Colman, 2000), (b) a 5-point scale was set up based on its frequency of use and ease of selecting an answer (Preston & Colman, 2000), and (c) a 7-point scale was set up based on the higher reliability of this number of options shown by Cicchetti, Showalter, and Tyrer. (1985), Oaster (1989), and Preston and Colman (2000). These numbers of categories are commonly used in psychological and clinical research. The expressions of ratings for each scale are described in Table 1. The order of the items and other parts of the questionnaire were not changed.
Expressions of Ratings for Each Scale
Participants and Study Period
Participants comprised 772 undergraduate students. The questionnaire was completed anonymously, and a response to the questionnaire was considered to represent informed consent to participate in the study. Questionnaires were administered in the autumn semester of 2002.
Procedure
Questionnaires were randomly administered during a lecture (4-point scale, n = 258; 5-point scale, n = 254; 7-point scale, n = 260) with each participant answering one questionnaire (4-, 5-, or 7-point scale).
Results
Analysis
To compare the characteristics of each number of categories, the following three points were examined: (a) the mean and standard deviation (SD) of each subscale score, (b) the estimates of the coefficient of reliability (coefficient of Cronbach’s α), and (c) the estimates of the scale value based on IRT. Subsequently, the relation between the conventional scale values and the estimated scale value (converted scale score) in (c) was examined. The estimates of scale values by IRT were obtained based on the category parameter by the GPCM (Muraki, 1992). The PARSCLE4.1 (Muraki & Bock, 2003) was used.
Descriptive Statistics (Mean and Standard Deviation)
Each subscale was assigned a consecutive integral item value, such as 1 point or 2 points, from the first category to the end category, and the mean scores were assigned to correspondent subscale scores. To compare these values, the scale scores of the 4-point scale and 7-point scale were adjusted to the same range as the 5-point scale (adjusted scale-scores). 1 The results showed that the mean and SD of each subscale score were not significantly different except for the 7-point scale (Table 2). In the 7-point scale, the adjusted scale score was slightly lower than the other two scales, and the SD was also slightly smaller.
Mean and Standard Deviation of Each Subscale Score

Note: BF-N = Big Five Scale—neuroticism items; BF-EN = Big Five Scale—extraversion normal items; BF-ER = Big Five Scale—extraversion reversed items.
Reliability
The estimates of reliability were obtained by using Cronbach’s α coefficient (Table 3). No subscale showed an obvious difference in α based on the number of categories.
Estimates of Reliability (Cronbach’s α Coefficient)
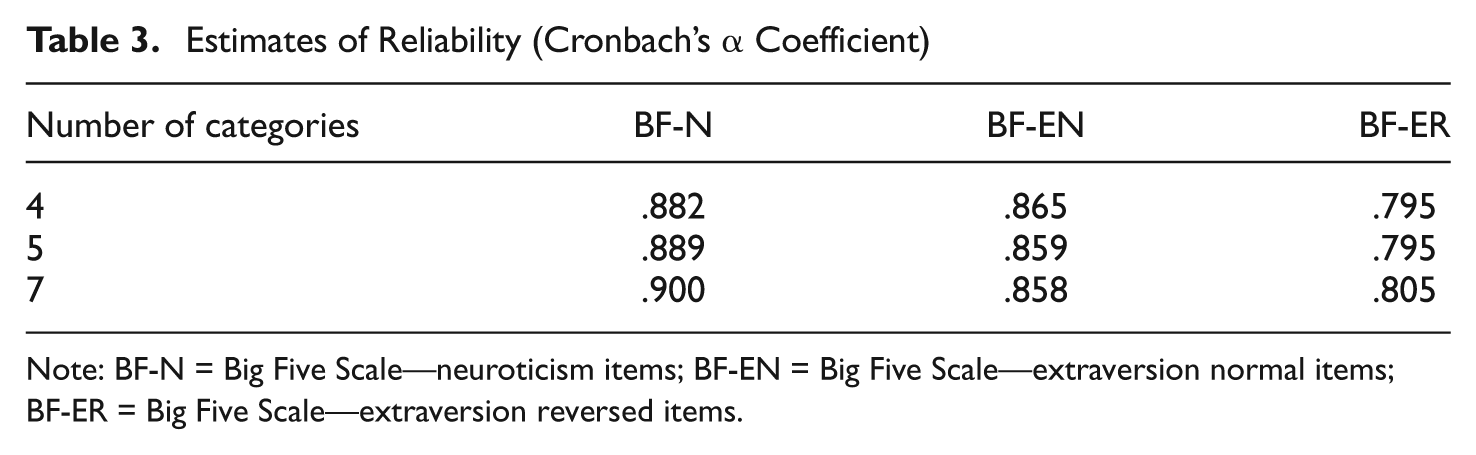
Note: BF-N = Big Five Scale—neuroticism items; BF-EN = Big Five Scale—extraversion normal items; BF-ER = Big Five Scale—extraversion reversed items.
Estimates of Scale Values for Each Category
The eigenvalues of the matrix of correlation were examined to confirm the unidimensionality of the scale as a latent trait in the IRT model, and the unidimensionality of the scale was confirmed in all subscales. The first and second eigenvalues and their ratios are shown in Table 4.
Eigenvalues of Each Subscale

Note: BF-N = Big Five Scale—neuroticism items; BF-EN = Big Five Scale—extraversion normal items; BF-ER = Big Five Scale—extraversion reversed items.
Then, the scale values (µ P ) of each category were calculated from the resulting category parameter, which was estimated by IRT. Only the subscale BF-EN in the 7-point scale was estimated from five items because no participants selected “Strongly disagree” for the second item. In addition, the resulting scale values were converted to the range from 1 to 4 points, 5 points, and 7 points in each category (converted item value). For instance, the converted scale values ranged from 1 to 4 points when that scale had four categories. 2 The category parameters in GPCM, the scale value, and the converted scale value are shown in Table 5, and the converted scale values are shown in Figures 2 to 4. In the BF-ER, the fifth and sixth parameters were not ordered.
Category Parameters in Item Response Theory and Scale Value of Each Category

Note: BF-N = Big Five Scale—neuroticism items; BF-EN = Big Five Scale—extraversion normal items; BF-ER = Big Five Scale—extraversion reversed items.
Converted item values of the 4-category scale

Converted item values of the 5-category scale
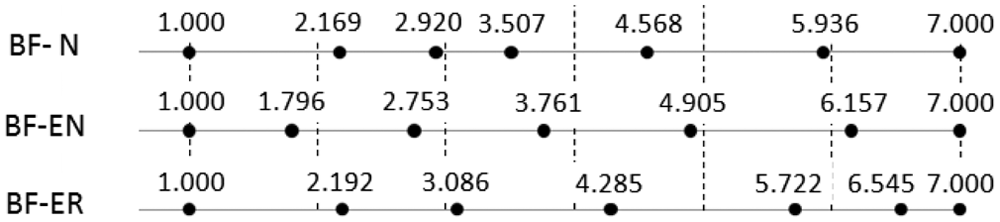
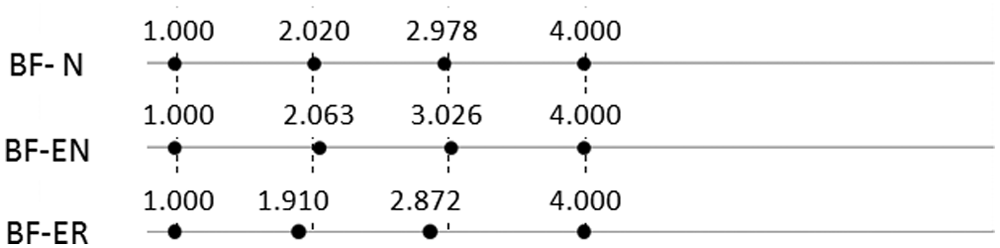
Converted item values of the 7-category scale
In the converted scale value of the 4-point scale shown in Figure 1, all converted scale values were allocated around the conventional item values. In the 5-point scale shown in Figure 2, most converted scale values were also around the conventional scale values except the fourth category of BF-N. In contrast, in the 7-point scale shown in Figure 4, half of the converted scale values deviated from the conventional item value. For instance, the fourth and fifth categories of BF-N were smaller than their conventional item values, and the fifth and sixth categories of BF-ER were disproportionately close to 7. Consequently, only the results from IRT evaluation revealed that the psychological distance between categories was affected by the number of options shown in the figures of the converted scale scores.
Comparison of Conventional Scale Scores and the Converted Scale Scores
The conventional scale scores were calculated by summing the item scores that assigned an integer value to each option, and the converted scale scores were calculated from the converted scale value. When calculating descriptive statistics, the difference in the absolute value between these scales was examined to determine the difference between the scores (Table 6). The results indicated that the 4- and 5-point scales had only slight differences less than 0.15, whereas the 7-point scale showed larger differences in the BF-N and the BF-ER. The coefficient of correlation between the conventional and the converted BF-N scores was lowest in the 7-point scale (i.e., 0.993).
Difference Between Conventional and Converted Item Values a
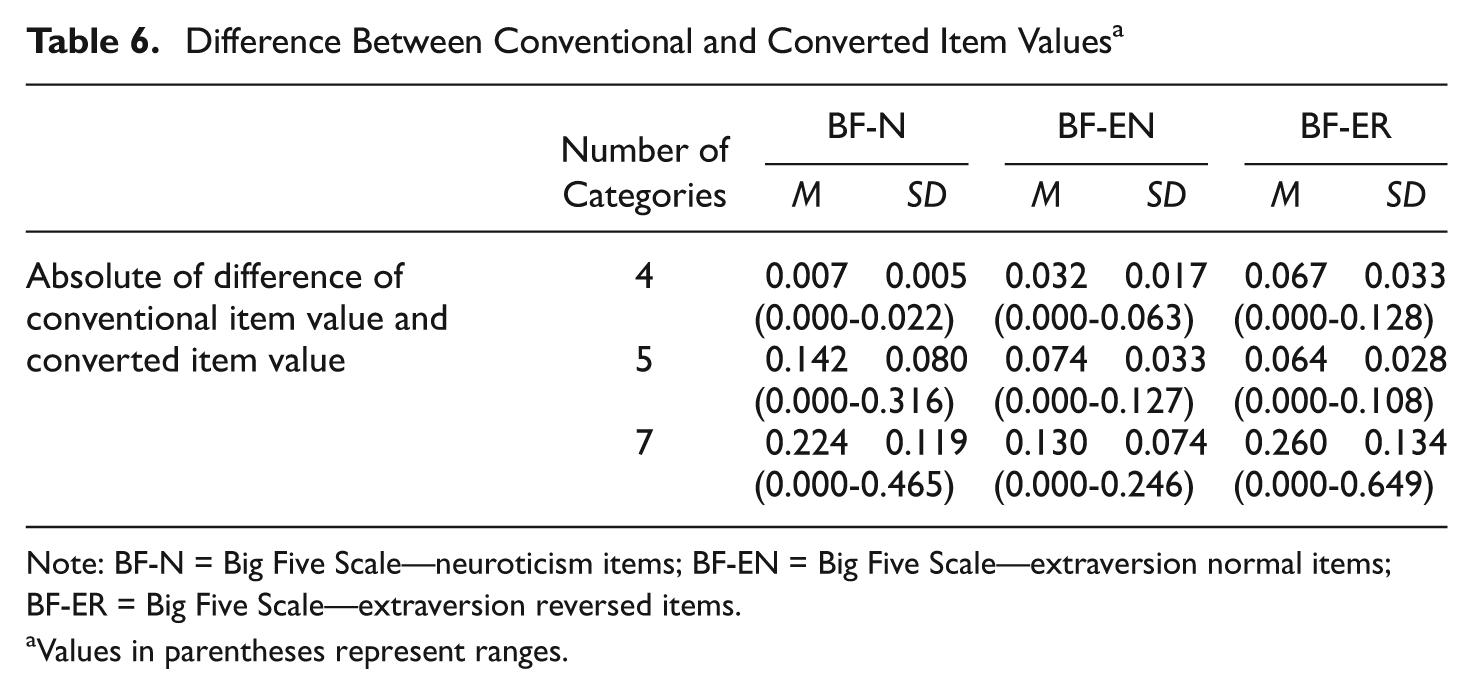
Note: BF-N = Big Five Scale—neuroticism items; BF-EN = Big Five Scale—extraversion normal items; BF-ER = Big Five Scale—extraversion reversed items.
Values in parentheses represent ranges.
Finally, the correlations between the items, which influence the factor analysis and structure equation modeling, were compared by focusing on BF-N, which had the largest variance in psychological distance between the 4- and 7-point scales. The maximum difference in the absolute value of the correlation between items was 0.181 (between Items 7 and 10), and the minimum was 0.002 (between Items 4 and 8).
Discussion
Method for Evaluating Psychological Distance
To clarify how the number of categories influences psychological distance in the Likert scale, 4-, 5- and 7-point scales of the same psychological scale and with the same instructions were compared. Moreover, this study proposed a new method for measuring the scale values to examine the distance between items.
Our new IRT method, which is based on the method reported by Wakita (2004), enabled a discussion of the number of categories in the Likert scale derived from the psychological distance in the rating scales, which has been previously discussed from the perspective of the estimates of the reliability coefficient.
Descriptive Statistics (Mean and Standard Deviation)
The descriptive statistics suggest that in the 7-point scale, the participants tended to select somewhat negative answers, such as “Disagree,” and that they avoided selecting both ends of categories. These tendencies might imply that an increase in the number of options biases respondents against answers containing the strongest expressions.
Reliability
The coefficient of reliability was independent of the number of categories in this study, a finding that is consistent with previous studies showing that the appropriate number of categories cannot be determined based on the estimates of the coefficient of reliability (Bendig, 1953, 1954; Brown et al., 1991; Komorita, 1963; Matell & Jacoby, 1971).
Estimates of Scale Values for Category (Converted Scale Values Obtained by IRT)
A comparison of the numbers of categories indicated that the psychological distance deviated more as the number of categories increased in the BF-N and BF-ER subscales. In the 5-point scale, deviation in the psychological distance was seen, especially in the BF-N subscale. In the 7-point scale, deviation was seen in all the three subscales; however, the psychological distance deviated more in the BF-N and BF-ER subscales than in the BF-EN subscale.
In this study, the number of categories did not influence the descriptive statistics and the estimates of the reliability coefficient, but it did influence the item values. Consequently, the psychological distance estimated by the converted item value by the IRT deviated more in the 7-point scale than in the 4- and 5-point scales. In addition, the 7-point scale did not function well because of the reversal of the category parameters shown in Table 5. Furthermore, this deviation was greater when items asked about socially negative personality traits shown in the BF-N and the BF-ER. In short, these results imply that an attempt to set a neutral category such as “Neither agree nor disagree” between positive and negative categories did not accomplish the intended purpose. These results suggest that it was not necessary to adapt the 7-point scale, which requires more time, and that the psychological distance was sensitive to items with socially negative contents. The latter suggestion supports the following two perspectives based on statistical evidence. First, it is recommended that the words of a rating scale be carefully considered when asking participants to rate contents as reversed items. Second, self-reported questionnaires using the Likert scale are absolutely affected by the bias of social desirability.
Our study not only identified weak points in Likert scales but also suggested a practical method for developing new questionnaires and modifying established items. The new method presented here demonstrated the inequality in the psychological distance of the Likert scale. When developing new scales, our IRT method enabled us to ensure equality in the psychological distance between options, allowing us to select suitable expressions for anchors and an appropriate number of options. For example, whether an increase in the number of positive ratings in a scale such as “Disagree,”“Slightly agree,”“Somewhat agree,”“Moderately agree,” and “Strongly agree” would improve the deviation of the responses when the items might be influenced by social desirability could be shown by scale values. Such manipulation has not yet been used but is necessary to support the important original assumption of the Likert scale that the psychological distance between items is equal.
Limitations and Future Direction
This study aimed to examine whether the number of options had an effect on the psychological distance in the Likert scale by applying IRT theory to consider the appropriate number of options. The results of IRT analysis indicated that the number of options had an effect on the response, especially in the 7-point scale. However, this study assessed only one major psychological (personality) scale using the anchors shown in Table 1. In addition, participants were all undergraduate students. Surveys using other scales and in other populations are needed before the results can be generalized.
Footnotes
Declaration of Conflicting Interests
The author(s) declared no potential conflicts of interest with respect to the research, authorship, and/or publication of this article.
Funding
The author(s) received no financial support for the research, authorship, and/or publication of this article.