



Abstract
In standard item response theory (IRT) applications, the latent variable is typically assumed to be normally distributed. If the normality assumption is violated, the item parameter estimates can become biased. Summed score likelihood–based statistics may be useful for testing latent variable distribution fit. We develop Satorra–Bentler type moment adjustments to approximate the test statistics’ tail-area probability. A simulation study was conducted to examine the calibration and power of the unadjusted and adjusted statistics in various simulation conditions. Results show that the proposed indices have tail-area probabilities that can be closely approximated by central chi-squared random variables under the null hypothesis. Furthermore, the test statistics are focused. They are powerful for detecting latent variable distributional assumption violations, and not sensitive (correctly) to other forms of model misspecification such as multidimensionality. As a comparison, the goodness-of-fit statistic M2 has considerably lower power against latent variable nonnormality than the proposed indices. Empirical data from a patient-reported health outcomes study are used as illustration.
Introduction
Item response theory (IRT) provides powerful methods supporting educational and psychological measurement (Thissen & Steinberg, 2009). The latent variable in IRT models is usually assumed to follow a normal distribution for the purpose of item parameter estimation (Bock & Aitkin, 1981; Bock & Lieberman, 1970). However, this assumption might be violated in some situations (Woods, 2006; Woods & Lin, 2009). Woods (2006) described several potential situations where
Although alternative approaches exist for estimating the latent variable distribution in standard IRT models (Bock & Aitkin, 1981; Woods & Lin, 2009; Woods & Thissen, 2006), these approaches are computationally more demanding and specialized software is necessary. For example, in our experience, the empirical histogram representation of the latent prior distribution is often less stable numerically than the standard normal prior. Thus, it is worthwhile to test the assumption of latent variable normality before more “expensive” approaches are applied. Summed score likelihood–based statistics may be useful for testing latent variable distribution fit. One problem is that the statistics do not asymptotically follow a chi-squared distribution. We propose a Satorra–Bentler type moment adjustment method (Satorra & Bentler, 1994) in this article. The statistics’ tail-area probability can be approximated by making use of the item parameter error covariance matrix and a Jacobian. The properties of the adjusted and unadjusted statistics are examined by simulation and empirical studies. Additionally, a modified Lord–Wingersky algorithm for computing the Jacobian matrix is presented in the appendix.
Item Response Theory Models
In standard IRT models, the conditional item response probabilities (also referred to as item tracelines or item characteristic curves) are represented as a function of latent variable

where
For an item with

for

for

where

The Latent Variable Distribution in IRT
Estimating the latent variable distribution along with item parameters using the empirical histogram (Bock & Aitkin, 1981; Mislevy, 1984; Zimowski, Muraki, Mislevy, & Bock, 1996) is an established strategy for detecting and correcting latent variable nonnormality in IRT. Newer semiparametric density estimation procedures offer more efficient alternatives. These include the Ramsay Curve IRT (Woods & Thissen, 2006), and Davidian Curve IRT (Monroe & Cai, 2014; Woods & Lin, 2009), as well as its multidimensional extension (Monroe, 2014). In practice, however, estimating latent variable densities often requires specialized software. More complex latent variable distributions also involve more parameters to be estimated from the data, increasing the need for larger calibration sample sizes to achieve stable estimation. Finally, even as nonnormal latent densities may be modeled, for example, using a Ramsay curve IRT model (Woods & Thissen, 2006), and the relative model fit may be evaluated against a baseline using likelihood ratio tests, it does not circumvent the need for absolute goodness-of-fit indices to establish the adequacy of the least restrictive model in the class of models being compared (see Maydeu-Olivares & Cai, 2006, for further explanation). It would be highly desirable to establish a set of statistics that can be used to diagnose the extent to which a normal (or nonnormal) latent variable distribution may in fact be a reasonable characterization before more “expensive” methods and software programs for semiparametric density estimation are used.
In developing such a group of test statistics for latent variable distribution fit, several desiderata should be taken into account. First, the statistics should be easily computable, preferably using only standard by-products of the item calibration process. Second, the statistics should have well-grounded heuristic motivation and theoretical justification. Third, the frequency calibration of the statistics under the null hypothesis should be sufficiently accurate. Finally, the statistics should have adequate power that is focused on latent variable distribution assumption violation and sufficient diagnostic specificity, rather than becoming a surrogate of overall model fit tests.
The guiding insight has been provided elsewhere in the literature. For unidimensional IRT modeling, the observed and model-implied summed score distribution can be a basis for inferring the adequacy of the latent variable distribution specification in the IRT model (Thissen & Wainer, 2001). After model fitting, residual summed score probabilities may be used to construct chi-square test statistics. While the idea itself is not new (see, Ferrando & Lorenzo-seva, 2001; Hambleton & Traub, 1973; Lord, 1953; Ross, 1966; Sinharay, Johnson, & Stern, 2006, among others), we use the recently developed theory of limited-information goodness-of-fit testing to formally demonstrate that the summed score likelihood–based fit index proposed here belongs to the general family of multinomial limited-information tests.
The Multinomial Sampling Model and Maximum Likelihood Estimation
Let there be I items in a test. Under the conditional independence assumption, the IRT model specifies the conditional response pattern probability as the following product:

Assuming that

where
Recall that

where the summation is over all C response patterns. Maximization of the log-likelihood (e.g., with the expectation–maximization algorithm; Bock & Aitkin, 1981) leads to the maximum marginal likelihood estimator
On finding

From results in discrete multivariate analysis (e.g., Bishop, Fienberg, & Holland, 1975),

where

Distribution of Residuals Under Maximum Likelihood Estimation
Based on Equation (10), it can be shown that the asymptotic distribution of the difference

where

where
Lower Order Marginal Probabilities
The IRT model implies marginal probabilities. Consider the three-item example from above. There are three first-order marginal probabilities

where
More general versions of the reduction operator matrices for multiple categorical IRT models can be derived using similar logic (see, e.g., Cai & Hansen, 2013; Maydeu-Olivares & Joe, 2006). Note that

and
Summed Score Probabilities
In addition to the response pattern and marginal probabilities, the IRT model also generates model-implied summed score probabilities. For a test with I items and

where

Equation (16) shows that the IRT model-implied probability for summed score s is a sum over all such response pattern probabilities leading to summed scores, in other words, it may also be obtained by a reduction operator matrix.
Let
Returning to the three-item example, there are four summed scores in this case: 0, 1, 2, and 3. The
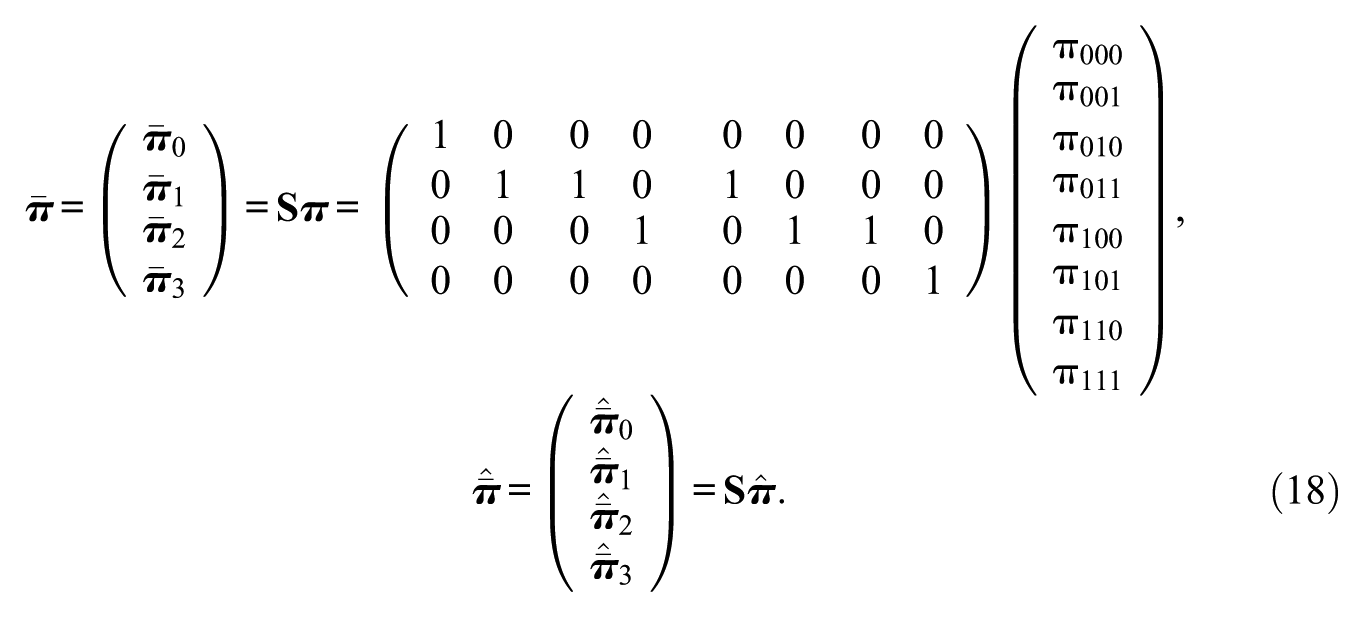
The observed summed score proportions can be obtained in a similar way:
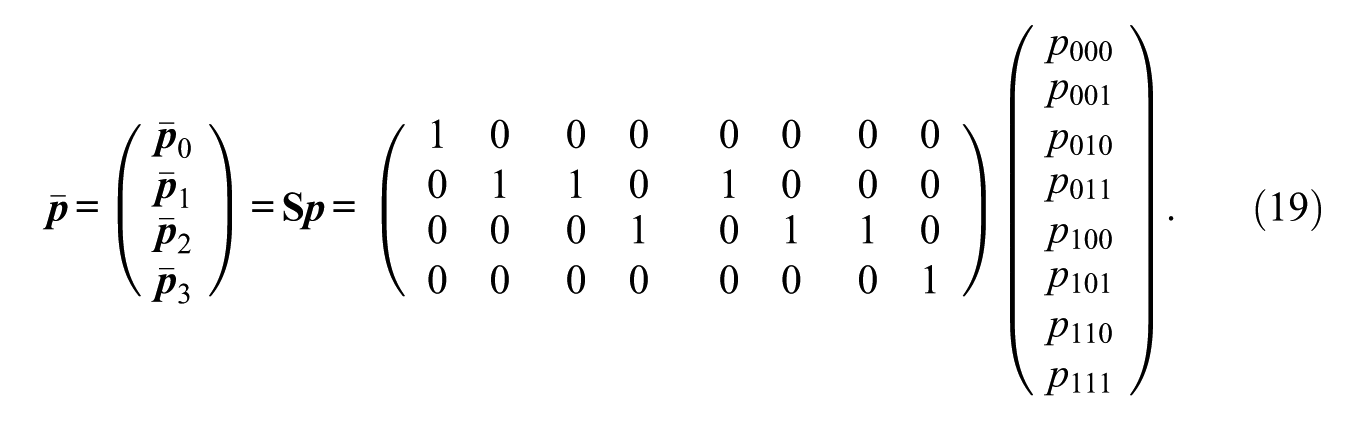
From Equation (13), under maximum likelihood estimation, the summed score residual vector

and
The reason for introducing the reduction operator matrix
Goodness-of-Fit Statistics for IRT models
Existing overall goodness-of-fit indices may be used for testing latent variable distribution fit in IRT. The full-information test statistics such as likelihood ratio G2 and Pearson’s X2 use residuals based on the full response pattern cross-classifications to test the IRT model against the general multinomial alternative. The comparison between

Under the null hypothesis that the IRT model fits exactly, these two statistics have the same asymptotic reference distribution, which is a central chi-square with degrees of freedom (df) equal to
Unfortunately, as the number of items increases, the number of response patterns increases exponentially. For more than a dozen or so dichotomous items (or perhaps a handful of polytomous items), the contingency table on which the multinomial is defined becomes sparse for any realistic N. Consequently, the asymptotic chi-square approximations for the full-information test statistics break down (see, e.g., Bartholomew & Tzamourani, 1999) and the utility of the full-information overall goodness-of-fit indices for routine IRT applications becomes questionable.
Recently, limited-information overall fit statistics such as Maydeu-Olivares and Joe’s (2005)M2 have been developed. Limited-information fit statistics use residuals based on lower order (e.g., first and second order) margins of the contingency table. These lower order margins are far better filled when compared with the sparse full contingency table. There is growing awareness that limited-information tests can maintain correct size and can be more powerful than the full-information tests (Cai, Maydeu-Olivares, Coffman, & Thissen, 2006; Joe & Maydeu-Olivares, 2010).
Under the assumption that the number of first- and second-order margins is larger than the number of free parameters

where
While an overall test may be used to detect specification errors of latent variable distributions, the fact that they are also sensitive to other forms of model error (e.g., unmodeled multidimensionality) makes it difficult to pinpoint the source of misspecification. To that end, more specific diagnostic indices have been created for IRT. For example, Chen and Thissen’s (1997) local dependence indices are particularly sensitive to violations of the local independence assumption. Orlando and Thissen’s (2000) item fit diagnostics is another example where the extent to which the IRT model fits the empirical operating characteristics for an item (e.g., whether monotonicity holds) can be examined. The next section develops a set of indices that specifically target latent variable distribution fit for IRT models.
The Summed Score Likelihood–Based Indices and Statistical Adjustments
There are two important lines of reasoning for the derivation of these model fit indices. The first is a recognition based on heuristics: IRT model–implied summed score probabilities may provide useful diagnostic information about the latent variable distributional assumption (Thissen & Wainer, 2001). The second recognition is that the summed score likelihood–based indices are formally limited-information test statistics.
A Heuristic Motivation
When the latent variable distribution assumed in the IRT model does not represent the population distribution of the respondents adequately, the model-implied summed score probabilities
Recall that the total number of summed scores is

where
In preliminary studies (Li & Cai, 2012) we had conjectured that under a wide variety of conditions
The rationale behind the specific degrees of freedom is as follows: The S summed scores’ probabilities must sum to 1. The first minus 1 is to reflect that constraint. Had the item parameters been known, the degrees of freedom would have been exactly
A More Formal Derivation
While the proposed test statistics are not associated with particular marginal probabilities in the same manner as Maydeu-Olivares and Joe’s (2005)M2, they are nevertheless related to the response pattern probabilities via the reduction operator matrix
Using the reduction operator

where

From Equations (24) and (25) we can see that the statistic
Adjustment of Statistics
According to Satorra and Bentler’s (1994) article, test statistics that do not asymptotically follow a chi-squared distribution can be corrected, by matching the mean (or the mean & variance) to fixed degrees of freedom. Let

Theoretically, the constant df can take on an arbitrary value. For the purpose of comparison, df will take the value of
One challenge to obtain the adjusted statistics is calculating the first-order moment in Equation (25). Some commercial software for IRT (e.g., flexMIRT®; Cai, 2013) provides the Fisher information matrix
Simulations
Simulations were undertaken to evaluate the summed score likelihood–based indices
Manipulated Factors and Conditions for Simulation Study.

Note. The factors are fully crossed in a
In the null condition, response pattern data were simulated with a latent variable having unidimensional normal distribution. In the alternative conditions, response pattern data were simulated either with a nonnormally distributed latent variable or with a bivariate normally distributed latent variable. The nonnormal
There were three conditions for item parameters. For the “Equal Slopes and Equal Intercepts” condition, all the slope parameters are fixed to 1, and all the intercept parameters are fixed to 0. For the “Random Slopes and Random Intercepts” condition, parameters for 24 items were randomly generated with properties mimicking standard educational and psychological assessments. Discrimination (a) parameters were drawn from a log-normal distribution
The fitted models were standard unidimensional IRT models. In the null conditions, the data-generating models and the fitted models were the same. In the alternative conditions, the fitted models were misspecified for ignoring either latent variable nonnormality or multidimensionality. Bock and Aitkin’s (1981) expectation–maximization algorithm was used to obtain maximum likelihood estimates, and the Lord–Wingersky (1984) algorithm was used to compute the model-implied summed score probabilities.
To compare the performance of the fit statistics, empirical Type I Error rates were computed in the null conditions, and empirically observed power were computed in the alternative conditions at three alpha levels: .01, .05, and .10. In addition, another model fit index, Maydeu-Olivares and Joe’s
Results
Type I Error Rates
Tables 2 and 3 present the simulation study results for the unidimensional normal case under the null hypothesis. The extent to which the tail areas of the proposed statistics’ distribution are well approximated is examined by comparing the observed Type I error rates against the nominal alpha levels. The results indicate that, when the slope and threshold parameters are equal across items, the adjusted and unadjusted summed score likelihood–based indices both work well. Empirical rejection rates and their corresponding alpha levels are close to each other. However, when the item parameters become dispersed, the adjusted statistic
Selected Simulation Results Under the Null Hypothesis: Normally Distributed Unidimensional Latent Variable in 2PL Models.

Empirical rejection rates (ERRs) at α levels .01 and .05.
Selected Simulation Results Under the Null Hypothesis: Normally Distributed Unidimensional Latent Variable in Graded Models.

Empirical rejection rates (ERRs) at α levels .01 and .05.
Furthermore, as suggested earlier, the observed means of these indexes should be close to the expected values of the approximating chi-squared distributions (the degrees of freedom). The results in Tables 2 and 3 confirm that when item parameters are equal, the means are close to the degrees of freedom, and the variance is approximately twice the degrees of freedom. Notice that when the number of items or the sample size increases, the results improve. For the 2PL model, when the item parameters are dispersed, the moment-adjusted statistic
Power
From Tables 4 and 5, it is clear that the summed score likelihood–based indices have substantially higher power than
Selected Simulation Results Under the Alternative Hypothesis: Nonnormally Distributed Unidimensional Latent Variable in Two-Parameter Logistic Models.

Selected Simulation Results Under the Alternative Hypothesis: Nonnormally Distributed Unidimensional Latent Variable in Graded Models.

Selected Simulation Results Under the Alternative Hypothesis: Multidimensional Distributed Unidimensional Latent Variable in Two-Parameter Logistic Models.

Selected Simulation Results Under the Alternative Hypothesis: Multidimensional Distributed Unidimensional Latent Variable in Graded Models.

An Application to Empirical Data
We illustrate the test statistics with empirical data. Twelve items related to positive consequences of nicotine (Tucker et al., 2014), as part of a questionnaire dealing with various attitudes, beliefs, and behaviors related to smoking (Shadel, Edelen, & Tucker, 2011), were administered to a sample of 2,717 daily cigarette smokers. Each item was rated on a 5-point ordinal scale. This study was part of the development of the National Institute of Health’s Patient Reported Outcomes Measurement Information System (PROMIS) and extensive item and dimensional analysis was conducted prior to calibration of the items as unidimensional. The density plot (Figure 1) of the latent variable distribution for this subscale shows its deviation from a standard normal distribution that there are two maximum points in the middle instead of a “bell curve” shape. Table 8 presents the contents of the 12 items from the PROMIS smoking assessment.

Latent variable distribution for empirical data. Estimated (using empirical histogram) probability density of the latent variable is plotted (dotted line), when superimposed on a standard normal density (solid line).
Items From PROMIS Smoking Initiative.

Note. PROMIS = Patient Reported Outcomes Measurement Information System.
Results show that when we use the normal unidimensional IRT model,
Discussion
Normality of latent variable distribution is a critical assumption in standard maximum marginal likelihood estimation for IRT models. However, in real-world applications, the distribution of latent variables can be nonnormal. The detection of latent variable nonnormality is important for item analysis and test scoring. In this study, we propose using summed score likelihood–based indices for testing departures from normality. We also develop a Satorra–Bentler type moment adjustment approach to approximate the tail area probabilities of the indices.
In the simulation study, the performance of unadjusted and adjusted summed score likelihood–based statistics was compared with that of
An interesting finding is that the general goodness-of-fit statistic
This study is not without its limitations. First, the distributions of the proposed indices are not exactly chi-squared. In our study, their tail-area probabilities were approximated to first order by a chi-squared variable with the availability of the item parameter error covariance matrix and a Jacobian. We focus on the first-order correction due to its simplicity and the fact that we observed empirically that the results of the second-order correction did not differ substantively from that of the first order. In the future, higher order moments could be considered to improve the performance of the adjusted statistics for situations that we have not examined. Second, only a limited number of null conditions and only two alternative population distributions were tested in the simulations. More extensive simulations are needed to fully understand the performance of the test statistics. Third, we only studied the properties of the statistics and the corrections under maximum likelihood estimation. In principle, one could derive similar statistics under limited-information estimation (e.g., with weighted least squares). Finally, this study only considered the conditions when item response data are assumed to be unidimensional. Multidimensional IRT models (MIRT, Reckase, 2009) should be considered in subsequent work. One particularly popular model in educational and psychological research is the full-information item bifactor model (Cai, Yang, & Hansen, 2011; Gibbons & Hedeker, 1992; Reise, 2012). In this model, all items load on a general dimension, and an item is permitted to load on at most one specific dimension that influences nonoverlapping subsets of items. This feature of bifactor models implies that there exists valuable relation between an observed summed score and the distribution of the latent general dimension (Cai, 2015). This relation implies an opportunity to test the underlying assumption about the distribution of general latent dimension with summed score likelihood–based statistics.
Footnotes
Appendix
Authors’ Note
The views expressed here belong to the authors and do not reflect the views or policies of the funding agencies.
Declaration of Conflicting Interests
The author(s) declared no potential conflicts of interest with respect to the research, authorship, and/or publication of this article.
Funding
The author(s) disclosed receipt of the following financial support for the research, authorship, and/or publication of this article: Part of this research was supported by the Institute of Education Sciences (R305D140046).