



Abstract
This paper presents a mixture item response tree (IRTree) model for extreme response style. Unlike traditional applications of single IRTree models, a mixture approach provides a way of representing the mixture of respondents following different underlying response processes (between individuals), as well as the uncertainty present at the individual level (within an individual). Simulation analyses reveal the potential of the mixture approach in identifying subgroups of respondents exhibiting response behavior reflective of different underlying response processes. Application to real data from the Students Like Learning Mathematics (SLM) scale of Trends in International Mathematics and Science Study (TIMSS) 2015 demonstrates the superior comparative fit of the mixture representation, as well as the consequences of applying the mixture on the estimation of content and response style traits. We argue that methodology applied to investigate response styles should attend to the inherent uncertainty of response style influence due to the likely influence of both response styles and the content trait on the selection of extreme response categories.
Keywords
Item response tree (IRTree) models have become a popular methodological approach for the measurement of response styles (Böckenholt, 2012; Böckenholt & Meiser, 2017; Jeon & De Boeck, 2016; Khorramdel & von Davier, 2014). Central to the application of such models is the assumption of a sequential process by which respondents arrive at chosen response categories. Typical applications of IRTree models assume a single response process that applies across all respondents, an assumption that seems important to confirm. In practice, however, assuming all respondents follow the same response process may be unrealistic. The assumption of a single common response process can be easily violated particularly when modeling response styles, which by definition are content-irrelevant tendencies in the selection of response categories (Paulhus, 1991). It is conceivable that for some respondents, the selection of extreme categories may be content-irrelevant, while for other respondents, the selection of extreme categories is content-relevant.
In this article, we illustrate the application of a mixture IRTree model to self-report rating scale data to account for such a phenomenon. We show how a mixture approach can accommodate the possibility that different traits may be relevant for different respondents in explaining their response category selection. In the presence of such a mixture, we observe, as expected, a reduced precision with which response styles are estimated. As we argue in the discussion, the mixture IRTree generalization brings the IRTree methodology closer to the mixture item response theory (IRT) and multidimensional IRT approaches alternatively used to measure response styles.
The article is organized as follows. First, we review the IRTree approach to modeling response style, focusing on a simple model for extreme response style (ERS) applied to a four-category rating scale. Second, we present a competing IRTree model that explains the extreme category responses using only the content trait. In the presence of competing IRTree models, we demonstrate through simulation analyses the potential use of a mixture IRTree model to evaluate whether a single tree or multiple trees appear to be present in the data. In that context, we evaluate the success of a Bayesian estimation approach both in detecting the presence of distinguishable classes, as well as in recovering the relevant model parameters for each class, both at the respondent (class membership) and sample (mixture proportions) levels. Third, we apply the mixture approach to a real test data set to demonstrate the practical reality of the mixture approach. We seek to demonstrate that a primary consequence of the presence of a mixture concerns its effects on the precision with which response styles are measured.
Response Styles and IRTree Models
Response styles have long been recognized as a threat to the validity of measurement. By definition, response styles refer to systematic tendencies to select response categories in ways that are unrelated to the content of item/test (Paulhus, 1991). One of the most frequently observed response styles is ERS, which refers to the tendency to overselect extreme response categories (De Jong et al., 2008; Greenleaf, 1992). ERS is desirable to measure not only because of its frequent and statistically detectable presence but also due to its potential to contaminate the estimation of the content trait. Ignoring the possibility that extreme responses can be due to ERS may yield an under- or overestimation of the content trait. Moreover, extreme response styles tend to correlate with other respondent characteristics. Specifically, many researchers have found that both individual- and country-level variables such as sociodemographic, personality, and cultural characteristics can correlate with ERS (Austin et al., 2006; Chen et al., 1995; De Jong et al., 2008; Greenleaf, 1992; Johnson et al., 2005; Meisenberg & Williams, 2008; Naemi et al., 2009; see Van Vaerenbergh & Thomas, 2013, for more details). Such correlations open the potential for ERS to contribute bias to the estimated relationships between the content trait and other criterion variables.
IRTree models have been proposed for modeling response styles (Park & Wu, 2019; Plieninger & Meiser, 2014). IRTree models (Böckenholt, 2012; De Boeck & Partchev, 2012; Jeon & De Boeck, 2016) characterize the underlying response processes associated with response selection using a sequential decision tree structure where IRT measurement models represent the outcomes at each decision node. For example, responses to a four-category item with categories “1 = Strongly Disagree, 2 = Disagree, 3 = Agree, and 4 = Strongly Agree” might be specified as a two-stage selection process involving three decision nodes (as shown in Figure 1). At the first decision node, the respondent chooses whether to agree or disagree with the item based on their content trait

Illustration of an extreme response style (ERS) item response tree (IRTree) model for responses to a 4-point Likert-type scale item.
An implicit assumption of IRTree models is that both the decision tree structure and the nature of the underlying traits involved at each decision node are the same across all respondents. This assumption might be questioned to the extent that different respondents could choose the same response category for different reasons. We might anticipate, for example, that for a certain subset of respondents, selection of the extreme categories at the second stage is not due to a response style, but is instead a further manifestation of their underlying content trait
Statistical Representation of an IRTree Model for Extreme Response Style
A common approach to translating an IRTree model such as in Figure 1 (“ERS IRTree model”) to a statistical representation makes use of pseudo-items that correspond to the binary outcome at each decision node. We denote the outcome at decision node k for respondent
Given this coding of pseudo-items, the probability of an outcome at a decision node is represented using an IRT model. In this article, we assume a two-parameter logistic model for all nodes. For decision node

where

where

where

In typical practice, the specification of an IRTree model can be compared against a traditional unidimensional IRT model applied to polytomously scored items (e.g., the generalized partial credit model) to verify the presence of extreme response style (see e.g., Böckenholt & Meiser, 2017). In these applications, however, the IRTree model assumes the same response process and the same traits are invoked for all respondents across nodes. The possibility that different respondents provide responses for different reasons leads to consideration of a mixture representation.
Generalization of an IRTree Model to Accommodate a Mixture of Trees
An Alternative Model: The Ordinal IRTree Model
As an alternative to the ERS IRTree model, we consider a model that assumes a similar sequential process, but where the content trait underlies decisions made at all three nodes. As a result, the general tree presentation in Figure 1 still applies, but the decisions made at the second stage (Nodes 2 and 3) are assumed to be influenced by

Illustration of an ordinal (ORD) item response tree (IRTree) model for responses to a 4-point Likert-type scale item.
The outcome at each decision node is consequently modeled as

for
Note that the same pseudo-items created for the ERS model can also be applied in fitting the ORD model. However, because the outcome for Node 2 is reversed under the ORD model compared with the ERS model (i.e.,

for the ORD model using the pseudo-item created under the ERS model. In this way, each of the ERS and ORD IRTree models can be fitted to the same pseudo-items. Similar to the ERS IRTree model, an assumption of local independence across nodes makes the probability of selecting category

where
A Mixture of ERS and ORD IRTree Models
The ORD model is naturally a competitor to the ERS model and could be statistically compared with the ERS IRTree model. However, when both models are viewed as applicable across a population of respondents, we can also formulate a mixture IRTree model in which each of the ERS and ORD IRTree models defines a latent class in the mixture. Under a mixture representation, each respondent is assumed to have a latent membership in either the ERS or ORD class across all item responses. As can be seen in Figures 1 and 2, the two classes are distinguished by whether the decisions at Stage 2 (Nodes 2 and 3) are affected by the content trait
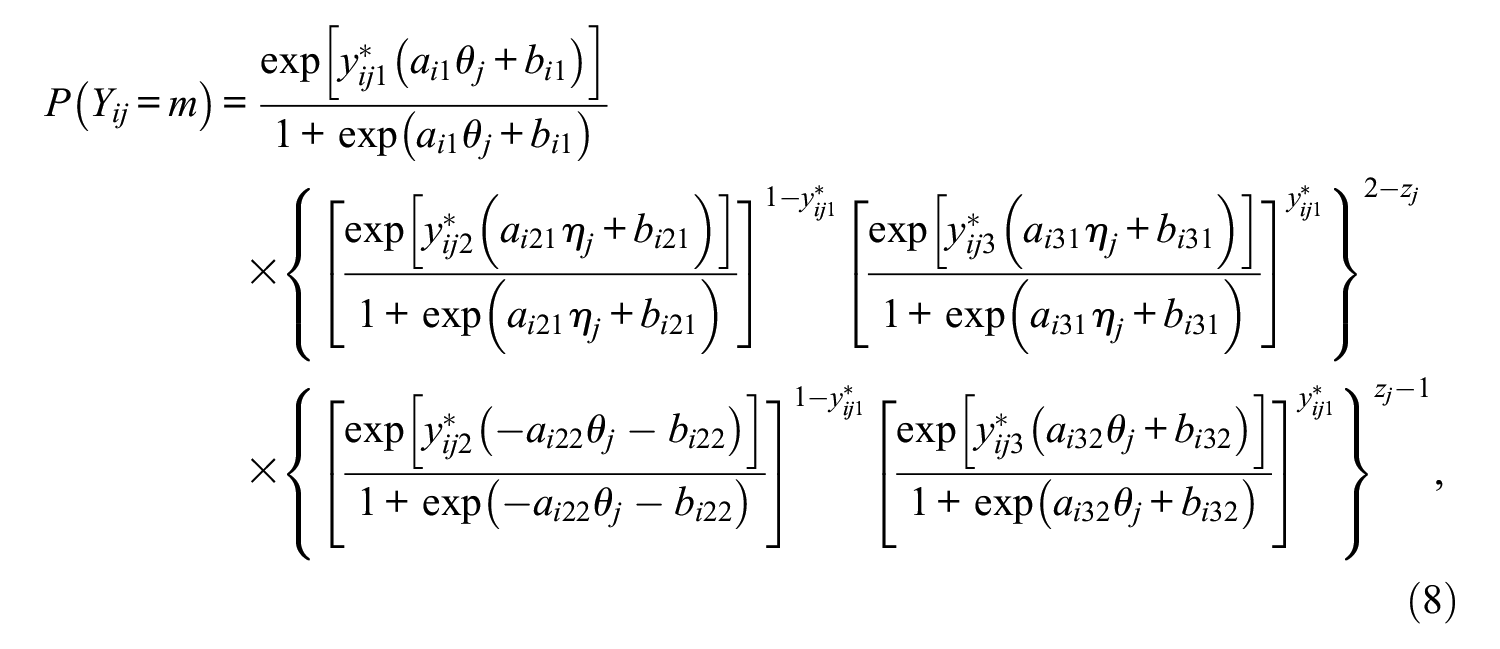
where
Table 1 summarizes the pseudo-item outcomes that correspond to each item category response and the probability of responses at each node for each model (class) in the mixture model. We present the pseudo-item outcomes created under the ERS model and, therefore, use Equation (6) for the probability at Node 2 for the ORD model.
A Summary of Information for the Mixture Item Response Tree (IRTree) Model.

Note. The extreme response style (ERS) IRTree model and ordinal (ORD) IRTree model respectively defines a latent class in the mixture IRTree model.
The possibility of a mixture in relation to an IRTree model was also considered by Tijmstra et al. (2018). In their approach, a mixture is proposed in which respondents either conform to an IRTree model or a generalized partial credit model in which all the response categories are an ordinal reflection of the underlying latent trait. In this article, we take an alternative approach based on the aforementioned mixture of IRTree models. The use of a mixture of IRTree models has a couple of advantages over the mixture proposed by Tijmstra et al. (2018). First, it offers the ability to link the same content trait across trees (through the assumption of common item parameters at the first node), permitting estimation of a single-content trait that applies across models. A second related advantage is that by applying a common tree structure across models in the mixture, the uncertainty attached to class membership becomes manifest in the uncertainty (measurement error) in the trait estimates for each model. This proves important in the current application in that it makes it possible to examine how uncertainty regarding class contributes to uncertainty in the content
Another approach using mixture models in the context of multidimensional IRT to attend to response styles was recently presented by Khorramdel et al. (2019). The Khorramdel et al. (2019) approach is implemented through a three-step procedure in which mixture IRT is applied in the second step to the pseudo-items corresponding to Nodes 2 and 3 (in isolation of the Node 1 pseudo-items), and is also exploratory in nature. The current approach formally defines one class to have a statistically identical trait for Nodes 1, 2, and 3 (the ORD class), and in this respect is a constrained mixture model. As a result, there are clear statistical differences between the approaches; a formal empirical comparison is beyond the scope of this article and an area for future research.
Simulation Analyses
We evaluated the mixture IRTree model and its estimation using a fully Bayesian estimation algorithm with simulated data. We focus our simulation on evaluating how well the model identifies the mixture of classes (both at respondent and sample levels) and recovers item and respondent parameters. The ERS and ORD IRTree models in Equations (3) and (7), respectively, were used to generate response patterns for respondents in Classes 1 (ERS class) and 2 (ORD class). Responses for a total of 1,000 respondents to 15 four-response category items were generated. We systematically varied the proportion of respondents in each class: (
Step 1. Generate person parameters
Step 2. Generate item parameters
Step 3. Assign class membership parameters (
Step 4. Calculate the probability of each respondent selecting category
Step 5. Generate multinomial responses from 1,000 respondents to 15 items, using the probabilities calculated in the previous step.
Step 6. Transform the categorical responses to pseudo-items based on the ERS tree structure, as shown in Table 1. (Recall that the ORD tree structure can be fitted to ERS tree pseudo-items by forcing the discrimination parameter at the second node to be negative as opposed to positive; see Equation [6].) The final data set consequently has binary responses from 1,000 respondents to 45 pseudo-items (15 items * 3 nodes) with the irrelevant pseudo-items coded as missing.
Step 7. Repeat Steps 5 and 6 within each condition to generate 10 data sets for each mixing proportion condition.
Step 8. Repeat Steps 3 through 7 for each of the mixing proportion conditions.
We fit the IRTree mixture model involving ERS and ORD classes to each of the generated data sets using a Bayesian (Markov chain Monte Carlo) estimation algorithm applied using JAGS (Just Another Gibbs Sampler) 4.3.0 (Plummer, 2017). To run JAGS from the R software, the jagsUI package (Kellner, 2019) was used. The prior distributions used for the item parameters
To compare the mixture IRTree model against the use of a single IRTree model, we also separately fit the ERS and ORD IRTree models to the same data sets to examine whether the mixture model emerges as superior in the presence of two classes. The same prior distributions as used in the mixture model were applied for the corresponding parameters under each single IRTree model. Due to the reduced complexity of these models, five chains were run for each analysis and a total of 15,100 iterations for each chain. As above, this number of iterations was found sufficient to achieve convergence according to the Gelman–Rubin criterion. The first 100 and 5,000 iterations were discarded as adaptive and burn-in iterations, respectively. The resulting posterior distributions were constructed from the 10,000 post burn-in iterations again using a thinning interval of 10, implying a total of 1,000 iterations from five respective chains for determination of parameter estimates.
Simulation Results
Model Fit Comparisons
We first compared the fit of the mixture IRTree model with that of the single ERS and ORD IRTree models. The deviance information criteria (DIC) for the models, obtained from the first simulated data set, are reported in Table 2. The DIC is calculated as the sum of the mean deviance to a penalty based on the complexity of the model (the effective number of parameters, denoted as pD). As expected, for the data sets that only contained respondents from one of the two classes, that is (
Deviance Information Criterion (DIC) Results for the Mixture, Extreme Response Style (ERS), and Ordinal (ORD) IRTree Models for Five Different Mixture Proportion Conditions, First Simulated Data Set for Each Condition.

Note. The smallest DIC value for each condition is in boldface. pD = effective number of parameters.
Estimation of Latent Proportions and Classification Accuracy
The ability of the mixture IRTree model to correctly capture the mixture of respondents in the data can also be inspected by looking at how well the model estimates the mixing proportion parameters (


where
As can be seen in Table 3, the bias and RMSE are all very small (less than 0.01) using the fully Bayesian estimation approach, indicating that the mixture model estimates the true proportion of respondents in each class accurately. At the respondent level, the estimate of class membership (
Bias and Root Mean Square Error (RMSE) of the Estimated Latent Proportion

Recovery of Pseudo-Item Parameters
We also examined how well the mixture model recovers the pseudo-item parameters. Table 4 displays the bias and RMSE of the item parameters
Bias and Root Mean Square Error (RMSE) of the Item Parameter Estimates Across Mixture, Extreme Response Style (ERS) and Ordinal (ORD) IRTree Models by Mixing Proportion Condition.

The absolute values of bias are averaged over items and nodes.
Precision (Posterior Standard Deviations) of Respondent Parameter Estimates
Appendix A displays results in terms of the bias and RMSE of respondent parameter recovery (for both
Of particular interest in the current application, however, is the way in which the mixture approach represents the precision of the respondent parameter estimates. As we suggested in the introduction, an anticipated consequence of applying the mixture IRTree model is that it will appropriately account for the uncertainty present in respondent parameter estimates due to the uncertainty of the respondent’s response process. As seen in Figure A2 in Appendix A, both the mixture and ERS models produce equivalently large errors for many of the

Average posterior standard deviations (PSDs) of θ and η in relation to the parameters, for mixture, extreme response style (ERS), and ordinal (ORD) IRTree models, for (P1, P2) = (0.5, 0.5) condition.
For the posterior standard deviations of
To evaluate the accuracy of the precision of estimates, we can examine the proportion of the 95% credible intervals that contain the true parameter values for each parameter under each modeling approach, as shown in Table 5. For the leftmost columns of the table, we see that for the
The Proportion of 95% Credible Intervals for

0.025th and 0.975th quantiles of the standard normal distribution are used for the interval.
From the rightmost three columns in Table 5, we likewise see that the intervals derived from the mixture model mostly include
Real Data Application
The mixture model was also fitted to actual data to demonstrate the presence of a mixture of respondents in self-report rating scale items as well as to show a real-world illustration of the results seen in the simulation. The data were collected through a survey from the Trends in International Mathematics and Science Study (TIMSS) 2015 (for Grade 8). We used responses from 1,000 randomly sampled respondents from the U.S. administration of the nine items for the Students Like Learning Mathematics (SLM) scale. Each item was rated using four response categories: disagree a lot, disagree a little, agree a little, and agree a lot. We converted the item scores to pseudo-item responses based on the ERS IRTree model and fitted the mixture model to the data using JAGS with the same specifications as for the simulation analyses reported above. As in the simulation analyses, we also fitted the single ERS and ORD IRTree models.
We validated the presence of a mixture by comparing the model fit and examining the estimated latent proportions for each class as well as estimated class memberships of individuals in the mixture model. The comparative model fits are provided in Table 6. As can be seen, the mixture IRTree model produces the smallest DIC value, suggesting a better fit in comparison to the other two single IRTree models. Also, we can observe from the first row in Table 7 that the latent proportions for each class estimated from the mixture model are about 0.3 (ERS class) and 0.7 (ORD class), respectively, roughly agreeing with the proportion of respondents actually classified to each class (as can be seen in the second row in Table 7).
Deviance Information Criterion (DIC) Results of the Mixture, Extreme Response Style (ERS), and Ordinal (ORD) IRTree Models for TIMSS Students Like Learning Mathematics (SLM) Scale Data.

Note. The smallest DIC value is in boldface. TIMSS = Trends in International Mathematics and Science Study; pD = effective number of parameters.
Estimated Latent Proportions and the Number of Respondents Classified to Extreme Response Style (ERS) and Ordinal (ORD) Classes for TIMSS Students Like Learning Mathematics (SLM) Scale Data.

Note. TIMSS = Trends in International Mathematics and Science Study.
To illustrate the implications of applying single or mixture IRTree models to the data with a mixture of respondents, we provide some example response patterns and their corresponding trait estimates in Table 8. Note that the ERS and mixture IRTree models provide estimates of both
Example Response Patterns for TIMSS Students Like Learning Mathematics (SLM) Scale Data and Corresponding Content and Response Style Trait Posterior Means (Parameter Estimates) and Posterior Standard Deviations (PSD), Derived From the Mixture, Extreme Response Style (ERS), and Ordinal (ORD) IRTree Models.

Note. TIMSS = Trends in International Mathematics and Science Study.
The differences we see in the posterior means and standard deviations across models for the example patterns highlight some important differences between the mixture and single IRTree models. First, in comparing Respondents 4 and 603, we note that the content trait estimates (
Another aspect of using the mixture is seen when comparing the
This change in posterior means and standard deviations of
Figure 4 displays kernel-smoothed functions of the relationship between the posterior standard deviations (i.e., standard errors) of respondents’ person parameters and the respondents’ probability of belonging to the ORD class. The probability of ORD class membership indicates the uncertainty of the respondent’s true class membership. Note that the curve for

Average posterior standard deviations (PSD) of θ and η in relation to the posterior probability of ordinal (ORD) class membership, for the mixture, extreme response style (ERS), and ordinal (ORD) IRTree models, TIMSS Students Like Learning Mathematics (SLM) scale data.Note. TIMSS = Trends in International Mathematics and Science Study.
In summary, the pattern of results we observe in the real data resembles quite closely the effects seen in the simulation. The assumption of a single class IRTree model, whether an ERS IRTree or an ORD IRTree, overstates the precision of the estimated respondent traits when both response processes may be present in the respondent population. The use of a single IRTree model should thus be supported by evidence of its validity across all respondents; our results suggest that a mixture may likely be present, in which case model estimates should be sensitive to the unknown class to which the respondent belongs.
Conclusions
IRTree models have become a popular way of measuring response styles for self-report rating scale assessments. Such models associate a response process (represented in the form of a decision-making tree) with content and response style traits that underlie the different decision-making nodes within the tree. The separation of traits across nodes enhances the ability to measure response style traits but comes at the cost of assuming the same response process (associated with the same traits across respective steps in the process) for all respondents.
In this article, we demonstrate through a real data application the likelihood that no single IRTree may best characterize all respondents, and that a better representation of the response process may be achieved by allowing a mixture of trees. We demonstrate this possibility in the context of a commonly used IRTree model for extreme response style by considering also an alternative IRTree model that assumes the content trait is relevant at all decision nodes. The better comparative fit of the mixture model confirms such a mixture. Some of the more immediate implications of the mixture relate to the precision with which the content and response style traits are assumed to be measured. We suggest that the likely presence of a mixture introduces what should be viewed as the core challenge in attempts to measure response styles such as ERS, namely the uncertainty that exists as to whether the selection of an extreme response category is due to the content trait, a response style, or some combination of these factors. Through a mixture IRTree model approach, it becomes possible to see how the uncertainty of class membership impacts the estimation of both the content and response style traits. As expected, the extreme response styles tend to show larger posterior standard deviations (i.e., standard errors of estimates) when allowing for a mixture. We contend that this uncertainty, already an implicit part of both mixture IRT (von Davier & Rost, 1995) and multidimensional IRT (Bolt & Johnson, 2009) approaches to measuring response style, is important to consider when psychometric models are used to measure response styles. As Adams et al. (2019) note, attending to this uncertainty has various practical implications related to the design of survey instruments, in particular, the value of having psychometrically heterogeneous items, as well as the relevance of having external criteria (e.g., anchoring vignettes, content-heterogeneous items) to more accurately measure response styles.
Although not explored in this article, a mixture tree representation arguably brings the IRTree methodology closer to that observed with mixture and multidimensional IRT models of response style. Future comparative studies of response style methods in this context would be useful. Along these lines, Meiser et al. (2019) also demonstrate the possibility that the outcome at a single decision tree node might be influenced simultaneously by both a content trait and a response style trait. In a similar way, such a model might also be anticipated to return reduced precision in the estimated response style trait due to the less certain roles the content and response style traits play in response category selection.
Of course, despite our use of a mixture model in this article, it is also conceivable that for an individual respondent the causes of extreme responses may also vary within a single respondent across items. For example, a respondent may for some items select an extreme category as a result of the content trait, and for other items a response style. This possibility was not considered in this article. It may be difficult to model such behavior unless a test is sufficiently long. Another issue not considered in this article concerns the potential for bias in the estimates of latent traits when failing to account for a true mixture. It is not difficult to envision scenarios whereby not only will precision be misestimated, but the trait estimates themselves become biased when a mixture is present but is not accounted for. We leave such investigation to future study.
In conclusion, we suggest that regardless of the methodology chosen in modeling response style, more attention should be devoted not just to focus on point estimates of content and response style traits returned but also the precision of those estimates. Such attention can make apparent where response styles can and cannot be successfully measured and will also make more apparent how different approaches to measuring response style may differ.
Supplemental Material
FigureA1 – Supplemental material for A Mixture IRTree Model for Extreme Response Style: Accounting for Response Process Uncertainty
Supplemental material, FigureA1 for A Mixture IRTree Model for Extreme Response Style: Accounting for Response Process Uncertainty by Nana Kim and Daniel M. Bolt in Educational and Psychological Measurement
Supplemental Material
FigureA2 – Supplemental material for A Mixture IRTree Model for Extreme Response Style: Accounting for Response Process Uncertainty
Supplemental material, FigureA2 for A Mixture IRTree Model for Extreme Response Style: Accounting for Response Process Uncertainty by Nana Kim and Daniel M. Bolt in Educational and Psychological Measurement
Supplemental Material
Mixturetree_AppendixA – Supplemental material for A Mixture IRTree Model for Extreme Response Style: Accounting for Response Process Uncertainty
Supplemental material, Mixturetree_AppendixA for A Mixture IRTree Model for Extreme Response Style: Accounting for Response Process Uncertainty by Nana Kim and Daniel M. Bolt in Educational and Psychological Measurement
Footnotes
Declaration of Conflicting Interests
The author(s) declared no potential conflicts of interest with respect to the research, authorship, and/or publication of this article.
Funding
The author(s) received no financial support for the research, authorship, and/or publication of this article.

Supplemental Material
Supplemental material is available for this article online.
References
Supplementary Material
Please find the following supplemental material available below.
For Open Access articles published under a Creative Commons License, all supplemental material carries the same license as the article it is associated with.
For non-Open Access articles published, all supplemental material carries a non-exclusive license, and permission requests for re-use of supplemental material or any part of supplemental material shall be sent directly to the copyright owner as specified in the copyright notice associated with the article.


