
Abstract
Objective
Evaluate and model the advantage of a situation awareness (SA) supported by an augmented reality (AR) display for the ground-based joint terminal attack Controller (JTAC), in judging and describing the spatial relations between objects in a hostile zone.
Background
The accurate world-referenced description of relative locations of surface objects, when viewed from an oblique slant angle (aircraft, observation post) is hindered by (1) the compression of the visual scene, amplified at a lower slang angle, (2) the need for mental rotation, when viewed from a non-northerly orientation.
Approach
Participants viewed a virtual reality (VR)-simulated four-object scene from either of two slant angles, at each of four compass orientations, either unaided, or aided by an AR head-mounted display (AR-HMD), depicting the scene from a top-down (avoiding compression) and north-up (avoiding mental rotation) perspective. They described the geographical layout of four objects within the display.
Results
Compared with the control condition, that condition supported by the north-up SA display shortened the description time, particularly on non-northerly orientations (9 s, 30% benefit), and improved the accuracy of description, particularly for the more compressed scene (lower slant angle), as fit by a simple computational model.
Conclusion
The SA display provides large, significant benefits to this critical phase of ground-air communications in managing an attack—as predicted by the task analysis of the JTAC.
Application
Results impact the design of the AR-HMD to support combat ground-air communications and illustrate the magnitude by which basic cognitive principles “scale up” to realistically simulated real-world tasks such as search and rescue.
Introduction
The job of the joint terminal attack controller (JTAC) near the battlefield is to integrate information about enemy attack units and nearby friendly forces and direct aircraft equipped with weapons to neutralize the enemy via close air support, while also safely coordinating and routing air traffic (United States Marine Corps, 2014; Wickens et al., 2019). In particular, in managing one critical phase of the call for fire, the job of the JTAC is to verbally describe the relative location of people/objects that are near to the target to the pilot so that they can be avoided, as well as directing the pilot to the correct target location. In this, and other tasks, the JTAC tasks are currently supported by a variety of nonintegrated, often head down, information sources with little automation, such as binoculars, laser range finders, charts, notepads, and radios—although an interactive Android-based tablet map of the battlefield is being adopted by U.S. Marine Corps ground forces. Because the JTAC must operate in a mobile environment and often on foot, in order to support such multitasking and information integration, we harnessed the technology and principles of head-mounted display (HMDs) design from aviation rotorcraft operations (Dey et al., 2018; Wickens et al., 2004). Furthermore, because of the geospatial environment in which the JTAC operates, and the need to identify and locate objects within that 3D space, we also harnessed augmented reality (AR), in order to provide pointers to, or otherwise identify and locate, entities within that environment visible in the far domain.
In several of the tasks carried out during attack management, the JTAC must judge the spatial location of several objects in and around the target zone (e.g., enemy and friendly vehicles and structures). Nowhere are these judgments more important than during the phase just prior to the attack, in which JTAC and pilot must communicate with each other to assure the correlation or correspondence between what the pilot sees and what and where is the true target that the JTAC is describing, in terms of relative locations of objects within the target area. This task is performed under high time stress, dictated by the pilot’s speed of approach to the target area.
The objective of the current experiment was to evaluate a display that would mitigate two of the perceptual-cognitive limitations, described in detail below, that can compromise performance on this task
The JTAC and pilot will likely have different viewpoints of the target area: the JTAC from a slightly elevated observation point on the ground if such is available with perhaps at a 5–20º elevation slant angle, and the pilot, approaching from what is likely a different direction (azimuth) at what may be a considerably higher slant angle. Thus, in describing locations in this environment requiring shared situation awareness, the JTAC should be doing so within an allocentric or world-referenced frame of reference, using terms like “north” or “west” to refer to relative positions. This is in contrast to the egocentric terms like “left of,” “beyond,” or “right of,” because obviously, what is “right of” a given ground object from the JTAC’s perspective, may not be “right of” from the pilot’s perspective. That is, the JTAC should possess a world-referenced, allocentric “mental model” of the attack area. Such a perspective, if available on a display, eliminates the need for time-consuming and error-prone mental rotation of the map into a world-referenced frame (Aretz & Wickens, 1992; Hickox & Wickens, 1999; Macedo et al., 1998; Olmos et al., 1997; Schreiber et al., 1998; Wickens et al., 2005) in order to provide spatial guidance to the pilot.
We used virtual reality (VR) on an HMD to support the JTAC in this, and other tasks, which includes a display feature described as instance situation awareness (ISA). This depicts the target area from a 90º (straight down) elevation angle in a mode that, in the current experiment was rendered in a north-up (world referenced), allocentric orientation (Figure 1). The ISA imagery is assumed to be captured by an overhead unmanned air vehicle (UAV). The ISA display is attached to that target area, as a signpost in VR, so that its image is always linked to the area as the head rotates. In this experiment, we examine the magnitudes of the ISA’s world referenced benefits for this particular phase of the JTAC task.

Typical scenario image with the ISA circle and four spatial descriptions. The “SE” seen on the right side of the image is actually part of the AR compass ring, running along the top of the display. This indicates that at the moment, the participant is looking east. Note. AR = augmented reality.
In addition to the north-up mode, the second feature of ISA, designed to support the JTAC’s task is the 90º elevation angle or slant angle. This is intended to eliminate the distortions of estimating (and hence describing) absolute and relative distances between objects on the ground. With direct viewing of the target zone from whatever height is available for the JTAC’s observation post (usually a very low slant angle), perceived distances will be distorted, and in fact often underestimated by what is described as line-of-sight compression (Ellis et al., 1991; Hickox & Wickens, 1999; Schreiber et al., 1998; Smallman et al., 2002; Wickens, 2002).
Figure 2 illustrates this compression effect, depicting the JTAC positioned on a viewing platform (hill, building), viewing the target area from a given elevation above. The trigonometric combination of elevation and viewing distance determines the viewing elevation angle, or slant angle, a critical variable in our research. In this example, the target area consists of three hypothetical objects, here represented by the letters X, Y, and Z. Importantly, the true distance along the JTAC’s line of sight to the target zone separating X and Y is D1. Above the JTAC are depicted two geographical “maps.” At the top is depicted the true location of the three objects on the ground, and this is what is also represented in the ISA map. In Figure 2, it is the compressed physical representation that the JTAC will see, as a retinal image. Note that the physical, and hence sensed, distance between X and Y here is D2. Hence, the amount of compression is the ratio D1/D2, assuming both are rendered as viewed at the same distance. To the extent that the judgment of true distance is distorted by a failure to compensate for viewed compression in perceived distance, a phenomenon well established in the literature (e.g., Ellis et al., 1991), the reporting of D1 will be underestimated, and more so to the extent that the elevation angle is lower: the circular target area becomes “flattened,” and the perceived D2 is also reduced.
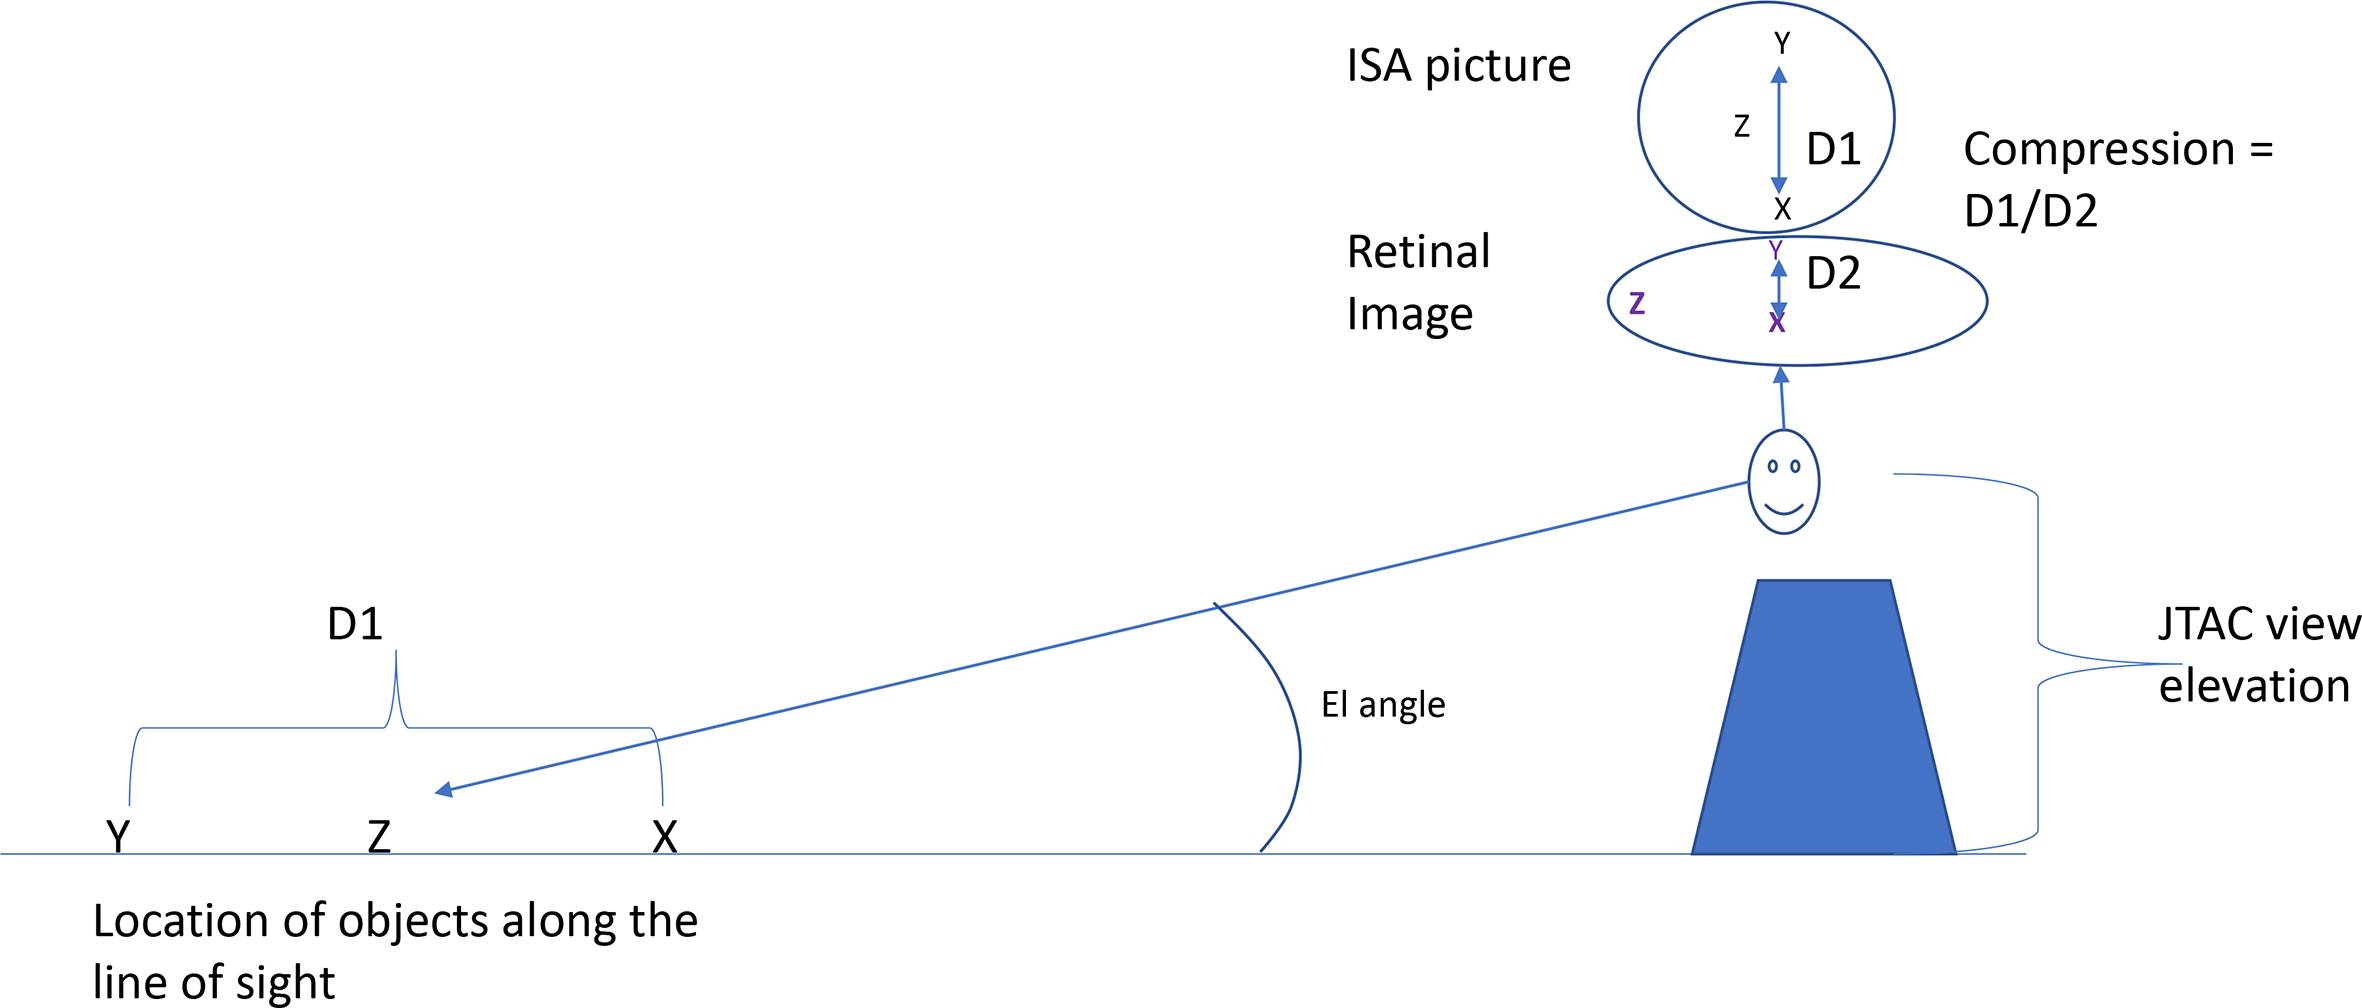
Geometric effect distortions caused by elevation angle, as described in the text. Note. ISA = instance situation awareness; JTAC = joint terminal attack controller.
In fact, this undesirable compression effect (McGreevy et al., 1986) can be modeled directly as in Figure 3 based on geometric calculations as Smallman et al. (2002) have done. The blue line depicts the ratio of the true length of a vector oriented along the viewing axis or line of sight to the length of that vector projected on a viewing surface orthogonal to the line of sight. This is the Y axis value. Importantly, the blue solid curve is not linear but is exponential and indeed will approach infinity as the viewing elevation angle approaches 0. At this level, viewing the target area from ground level, objects X and Y will overlay each other signaling no distance between them (infinite compression).
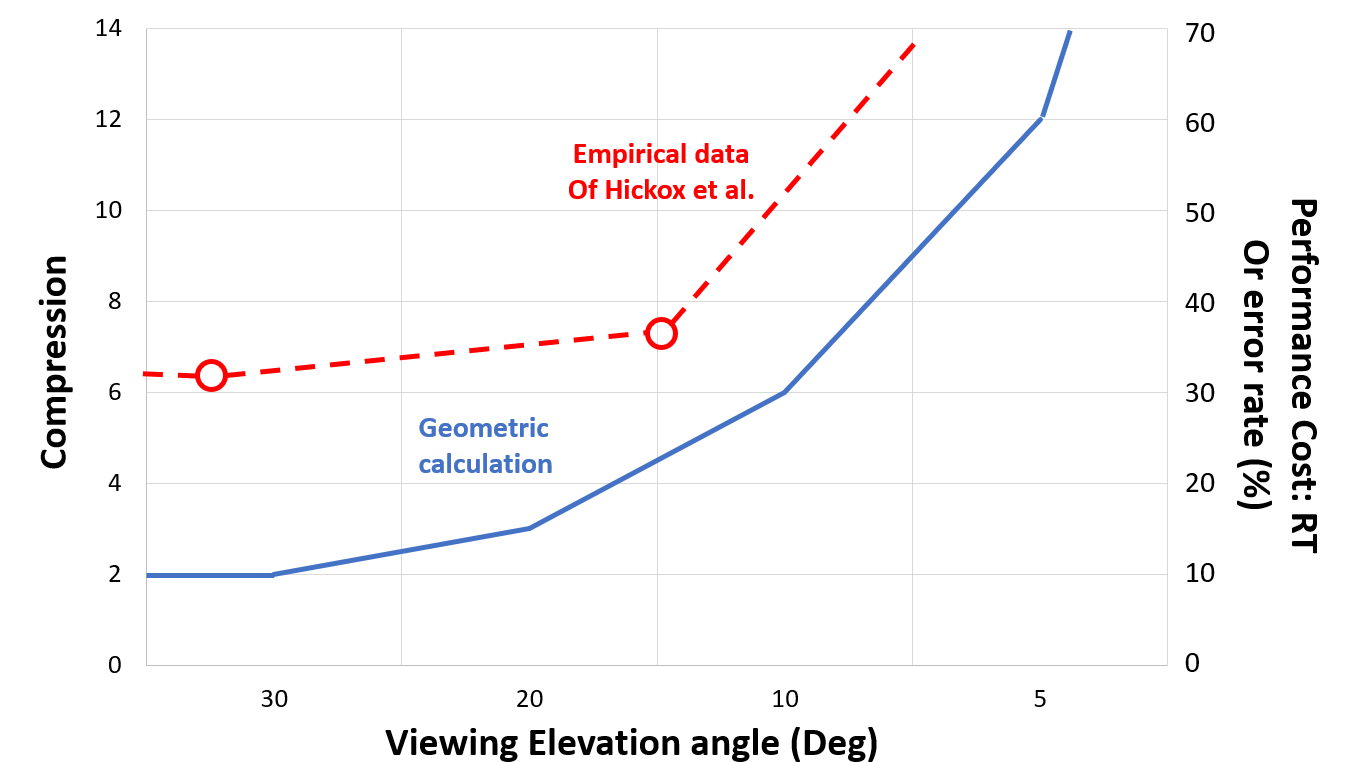
Compression as a function of viewing elevation angle or slant angle. The blue solid line is the geometrical calculation described in the text. The red dashed line at the top represents experimental response time (RT) data from Hickox and Wickens.
It is also noteworthy that the compression effect will affect judgments of bearing or angle, as well as those of distance, as represented by the angle between objects Z and Y in Figure 2. In the true (ISA) map of the world, the angle between Z and Y is near parallel to the line-of-sight vector. But in the compressed visual image, that angle is perceived as near perpendicular to that line of sight.
Figure 2 and the solid line of Figure 3 present geometric analysis of the actual compression distortion of the image, as it appears on the retina. The question is, to what extent do these distortions affect performance judgments of distance and angle, in which some, but possibly inadequate perceptual compensation for compression by the observer is applied. Data from fundamental psychophysical judgments suggest that such compensation is inadequate (Ellis et al., 1991; McGreevy et al., 1986; Smallman et al., 2002). More relevant to the current experiment is the extent to which variation in elevation angle imposes the nonlinear performance cost function in speed and/or accuracy seen (Y axis) in Figure 3 on performance judgments in more realistic tasks of geospatial image understanding and interpretation. These costs are scaled on the right Y axis of Figure 3.
Such performance data are provided in aviation display experiments by Hickox and Wickens (1999) and Schreiber et al. (1998), in which licensed pilots made judgments of the equivalence of the relative position of objects in two electronic images each depicted from different elevation angles. A wide range of elevation angles, and disparities of elevation angles between the two images were examined. Of the many conditions (elevation angular disparities) examined, three provide data relevant to the current design. Hickox and Wickens (1999) found that when participants compared the map image from 90º (our ISA elevation angle) with forward view images at 60º, 37º, and 15º elevation angles (equal intervals, increasing compression), the response time (RT) to judge equivalence increased at a nonlinear (exponential) rate of 6.5 s, 6.8 s, and 8.0 s, respectively, reflecting the predicted pattern of compression effects on performance shown in Figure 3 (right vertical axis). This trend in the empirical data is indicated by the red points and heavy dashed red lines. We have not extended the x axis back to the 60º angle, but the red line extrapolates to where that would be. Also, since Hickox and Wickens (1999) did not collect data at lower slant angles than 15º, we do not have a fourth data point to connect, but instead, we direct the red line to the right more sharply upward to eventually become vertical (infinite compression) as the x axis value approaches 0. This would be either chance accuracy or “infinite” RT. This geometric increasing trend in RT observed by Hickox and Wickens (1999) was also present in their accuracy data, but was less pronounced, and not depicted in Figure 3.
Schreiber et al. (1998) observed a trend of increasing RT with increasing compression corresponding to that found by Hickox and Wickens, but did not examine the specific 90º angle of the map. However, their study also examined the simultaneous transformations of vertical elevation slant angle and lateral mental rotation, as the two scenes to be compared were viewed from different headings as well as different elevation angles. They observed a small but significant mental rotation RT cost of
The two paradigms (Schreiber/Hickox with licensed pilots, versus the current study with ground observers) differ in a number of respects. In particular, the visual image comparison task employed in the two aviation studies is not the same as the image-description/recognition task that is employed here in the JTAC study (ego-referenced and compressed ground images in a control condition, and undistorted ISA images in a treatment condition). But both task paradigms are assumed to depend upon the cost of mental transformations of a visual image in order to compensate for compression and for a change in viewing position (azimuth) by mental rotation, and both paradigms invoke a nonlinear cost as compression increases to explain (the aviation studies) and predict (the current experiment) RT differences.
It is important to consider other domains in which operators can benefit from additional views to that provided by direct viewing along the line of sight, either because the latter is compressed (and compromised) by a low slant angle or because it is presented from a temporally undesirable azimuth angle. This is true in the Army with the Joint Fires Observer (JFO), for the tower controller in air traffic controller, for the forest fire fighter communicating with an aerial tanker, and in coordinating the motion of robots or unmanned air vehicles. In a more general sense, the compression phenomenon is relevant to determining the optimum viewing angle of unmanned air vehicles in search and rescue missions.
In the current experiment, we examine the potential benefits of both features of the ISA: (1) a vertical (−90º) look down slant angle designed to eliminate compression effects that will be predicted with both a 10º and a 20º slant angle from the simulated observation point, and (2) a north-up orientation, designed to eliminate mental rotation costs, in judging spatial relations between objects positioned on the ground and communicating them within an allocentric frame-of-reference. That is, within the schematics of Figure 2, what will be the degree of benefit of the ISA display (depicted above the head of the observer), relative to a control condition with no ISA in making judgments of the objects viewed at a slant angle? Thus, judgments with the north-up ISA are compared with those in a control condition.
In our experiment, the target region is viewed from any of the four cardinal directions; hence the advantage of ISA relative to a control condition in mitigating mental rotation should be smallest when the scene is viewed from a north-facing perspective and, if following the typical mental rotation functions for maps (Wickens et al., 2005), largest when viewing the scene, facing south. Furthermore, any advantage of compression elimination would likely be independent of, or additive with, the mental rotation costs, as observed by Schreiber et al. (1998), because different perceptual cognitive mechanisms are responsible for each. Finally, comparing performance with the ISA, to a scene viewed at either 20º or 10º slant angle, should reveal poorer performance in the control condition with the 10º (more compressed) slant angle, and hence a greater benefit of ISA at 10º than at 20º. In making this prediction, we do not assume that observers in the ISA condition will ignore the direct scene view entirely. This is because in at least one aspect, the forward view of the ground is superior to the ISA view (in our simulation and in the real world): the objects, viewed in 3D perspective “look” more like their object descriptions than from an overhead view. In addition, JTACs always want to cross-check the raw data in their direct view with any secondary data source.
In addition to compression angle, display support and facing direction, we examined participant background. Approximately half our participants were Army Reserve Officer Training Candidate (ROTC) cadets, and half were non-cadet participants. We reasoned that the data of these two groups might be different both because cadets would be more motivated to perform this simulated military exercise, and because they might have superior skills in spatial/navigational judgments.
Method
This research complied with the American Psychological Association Code of Ethics and was approved by the Institutional Review Board at Colorado State University and was obtained from each participant
Participants
Forty students, primarily undergraduates from a local university participated in the experiment. Eighteen of these participated in the experiment for course credit for a psychology class, and 22 were first- or second-year Army ROTC cadets, with no JTAC training, but some introduction to “call for fire.” They received other credit from their ROTC unit for their voluntary participation.
Task
Participants viewed a series of 40 scenario/trials viewing the stimulus environment shown in Figure 1. The virtual environment landscape was rendered on the HTC VIVE Pro, a VR HMD, with 120 × 70º FOV and a 90 Hz refresh rate. Near the center of each scene was a red “target circle” that contained four identifiable objects positioned around the target zone. These were a truck, two different colored buildings, a gas station, and a hangar. On any given trial, four of these were selected for display. Each trial/scenario differed in terms of the relative positioning of the four objects (random effects) and in terms of the facing direction when viewing the objects: north, east, south, or west. This direction could be revealed by the AR compass rose shown in Figure 1, which could be seen by a glance upward on the HMD. On half the trials, participants judged the relative position from the ground scene alone, the control condition, and on the other half they were aided in their judgment by the ISA circle, depicted in Figure 1 at the top. This circle shows the objects from a top-down north-up viewpoint, as if captured by an overhead UAV camera.
To assess their understanding of the spatial relation between the four objects, participants also saw four short one-line descriptions of the spatial relationship between pairs of objects, as shown in Figure 1, in the box above and to the right of the target zone. Only one of these descriptions was correct, and the correct description varied randomly in its position (1, 2, 3, 4) on the list. The description had three elements: the identity of two objects, a statement of the relative orientation of the two, and a statement of the distance (1 versus 2 units) between them. Thus, a typical description might be “the gas station is 2 south of the hanger.” Care was taken to assure that there was no ambiguity in the positioning of the two objects that represented the correct answer; that is, the relative distance between the two objects was clearly either 1 or 2 units (not in between), and the relative orientation within the correct option always lay along the four cardinal directions. While this task did not directly represent the task of the JTAC during the target correlation phase (which involves actually describing the position), we assumed that its performance proficiency in this paradigm is a proxy for assessing the accuracy of the mental model that would be required to produce an accurate description. This methodology, of description recognition, rather than asking them to provide a description, was selected for three reasons: (1) It would enable a more precise measure of RT, than waiting for an uncertain time until the researcher judged that the participant’s description was completed. (2) Its accuracy could be objectively calculated, whereas the accuracy of a description is more difficult to assess objectively. (3) The verbal judgment would require some verbal fluency and knowledge of procedures, an influence not of interest in our paradigm, and one which would create added sources of unwanted variability in both RT and accuracy, hence reducing statistical power.
Before the start of the trials, participants were presented with a black screen and were asked to indicate when they were ready to begin. On each trial, the ground image, the four descriptions and, if relevant, the ISA circle appeared simultaneously. Participants studied the image and description alternatives and spoke the digit of what they judged to be the correct description. Upon response, the experimenter marked the indicated digit and the black screen would again appear before starting the next trial. No feedback of answer correctness was provided.
Procedure
Participants first signed a COVID-19 symptom check, informed consent form, vision and citizenship certification form, and filled out a demographics survey. They were then given instructions on the task and, prior to the ISA block, specific instructions on how to use this display. They were shown static images of the five objects, with their labels (corresponding to how they were referred to in the descriptions). Also, prior to the block of ISA trials, they were shown images of the objects from the top-down viewpoint. They were then given five practice trials, and then 20 trials in each condition block, with a 5-min break between the two blocks. Because the two blocks were counterbalanced, slightly different instructions were given, prior to each block, for the two conditions. After all the trials were completed, the participants filled out a final survey on their experience. The total experiment lasted slightly under 1 hr.
Design
There were two within-participant variables: display, presented in two counterbalanced blocks of 20 trials each, and viewing angle. There were three between-participant variables: the counterbalancing order (control → ISA and ISA → control), viewing slant angle (10º vs. 20º), and cohort (ROTC cadets vs. non-cadets). For non-cadets, there were nine participants each in the two slant angle conditions. For the cadets, because of scheduling conflicts and COVID-19 complications, there were 14 participants in the 10º condition and eight in the 20º condition.
Each participant viewed one of the unique scenario-answer pairs twice, once within the ISA condition and once in the control condition. In each block, there were five occurrences of each of the four viewing orientations or “facing directions.” Facing directions were presented in a randomized (not blocked) order, and the same randomized order was presented to all participants.
Results
Initial analysis of the differences between the two cohorts (cadets and noncadets) revealed that there were no significant differences (p < .05) between the two in speed or accuracy, nor any interactions between the two with other variables (p > .05) to suggest that they might have responded differently. Hence the RT and accuracy data from the two groups were pooled and examined in a single four-way mixed-model ANOVA, assessing the effects of display mode (ISA vs. no), viewing slant angle (10º vs. 20º), facing direction (N, E, S, W), and the between-subjects variable of counterbalancing order (ISA → control vs. control → ISA). We present below first the effects of the first three variables and then any effects related to counterbalancing. One participant was removed from the entire data set of 35, as this participant showed very low accuracy, greater than 2.5 SDs below the mean transformed accuracy measure.
Response Time
There was a main effect of modality, showing a strong 8 s advantage of the ISA over the control condition (F(1, 19) = 113.52, p < .0005,
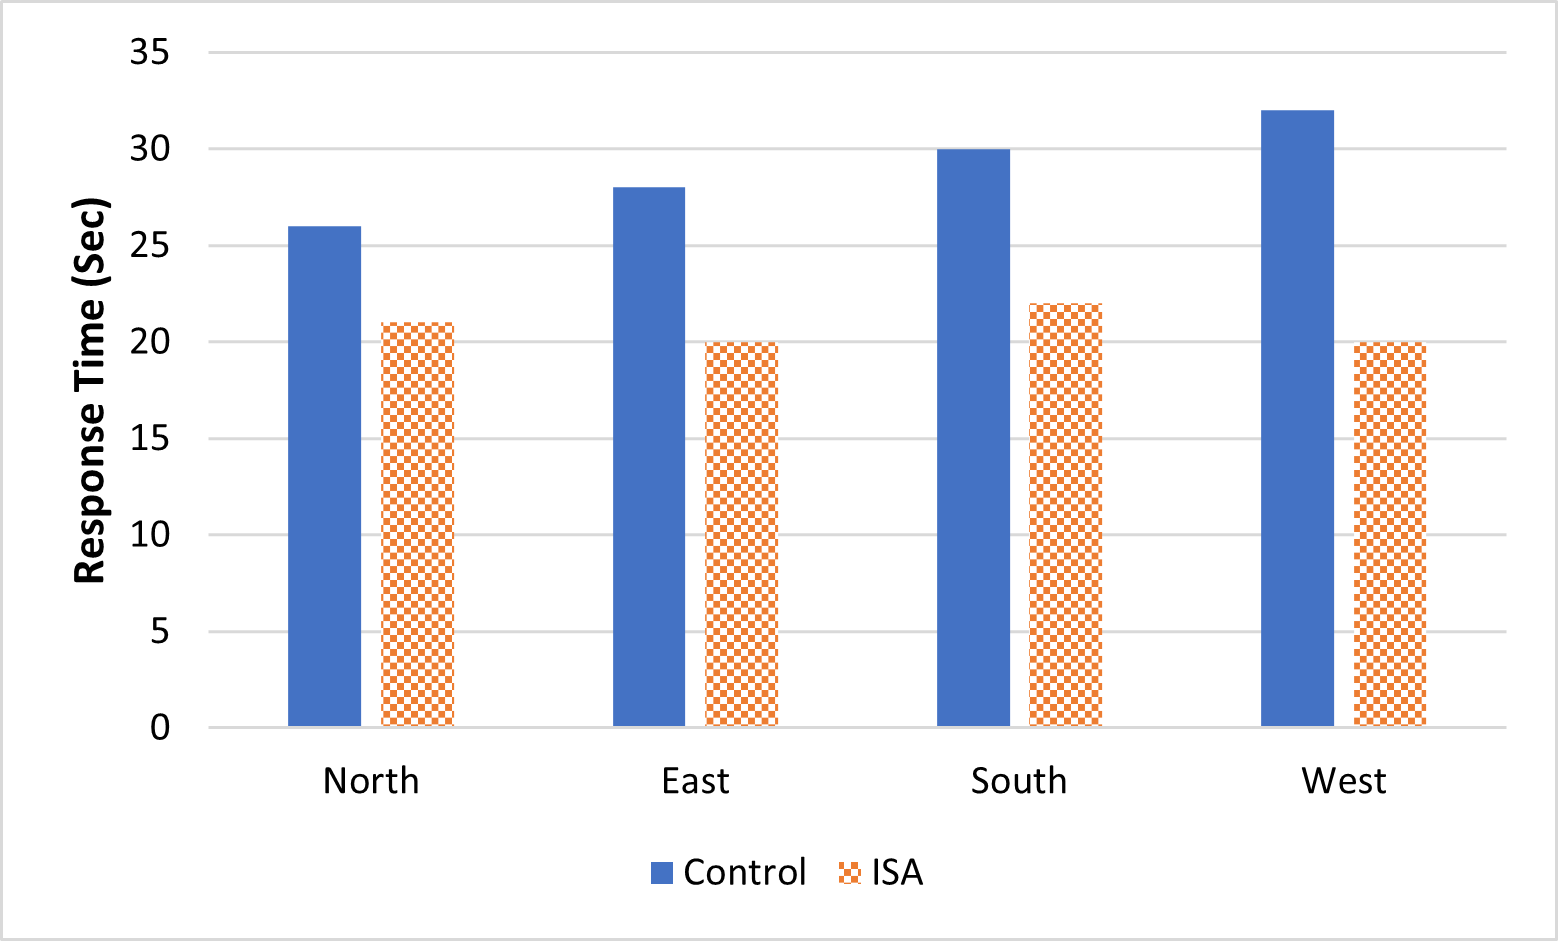
Effects of display modality and facing direction on response time. Control condition, blue solid; ISA condition, orange checkered bars.
The figure reveals that the advantage of the ISA (shorter RT) over the control condition is reduced (to 5 s), but still significant (t(189) = 5.24, p < .0005) when the ground terrain is viewed facing north. The RT advantage is considerably larger in the non-north directions, particularly when facing west. Phrased differently, the data reveal that, when viewing with the ISA, RT was entirely unaffected by facing direction. Viewing slant angle had no significant effect on RT (F(1, 26) =1.15,
The effect of counterbalancing order is shown in Table 1.
Interaction of Counterbalancing Order and Display Modality on RT

Note. ISA = instance situation awareness; RT = response time.
The only significant effect involving counterbalancing was the significant interaction between group and display mode (F(1, 19) = 18.32, p < .0005,
Accuracy
Because of the strong negative skew of the % correct data, these were arc sine transformed to produce a normal distribution prior to the ANOVA. Based on these transformed data, the ANOVA revealed a highly significant benefit for the ISA display (F(1, 26) = 10.25, p < .005,

Interaction effect of slant angle and modality on percent accuracy. Blue solid = Control, Orange Dashed = ISA. The data presented here are untransformed, although the analysis was carried out on the arc sine transformed accuracy measure.
Although there was no significant effect of, or interaction with counterbalancing order, a marginally significant (p = .06) interaction of order with modality revealed that the accuracy in the control condition suffered disproportionately when it was presented in the first block relative both to when it was presented in the second block, and relative to the ISA condition in the first block. That is, performance in the control condition benefited from prior practice with the ISA, whereas performance with the ISA was high whether presented in the first or the second block.
Discussion
This experiment examined the benefits of the ISA display to the spatial judgments that the JTAC observer would be inferred to make in order to formulate a communications message to a pilot, viewing a geographical region from a different frame of reference. In the current paradigm, these judgments would be influenced by two components: (1) distance and angular judgments between ground objects would suffer compression effects if unaided scenes were viewed from low slant angles; and (2) orientation descriptions would suffer from mental rotation costs when the scene was viewed from a non-northerly orientation. Both effects were predicted to be mitigated or eliminated when the ISA was present and used by the participant.
The current data documented both the presence of such effects in the unaided control condition, and either elimination (compression effects: Figure 5) or substantial reduction (mental rotation: Figure 4) of the penalties by the ISA display.
Interestingly, the costs and the ISA mitigation of the two features were expressed differently across speed and accuracy. Mental rotation costs, and its mitigation by the ISA were expressed only in RT, as had been observed by Schreiber et al. (1998). The time costs of mental rotation have been well documented in applied environments (Macedo et al., 1998; Olmos et al., 1997), and in the paradigm similar to that examined here (Schreiber et al., 1998). However, in that study, the cost of mental rotation was only 1 s per 90º, whereas here, they were twice as large (Figure 4), with a slope across the four angles of the control condition of approximately 2 s per 90º—and the ISA eliminated those costs entirely. It is important to note here that an additional 5 s benefit to the ISA was realized even when mental rotation was not required (the two data points at north-facing in Figure 4). The total time savings of over 10 s created by the ISA in a south- or west-facing direction is of great practical importance, in communicating with an aircraft, flying at high speed toward a target.
Conversely, the entire costs of compression were expressed only in accuracy (Figure 5), not RT, as if the compression effect simply reduced the quality of data, to such an extent that accuracy could not be improved with greater time. Norman and Bobrow (1975) describe this as a data-limited effect. Importantly, the compression accuracy effects were quantitatively predicted by the trigonometric model shown in Figure 3. We present this model prediction and the Hickox data again in Figure 6, now accompanied by the two data points for compression in the current study, shown by the green line plotting the % error rate of the control condition (the complement of accuracy shown in Figure 5), and its extrapolation leftward to perfect performance and rightward to “zero” performance, here extrapolating toward 75% error rate at 0 slant angle (chance guessing among four alternatives).
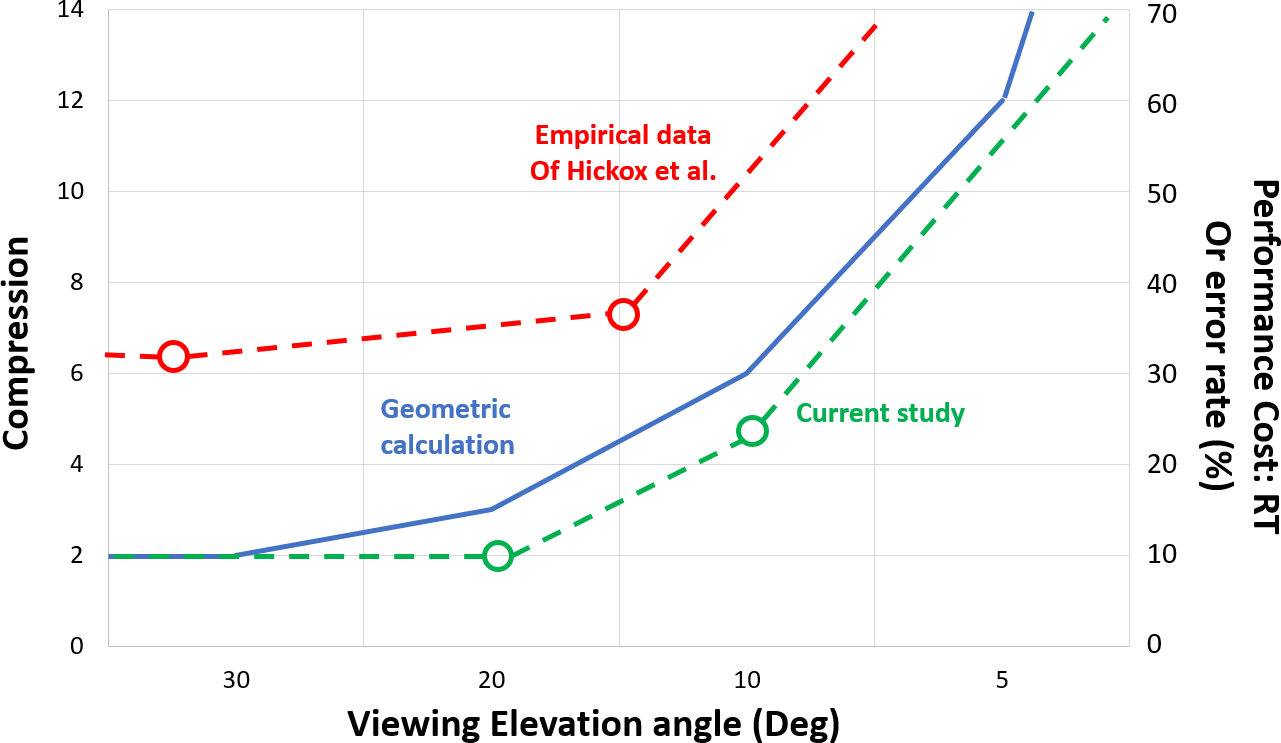
Data from the current experiment now presented within the framework of both the model and the empirical data of Hickox and Wickens (1999).
While the compression costs here were expressed in accuracy, and in Hickox and Wickens (1999) they were expressed in time, in both cases they are general costs to human performance, and the similar shape of the three curves is quite evident, implicating the human perceptual bias in depth judgments. While these biases have been long known in basic perceptual psychology (e.g., Gillam, 1981), it is important here to realize the magnitude to which the compression bias scales up to a simulated real-world task, and the fact that the predictive model of how slant angle biases performance appears to be quite valid.
Implications and Limitations
The practical implications of this research are realized not just in the existence of mental rotation and slant angle effects in this realistic simulation, but in the magnitude of these effects—environments where time savings (mental rotation) and enhanced accuracy (slant angle) are safety critical and can be mitigated by a top-down display. This is important in a variety of environments in which different viewpoints are desirable, such as low-level operations in search and rescue. It is also important that these benefits can be modeled (and thereby predicted), allowing, in some cases, for designers to proceed in advance of human-in-the-loop empirical simulations. From a theoretical standpoint, although phenomena of both mental rotation and perceptual compression have been studied and understood for decades, the relative independence of their biasing operation in a complex task that we found, coupled with the corresponding findings of Schreiber et al. (1998), is an important advancement of knowledge in spatial cognition, as is the fact that both can scale up dramatically in real-world simulations.
One important limitation of the current study is the use of undergraduate students rather than professional marines. This limitation is partly addressed both by the nearly equivalent performance of those with no, and those with some (ROTC) military training. In this context it is also appropriate to note that the current design of the ISA as well as creation of the paradigm and images was guided in part by a retired Marine Corps JTAC, acting as a subject matter expert for the current study.
A second limitation is our use of the image recognition task rather than image description as a proxy for the task that a JTAC would actually perform. This is a legitimate concern, but it is argued that both tasks depend equally on a clear understanding of spatial relations in the target zone, and thus we can extrapolate the ISA benefits as well as the slant angle and mental rotation costs observed here, to predict that both costs would be expressed in a scene description task.
Key Points
Ground controllers in the military must often communicate spatial information about elements in the terrain to pilots, approaching from a different angle and altitude. The resulting spatial transformations that the JTAC must make are time consuming and invite errors.
This study provided a top-down north-oriented map display in augmented reality to assist participants in situation awareness and thereby making judgments of the relative position and distance of objects, mitigating the needs for lateral (mental rotation) and vertical (visual compression) transformations.
The time and accuracy to perceive and understand the relative bearing and distance separation of ground objects were both degraded when the scene was directly viewed from a low altitude above the ground. Both sources of degradations were substantially reduced and sometimes entirely eliminated by the display support.
The costs of low angle viewing were well predicted by a simple trigonometric model of perceptual compression effects.
Footnotes
Acknowledgments
This experiment was supported by a subcontract to Colorado State University from Virtual Reality Rehabilitation, which obtained support from this research from the Office of Naval Research on topic N171-091 “Synthetic Vision System for Ground Forces via Fused Augmented Realities (FAR-UI),” SV4GF contract # N00014-19-C-2026. We would like to thank Albert Armonda and the US Army ROTC cadets at Colorado State University. Peter Squire was the scientific and technical monitor of this work. The authors also acknowledge the contributions of Peter Crane and Dutch Alessi of VRR for advice on the project, of Varum Premkumar as a subject matter expert who contributed to the design of the visualization, and to Sean Mann, who developed the visualization.
Author Biographies
Christopher D. Wickens is a professor emeritus of aviation and psychology at the University of Illinois and is a senior scientist at Alion Science and Technology, Boulder, Colorado, and an adjunct professor of psychology at Colorado State University. He received his PhD in psychology from University of Michigan in 1974, and served 3 years in the U.S. Navy.
Domenick Mifsud is a graduate student in the Department of Computer Science at Colorado State University. He received his bachelor’s degree in computer science from Colorado State University in 2020.
Richi Rodriguez is a graduate student in the Department of Computer Science at Colorado State University. He received his master’s degree in computer science from Florida International University in 2018.
Francisco R. Ortega is an assistant professor at Colorado State University and director of the Natural User Interaction Lab (NUILAB). He earned his PhD in computer science in human-computer interaction and 3D user interfaces from Florida International University (FIU). He also held the positions of post-doc and visiting assistant professor at FIU from February 2015 to July 2018.