
Abstract
Objective
Explore the under-investigated display attribute of head-mounted display (HMD) opacity and its relationship with display clutter and environment clutter in real-world nautical navigation tasks.
Background
Effect of overlay clutter is a prominent factor of HMD research, but there are many factors to displaying information, and the role of opacity has seen little empirical investigation.
Method
Thirty participants performed a realistic nautical navigation task in a virtual environment with obstacles, navigating a small speedboat that rendered navigational information that replicated an HMD interface. The display interface was manipulated by the amount of information present (clutter) and the level of opacity. Environmental obstacles were varied in their number. Participants were evaluated on completion time of the tasks, proximity to obstacles, and mental demand.
Results
Participants performed the task faster when there were more islands, especially in transparent displays. Hazard proximity increased when the environment had more islands and while navigating highly cluttered displays. Increased proximity to hazards occurred only when the display was opaque and highly cluttered. Mental demand followed the same pattern as completion time.
Conclusion
The study revealed preliminary findings that high-cluttered environments should be navigated with more transparent displays and less display clutter.
Application
The data from the study highlights the relationship between display opacity, display clutter, and environmental clutter. This provides a foundation upon which more work can ask more complex questions about these relationships and how they can impact navigational efficiency.
Introduction
Head-mounted displays (HMDs) are increasingly proposed as a solution designed to reduce costly visual scanning in transportation systems such as cars (Blissing et al., 2022; Morrison et al., 2009), planes (Dey et al., 2018; Haworth & Seery, 1992; Jeffri & Rambli, 2021; Newton, 2022; Patterson et al., 2006; Wickens Ververs & Fadden, 2004; Winterbottom et al., 2005), and boats (Hertel et al., 2023; Van den Oever et al., 2024). The advantages of HMD platforms are obvious and intuitive. Operators can maintain “eyes out” on the scene in front, so as to avoid hazards and obstacles, while still processing and monitoring critical display information related to navigation and vehicle operations, as well as communication displays, notifications, and chat boxes, with reduced visual scanning between the display and the world beyond. The non-HMD alternative, such as a tablet or head-down instrument panel imposes frequent scanning of the vehicles’ instruments to perform relevant tasks, while taking visual attention away from monitoring for hazards in the path of travel. Such scanning will increase fatigue and leave the operator vulnerable to missing important items in the forward scene when the eyes are “head down” (Wickens, 2015).
The clear empirical performance advantage of superimposed imagery, such as the HMD has been shown in extensive research on vehicle-mounted HUDs (Fadden et al., 2000) and HMDs (Warden et al., 2023a), and it also lowers the mental workload of processing information by moving visual information closer to the driver’s field of view (FOV) (Smith et al., 2015). In this experiment, we examine the joint effects of clutter, either displayed items on the HMD (display clutter), or a scene filled with many objects viewed through and beyond the HMD interface (scene clutter), and display transparency, the ability to see through scene or environment items through the HMD interface information, in a realistic nautical navigational task.
Despite the advantages, there is one major cost to positioning information superimposed on the forward field of view, whether in an HUD or an HMD, and this is referred to as overlay clutter (Alexander et al., 2012; Pankok & Kaber, 2018; Warden et al., 2025). This negative effect (increased response time, decreased accuracy, and others) may be caused by elements either on the display (display clutter) or in the scene beyond (scene clutter), disrupting perception of elements in the other domain (scene or display, respectively). In aviation, it has been found that the overlay clutter of HUDs for landing guidance can disrupt the detection of small visual-angle hazards, such as runway incursions (Fadden et al., 2001; Fischer et al., 1980).
Importantly, clutter can be computationally computed (Rosenholtz et al., 2007; Warden et al., 2024, 2025; Yeh & Wickens, 2001). From basic visual attention science is derived the feature congestion model of clutter (Rosenholtz et al., 2007). This model in turn is derived from Treisman’s Feature Integration Theory (Treisman & Gelade, 1980), which describes the characteristics of individual items and a target search field that impose a slower serial search inspection of all items in a search field to assess target identity. Hence, the model will penalize scenes that contain items with multiple heterogeneous feature dimensions in close spatial proximity. Feature congestion is readily applied across naturalistic search scenes. A second, computationally simpler clutter metric that can be applied to synthetic displays and to less complex scenes is the object-count model and metric (Warden et al., 2024, 2025; Yeh & Wickens, 2001). This is based upon Sternberg’s serial self-terminating visual search model and its subsequent incorporation into Wolfe’s (2021) Guided search model. Here, visual search time is penalized by a fixed amount for each additional nontarget element that appears in the search field, whether a display item or a discrete object in the scene beyond.
Relatively few studies appear to have examined both scene clutter and display clutter, and both have been shown to have a roughly linear degrading effect on performance as clutter increases (Warden et al., 2024, 2025). None appears to have examined both sources of clutter in conjunction with display transparency. In applications, the importance of quantifying HUD or HMD clutter is to provide design guidance that constrains the amount or type of display information presented while the vehicle is in motion.
One design strategy to mitigate the impact of clutter is to vary the transparency of the HMD display. Display transparency or, its converse, opacity (Hussain & Park, 2024; Winterbottom et al., 2005; Wong et al., 2005) aims to achieve a balance between the clarity or legibility of information presented on the display and the visibility of real-world scenes viewed through the HMD. Increasing display transparency should mitigate search of the scene to the extent that the increment in transparency will (a) eliminate the possibility of total occlusion of critical items in the scene and (b) create an added preattentive feature (intensity) that can discriminate the two overlaid domains (scene, display), and hence ease the search of each (Wickens, Alexander, et al., 2004). However, increasing symbology transparency can reduce its legibility in a manner predicted by basic visual contrast functions (Lee et al., 2017), which will disrupt not only the visual search of the display, but also any display-related task that requires perceptual interpretation, such as reading text or visual symbols.
Logically, if the display interface is entirely opaque (unable to be seen through), perception of far domain information is impossible, and performance on a task requiring scene information, such as hazard detection and avoidance, will be null. If only the imagery on the display is opaque, then these displays superimpose themselves on the far domain and create “walls” of occlusion that inhibit the ability to see the scene behind them without head movement, and the area of such walls will be directly proportional to the amount of display clutter. If the display interface has high, but not perfect transparency, performance based on scene information will be high, and only degraded to the extent that there is significant display clutter. However, performance on display-related tasks, such as map consultation, will be degraded to the extent that scene clutter is high (Warden et al., 2024). Furthermore, as the display information is less opaque (more transparent) and scene clutter is high, display legibility and readability deteriorate.
Variations in the opacity or transparency of the HMD interface have been investigated very little. To our knowledge, only a few previous studies have explored altering the transparency of virtual interfaces to enhance user visibility. Jing et al. (Jing et al., 2024) investigated HMD interface opacity in the context of subway maintenance tasks, suggesting that increased transparency might pose safety risks by complicating worker navigation. Hussain and Park (2024), using a visual search task, concluded that transparency levels between 50% and 75% were optimal. Wong et al. (2005) investigated how transparency affects multilayered displays in command and control scenarios, finding that while increasing transparency initially lengthened reading times, a transparency level of 70% restored performance to parity with fully opaque displays. However, their sample size (N = 6) was extremely small. These outcomes suggest a complex, nonlinear relationship between transparency and readability, cautioning that the improper application of transparency can hinder perception, amplify distractions, and compromise legibility. Winterbottom et al. (2005) review some issues of HMD transparency in aviation, but most of their focus is on monocular HMDs. None of these studies addressed varying levels of HMD clutter and how these might trade off against transparency, nor did they incorporate real-world navigation scenarios. The potential interactions between opacity and clutter in their effects on attention-mediated task performance are of both theoretical and practical significance.
In conclusion, the detrimental effects of overlay clutter are well known, but they can be mitigated by reducing clutter and adjusting opacity (transparency) to some optimal level. However, prior research has not examined the tradeoff between these two variables in realistic navigation tasks, particularly within the nautical domain. In the current experiment, we do this within a VR paradigm in which participants navigate a small speedboat through a littoral environment populated by small islands and floating hazards of varied density (environmental scene clutter), while necessary navigational information is presented on a simulated HMD in a minimap, whose display clutter and opacity levels are manipulated as experimental variables.
We hypothesize that: (1) Navigational efficiency will be: (1a) decreased by increases in environmental clutter (longer transit time), because of the increased complexity of the environment. (1b) increased by an increase in display opacity, which will render the minimap, useful for route planning, more legible. (1c) decreased by display clutter as more elements on the display may retard the visual access of the elements relevant to efficient navigation, particularly the minimap and time clock (2) Hazard collisions or near collisions, compromising safety, will be: (2a) increased by environmental clutter, as there are more opportunities for penetration of safety-boundaries around islands and floating objects as islands become more frequent. (2b) increased by increasing display clutter, as all environmental objects will be more obscured by semi-transparent elements on the display (2c) increased by increasing display opacity (decreasing transparency) as all items in the scene (hazards) will be more obscured.
In hypothesizing these main effects, in a 2 × 2 × 2 factorial design, we anticipate that some interactions between variables may also be observed, but we are not sufficiently confident to predict the direction of these interactions in advance: for example, whether transparency will amplify or diminish the detrimental effects of either type of clutter.
Method
Participants
Priori power analysis in G*Power 3.1 (Faul et al., 2009) indicated that 28 participants would be required to achieve 80% power to detect a medium effect size (f = 0.25) in a repeated-measures ANOVA. Therefore, we recruited a total of 30 volunteers (17 male, 12 female, and 1 nonbinary; mean age: 24.3 years; age range: 18–38 years) from the Colorado State University community. All participants had normal or corrected-to-normal vision, no history of vestibular or neurological disorders, and minimal prior motion-sickness susceptibility. Twenty participants received a $20 Amazon gift card; the remainder participated without compensation. The Colorado State University Institutional Review Board approved all procedures, and written informed consent was acquired following the Declaration of Helsinki.
Virtual environment and task
Participants were required to complete navigation tasks in a virtual environment. The primary objective was to guide the boat from a starting point to an end point (buoy) while navigating around obstacles, including wooden barrels, logs, and islands, in a virtual environment. Participants were instructed to minimize obstacle collisions and complete the task as quickly as possible. Participants operated a minimalist boat that moved only forward at three distinct speeds (500, 650, and 750 units/s), with yaw steering controlled via a joystick. Participants binocularly observed the virtual scene with a 120° field of view. They could freely rotate their heads while maintaining a stable environment and interface during navigation.
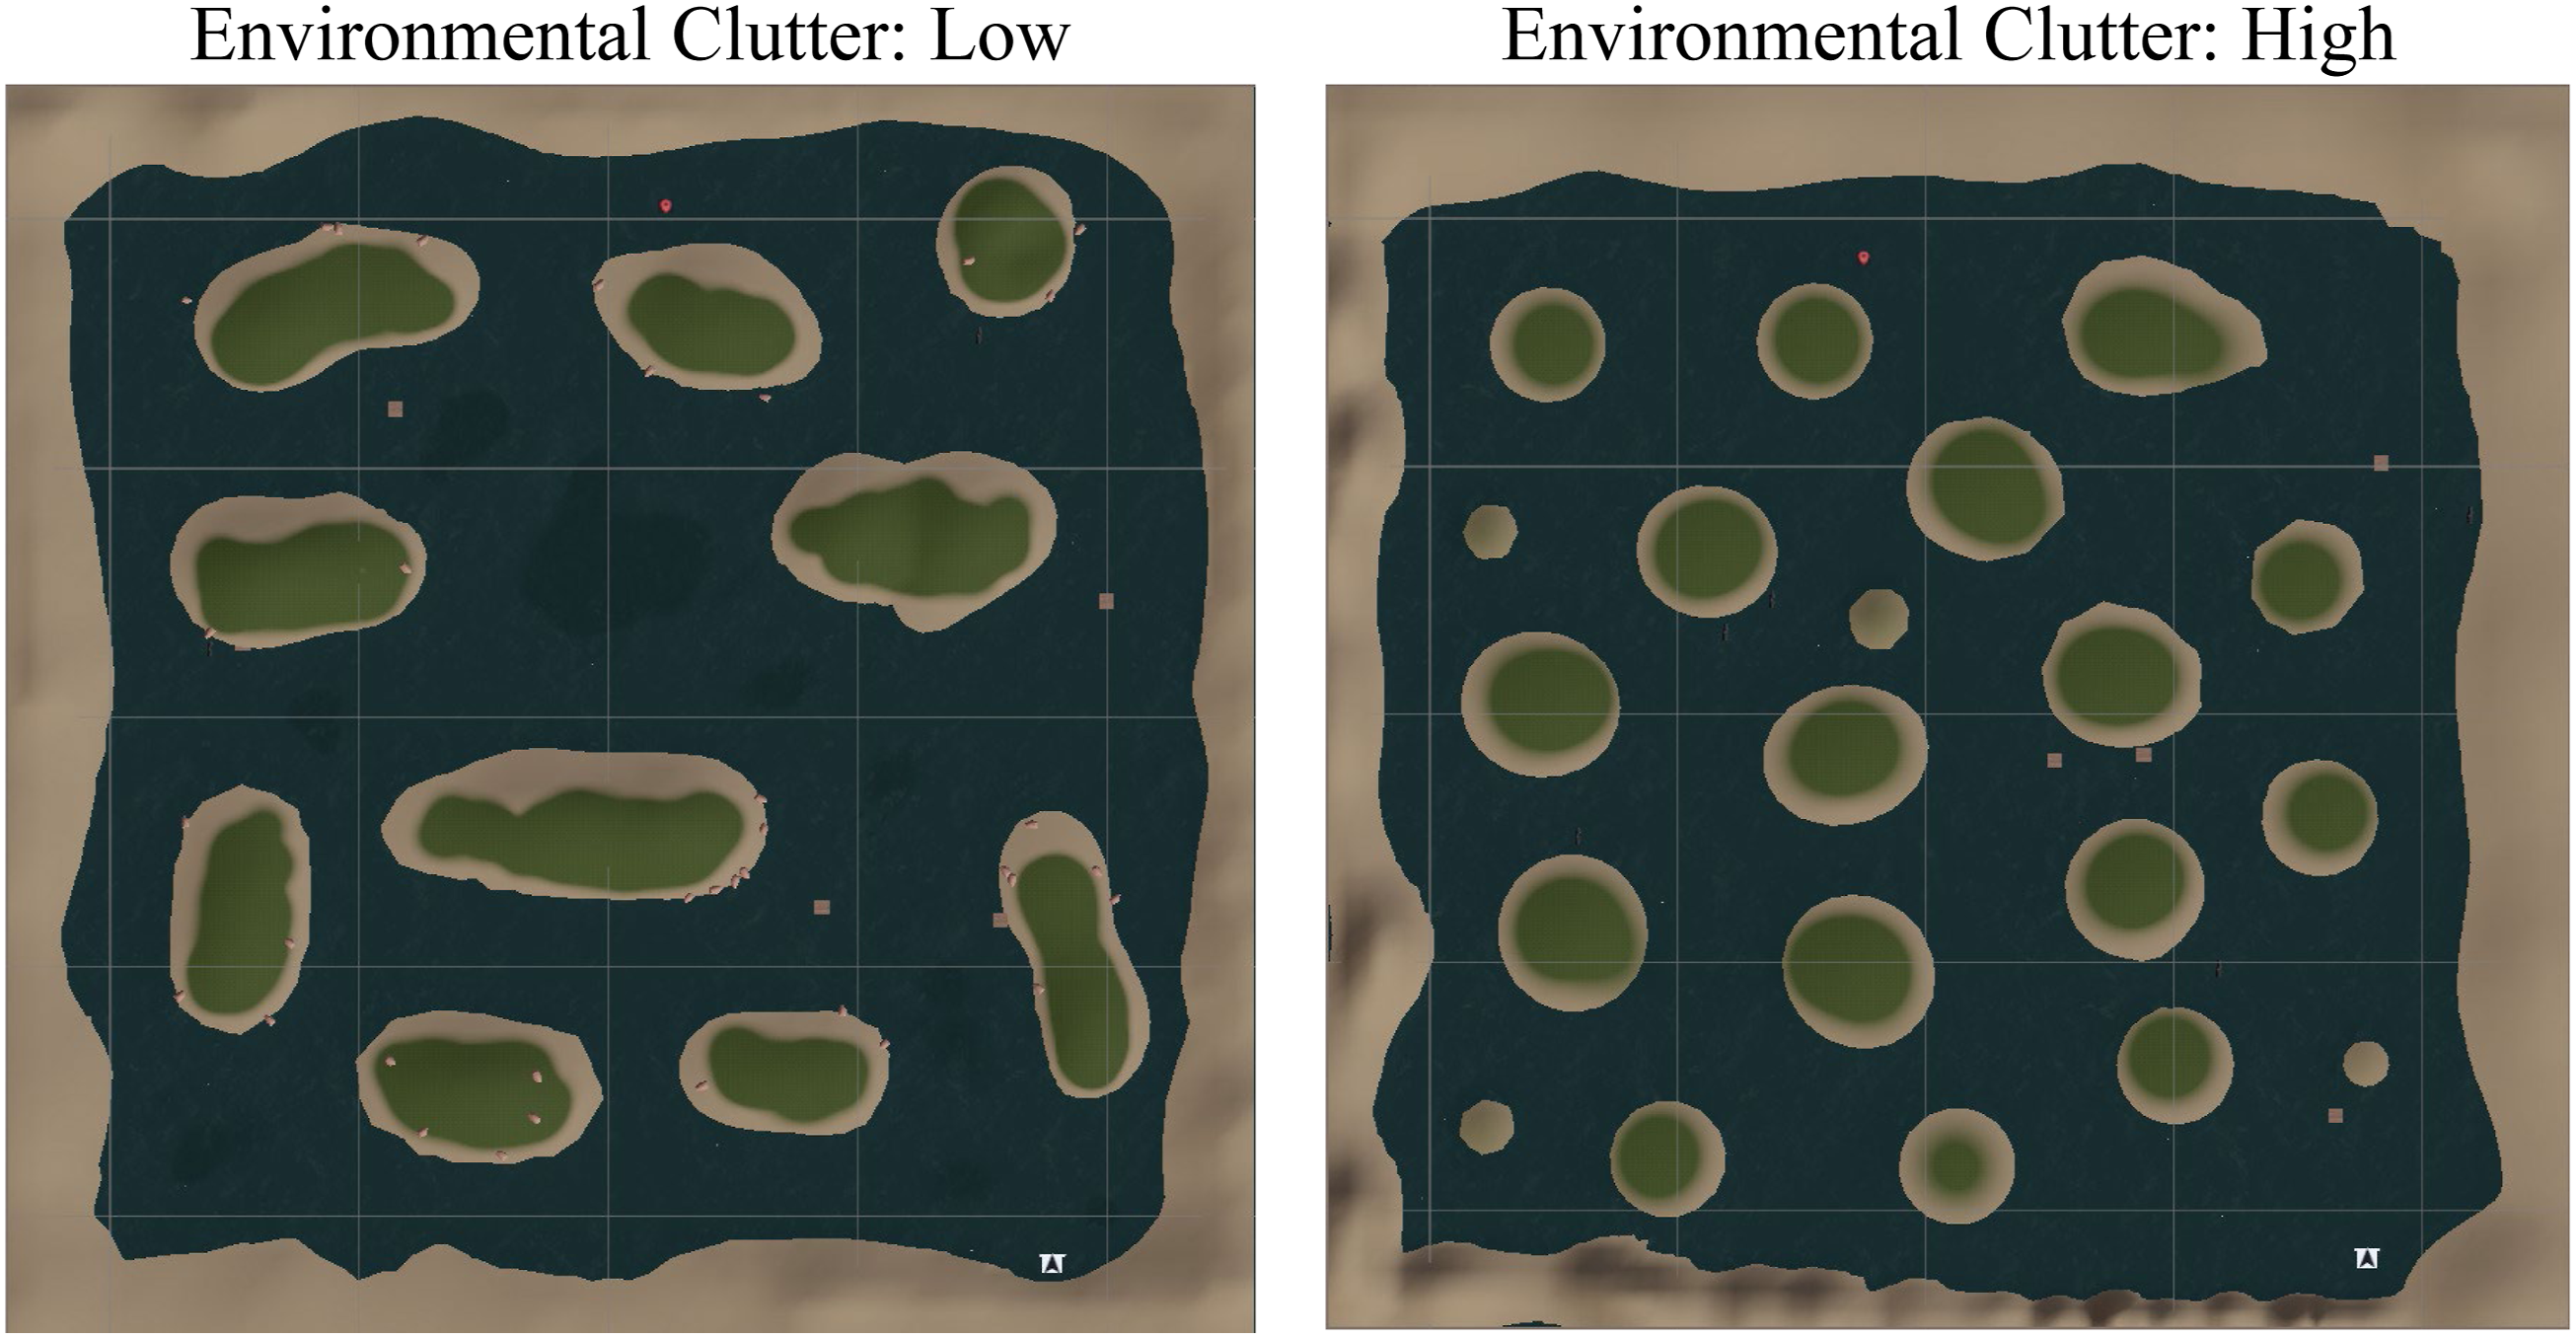
The virtual navigational environment covered a 500 × 500 unit grid, represented realistic navigation scenarios, incorporating natural terrain. Islands possess sandy shores, grassy zones, trees, and rocks, creating an organic coastal landscape (see Figure 1(a)). Two island-density setups were used: ten and twenty islands (see Figure 2). Islands were placed pseudo-randomly on a grid, such that their location was unpredictable from one run to the next, keeping a 20 m minimum distance. In the ten-island condition (low environmental clutter), irregular landforms created narrow channels and elongated paths, while the twenty-island condition (high environmental clutter) comprised smaller, circular islands in a maze-like pattern, needing frequent directional choices (see Figure 2). Contact with the buoy prompted a scene switch, indicating task completion (see Figure 1(b)). (a) Island terrain and environmental texturing; (b) endpoint buoy object. Top-down schematic of the virtual maritime environment. (a) Low environmental clutter condition with 10 islands. (b) High environmental clutter condition with 20 islands.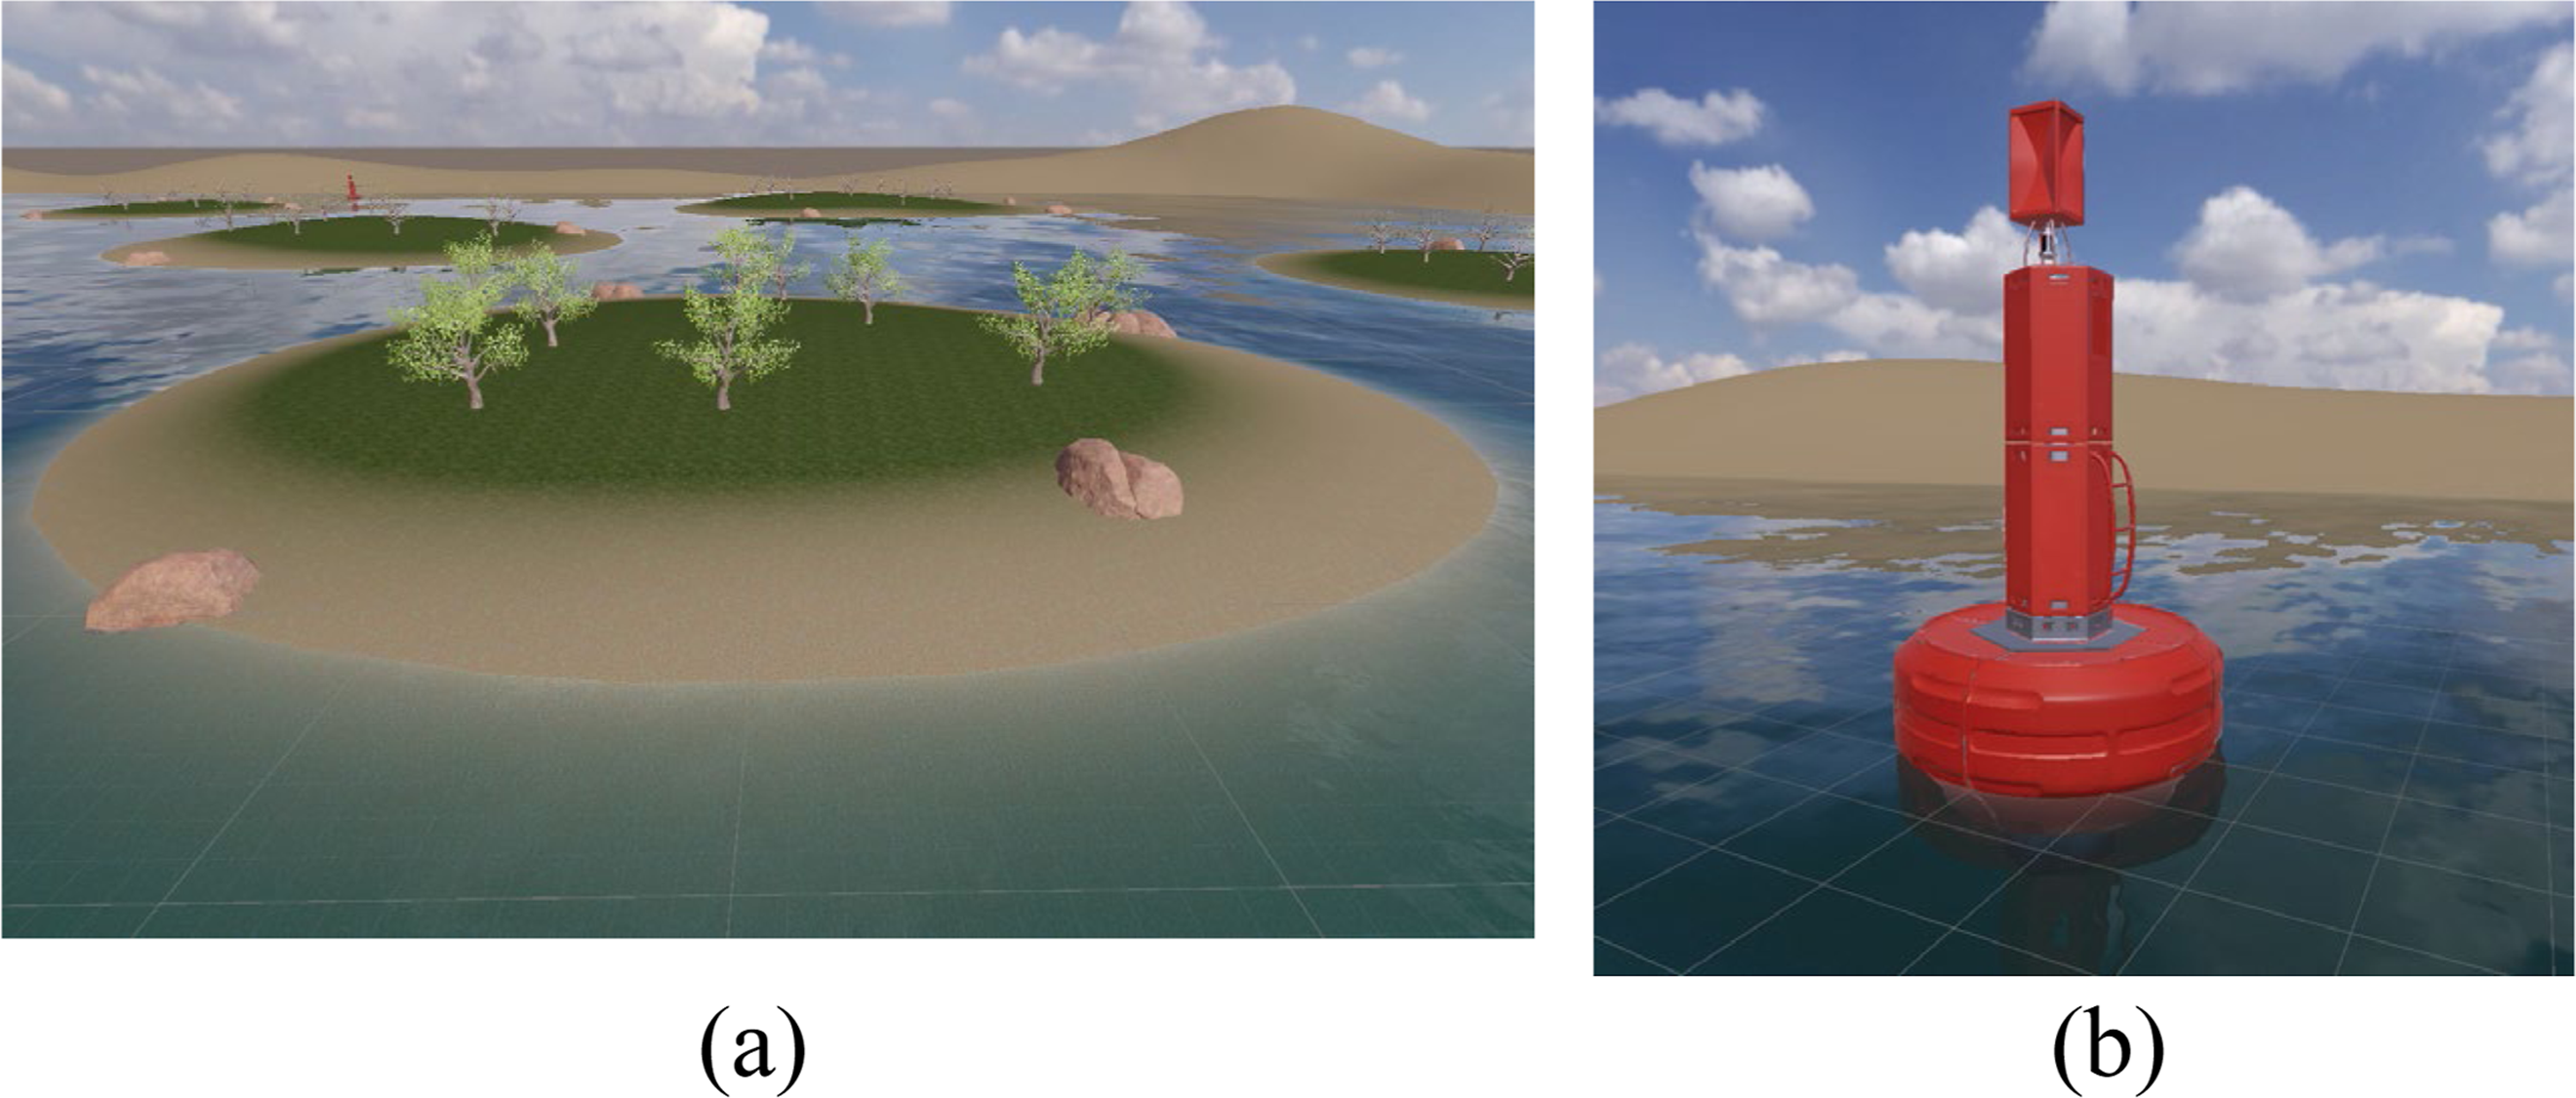
In each scenario, 80 floating obstacles from the 11 obstacle types were dispersed pseudo-randomly throughout the virtual environment. The 11 floating obstacle types, including naval mines, wooden boxes, planks, and logs (see Figure 3). These obstacles were visually distinct on the water surface, allowing them to drift gently. Types of floating obstacle objects.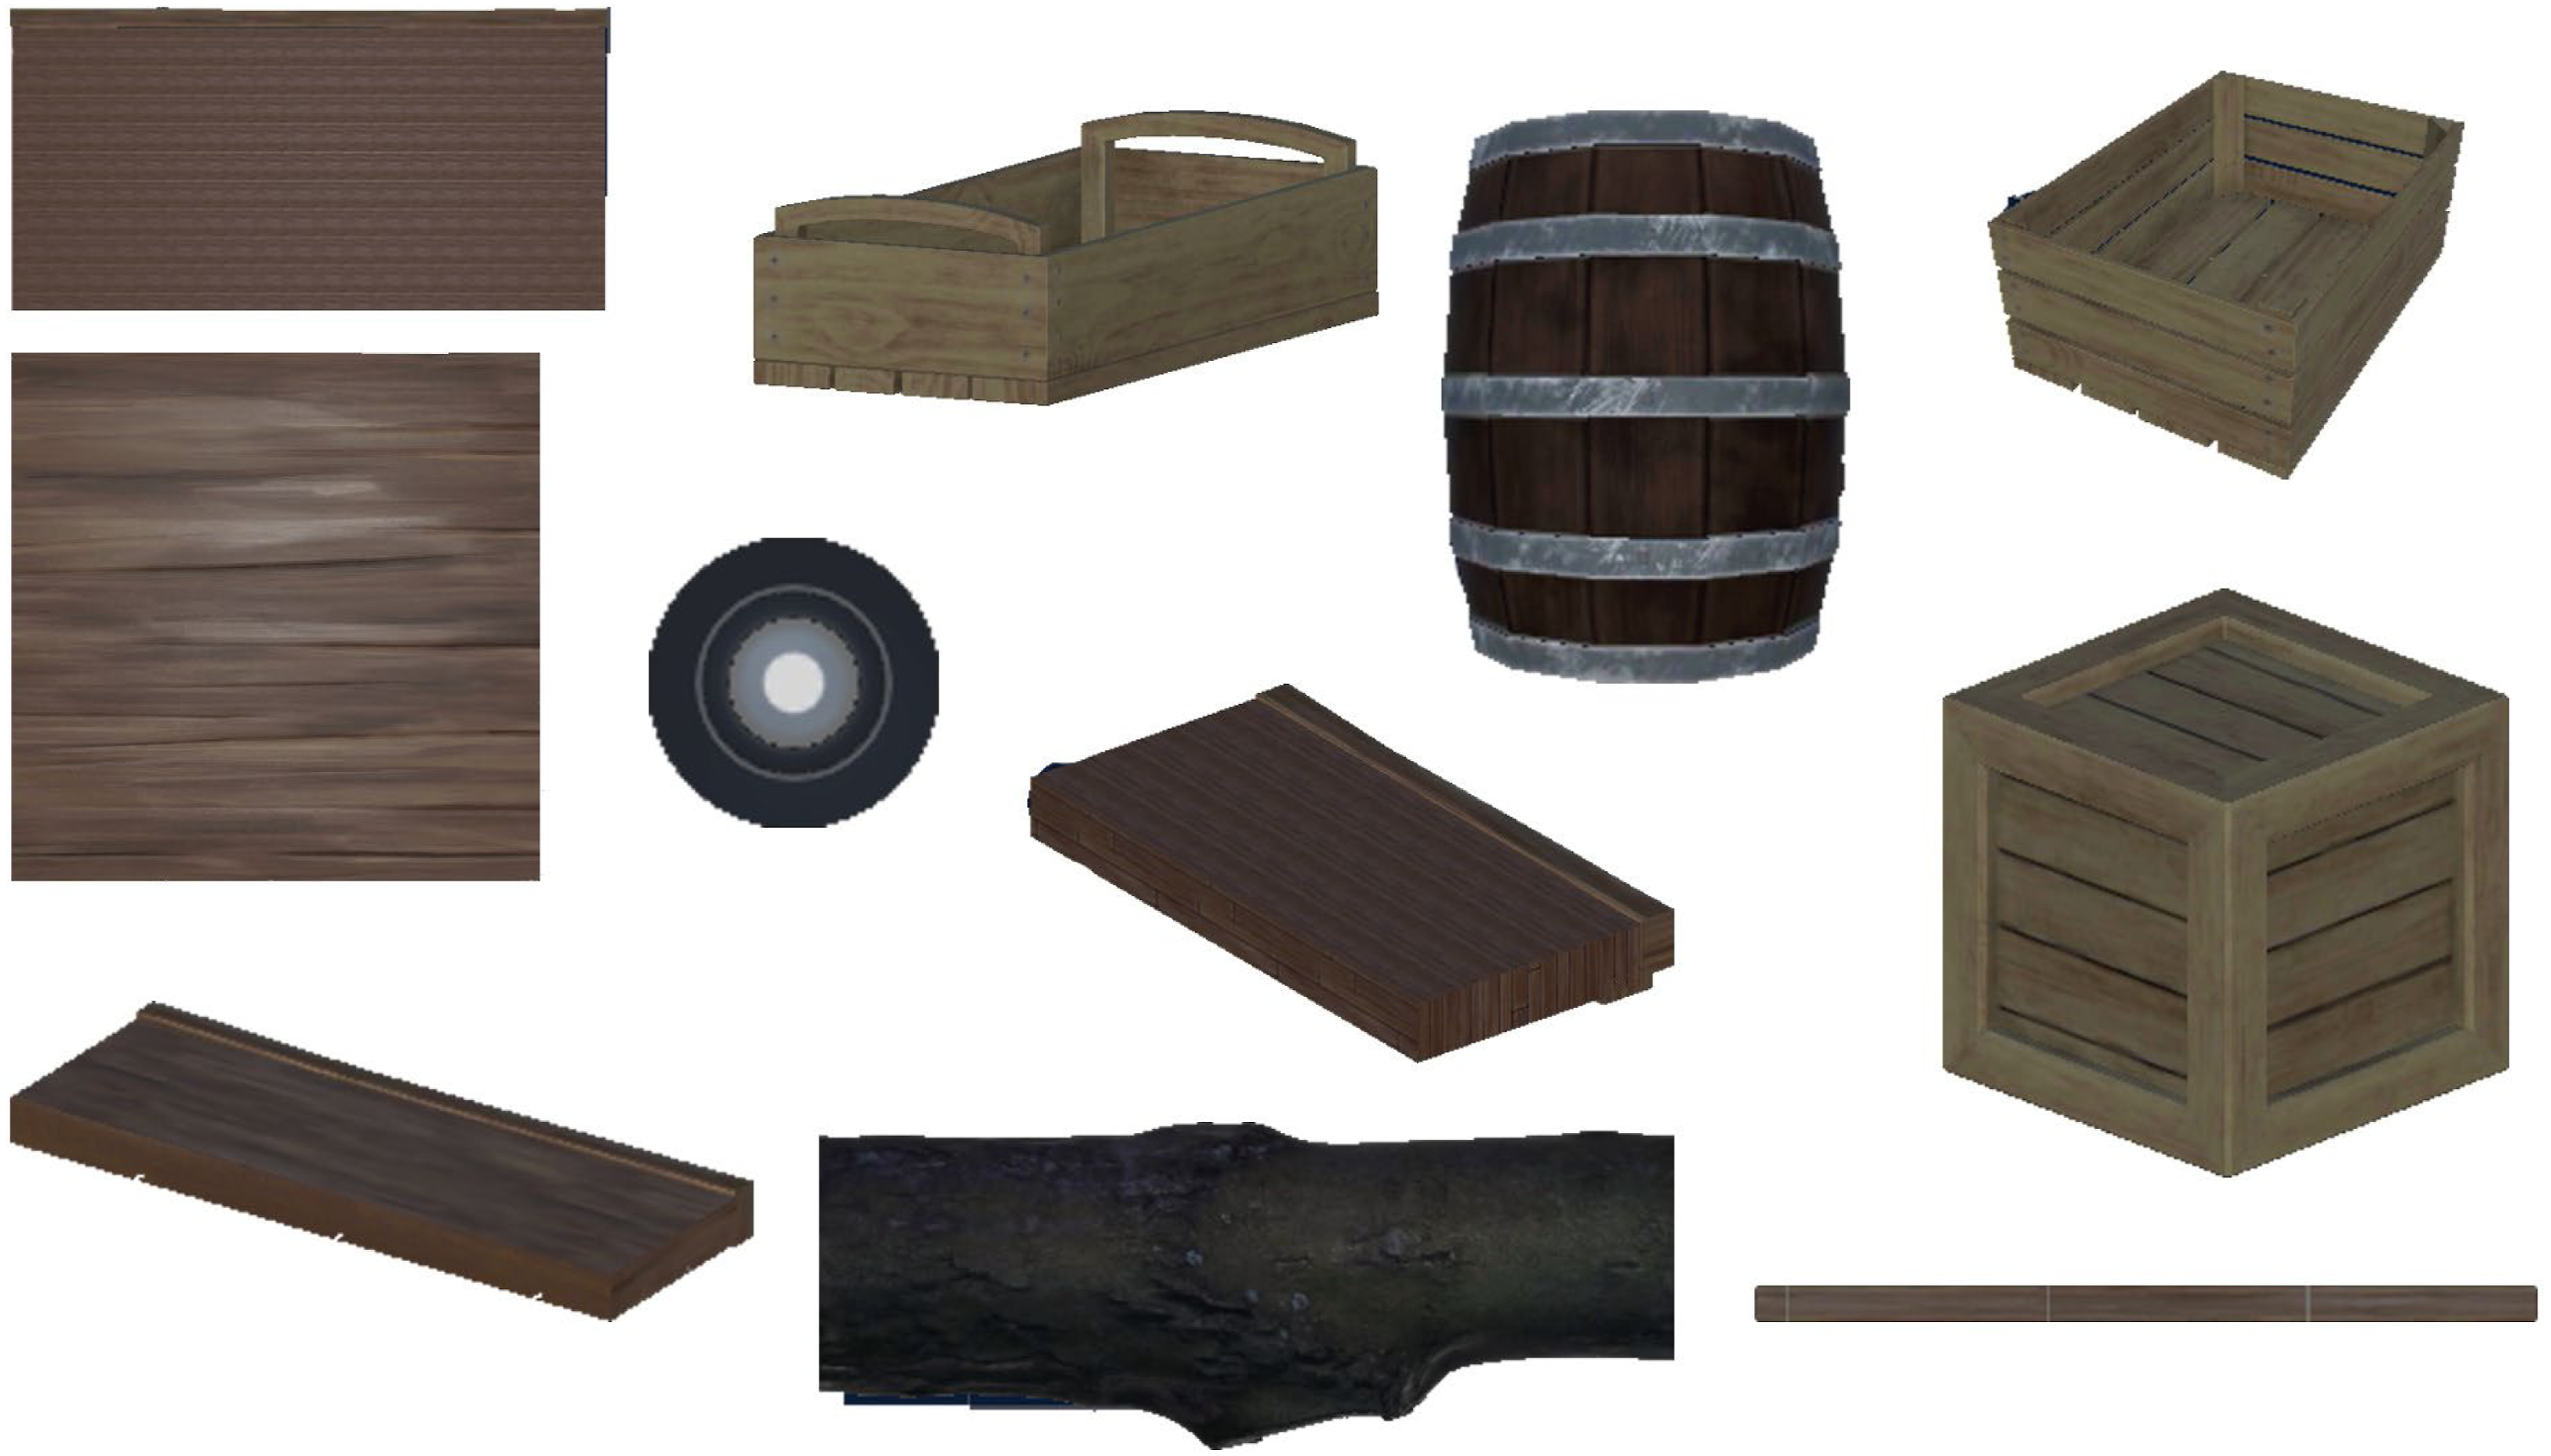
Head-mounted display interface information
The HMD featured fundamental navigational details via a minimalist interface that maintained forward visibility. It displayed eight components: a minimap showing the vessel, endpoint buoy, and nearby terrain (but not floating objects); a speedometer (m/s); a distance-to-target gauge (m); a compass; a static weather icon; a battery level indicator; a voice-call icon; and a naval codename (e.g., “Alpha”) (see Figure 4). In the low display clutter condition, there were four relevant objects on the display: the minimap, speedometer, distance-to-target gauge, and compass were task-relevant. All of those objects could legitimately be used by participants to navigate. In the high display clutter condition, shown in the bottom row of Figure 4, four additional items were included that were not relevant to the participants’ task. The entire interface for low and high display clutter used less than 45% of the display area, where the minimap covered approximately 26%. Therefore, the environmental clutter impacted each of the interface elements, rather than any specific items. Moreover, the minimap was a zoomed-in version that translated and rotated with the boat to show a small section of the map around the user as they traveled. Display clutter and transparency conditions.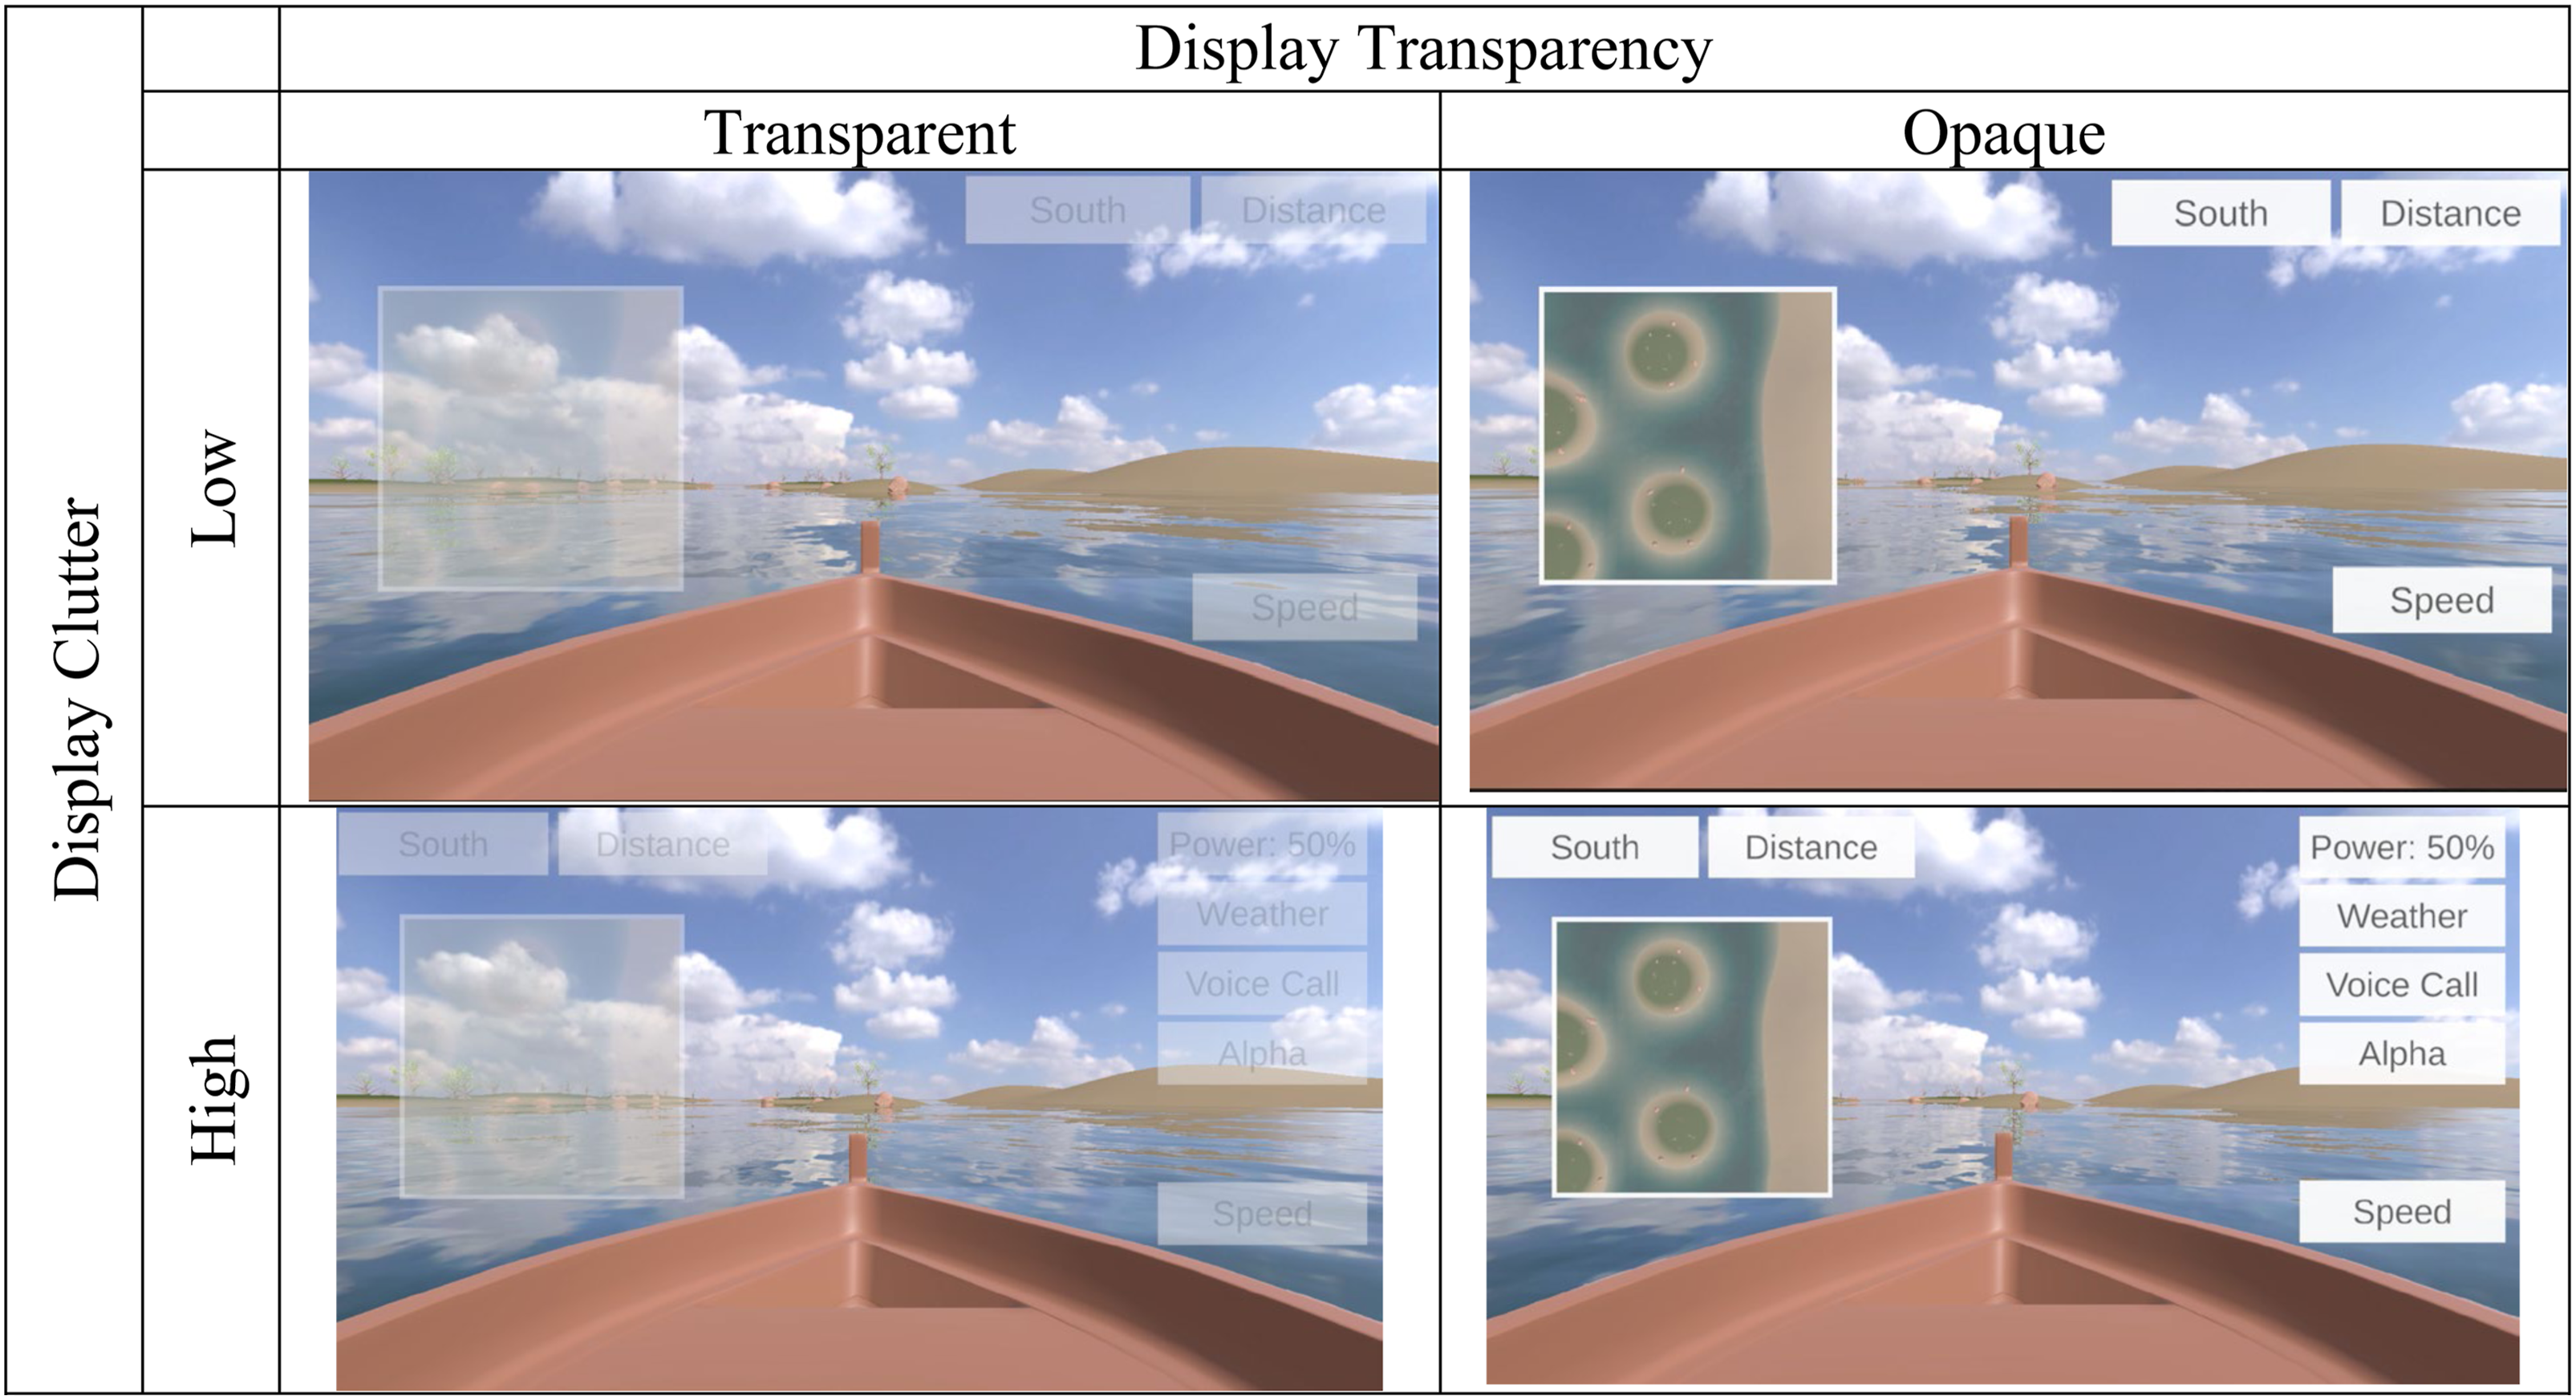
Independent variables
Environmental clutter
Environmental clutter was defined by the number of islands in a virtual environment surrounded by a water body. We assumed that the floating objects, being small and not salient, would not act as clutter to the detriment of processing the displayed information, and hence their number was kept constant across both levels of environmental clutter. The low- and high-clutter conditions included 10 and 20 islands, respectively (see Figure 2).
Display clutter
Display clutter was referred to the number of display interface elements. As described above, the low-clutter condition included four functional, task-relevant navigational indicators: speed, distance to target, mini map, and compass heading (Pankok & Kaber, 2018). The high-clutter condition added four additional, nonfunctional, task-irrelevant items (Sweller, 1994).
Display opacity (transparent, opaque)
Display opacity was manipulated via the alpha channel of the display shader in the Unity program. Display opacity has two levels: transparent, when the virtual interface element has an opacity of 0.5, and opaque, when the virtual interface element has an opacity of 1.0.
Dependent measures
Navigational performance was assessed using two primary dependent variables: completion time and proximity to hazards. Completion time (in seconds) was measured from trial onset (start-cue scene) to the endpoint buoy contact. We continuously assessed the proximity of the boat to objects or islands to detect both collisions and incidents classified as “unsafe close penetrations” within 8 m beyond the boundaries of these islands and obstacles (proximity to hazards). These values were recorded and saved by the Unity program for each trial that the participants performed.
Design and procedure
This study employed a fully within-subjects factorial design, with participants completing navigation tasks under all combinations of three independent variables (environmental clutter, display clutter, and transparency). Each of the eight conditions was presented twice, for a total of 16 trials per participant. The trial order was block-randomized to avoid consecutive repetition, and start/end locations varied to prevent route memorization. Before data collection, participants completed an informed consent form, a demographic questionnaire, and a baseline NASA-TLX assessment. Headset IPD was adjusted nearly to the measured interpupillary distance (IPD) with a pupilometer, ensuring maximum comfort. Participants were informed they could pause or request assistance at any time. Participants navigated while seated in a controlled lab setting with stable lighting and minimal distractions.
The training phase introduced HMD, controls, and collision/reset mechanics. In an environment with one hazard element (e.g., a house) and a target buoy in sand, participants practiced steering, speed modulation, and collision response. Advancement to reach the experimental trials required three successful completions and one intentional collision. After the training phase, participants performed the experimental trials. Participants were instructed to navigate to the buoy as rapidly and directly as possible, while still avoiding collision with any of the islands or floating hazards. The location of the buoy was randomly placed in such a way that the distance from the start position to the buoy was 450 m in each trial. The buoy could not be seen from the initial position. It could only be seen when the boat was 100 m away from the buoy in the minimap, as well as in the forward FOV when no obstacles were present.
After each trial, participants verbally completed the NASA-TLX survey. One-minute rests followed each trial, with a 10-min break at the midpoint. After all experimental trials were concluded, participants engaged in a brief debriefing session during which they reported any discomfort, nausea, or other adverse effects. Finally, participants received gratitude and appropriate compensation. The entire experiment lasted approximately 1 h and 15 min.
Technical specifications
Participants used an HTC VIVE Focus 3 standalone head-mounted display (HMD), which featured dual 2.88-inch LCD panels (2448 × 2448 pixels per eye, 90 Hz, 120° field of view). Steering was achieved with the right-hand controller joystick, acceleration with the trigger, and deceleration with the thumb grip. Virtual environments were entirely developed in Unity 3D (version 2022.3.35f1 LTS) within the HMD. A custom C# script recorded each participant’s task completion time and proximity data, saving the data to .csv files stored locally on the headset.
Results
Analysis
Repeated-measures ANOVAs analyses were conducted to evaluate the effects of our experimental variables. All analysis was performed in R using ANOVA as well as Bonferroni tests. ANOVA analysis was done using the ez package, while the Bonferroni tests were done using the Desc-Tools package. For effect size, we report the partial generalized eta squared (
Efficiency (completion time)
Completion time was measured in seconds, representing the time it took the participant to travel from the starting location to the target buoy at the other side of the navigation space. This data was processed by calculating the mean for each participant across the two repetitions; subsequently, the means were log-transformed.
The analysis of mean completion time depicted in Figure 5 showed that the time was significantly shorter with high environmental clutter (F (1, 29) = 17.20, p < .001, Mean of completion time. These values are then split between opacity: transparent and opaque. Additionally, Display clutter can be visualized with high display clutter represented by green and low display clutter represented by orange. Lastly, the x-axis shows the low and high environmental clutter. Error bars represent one standard error of the mean.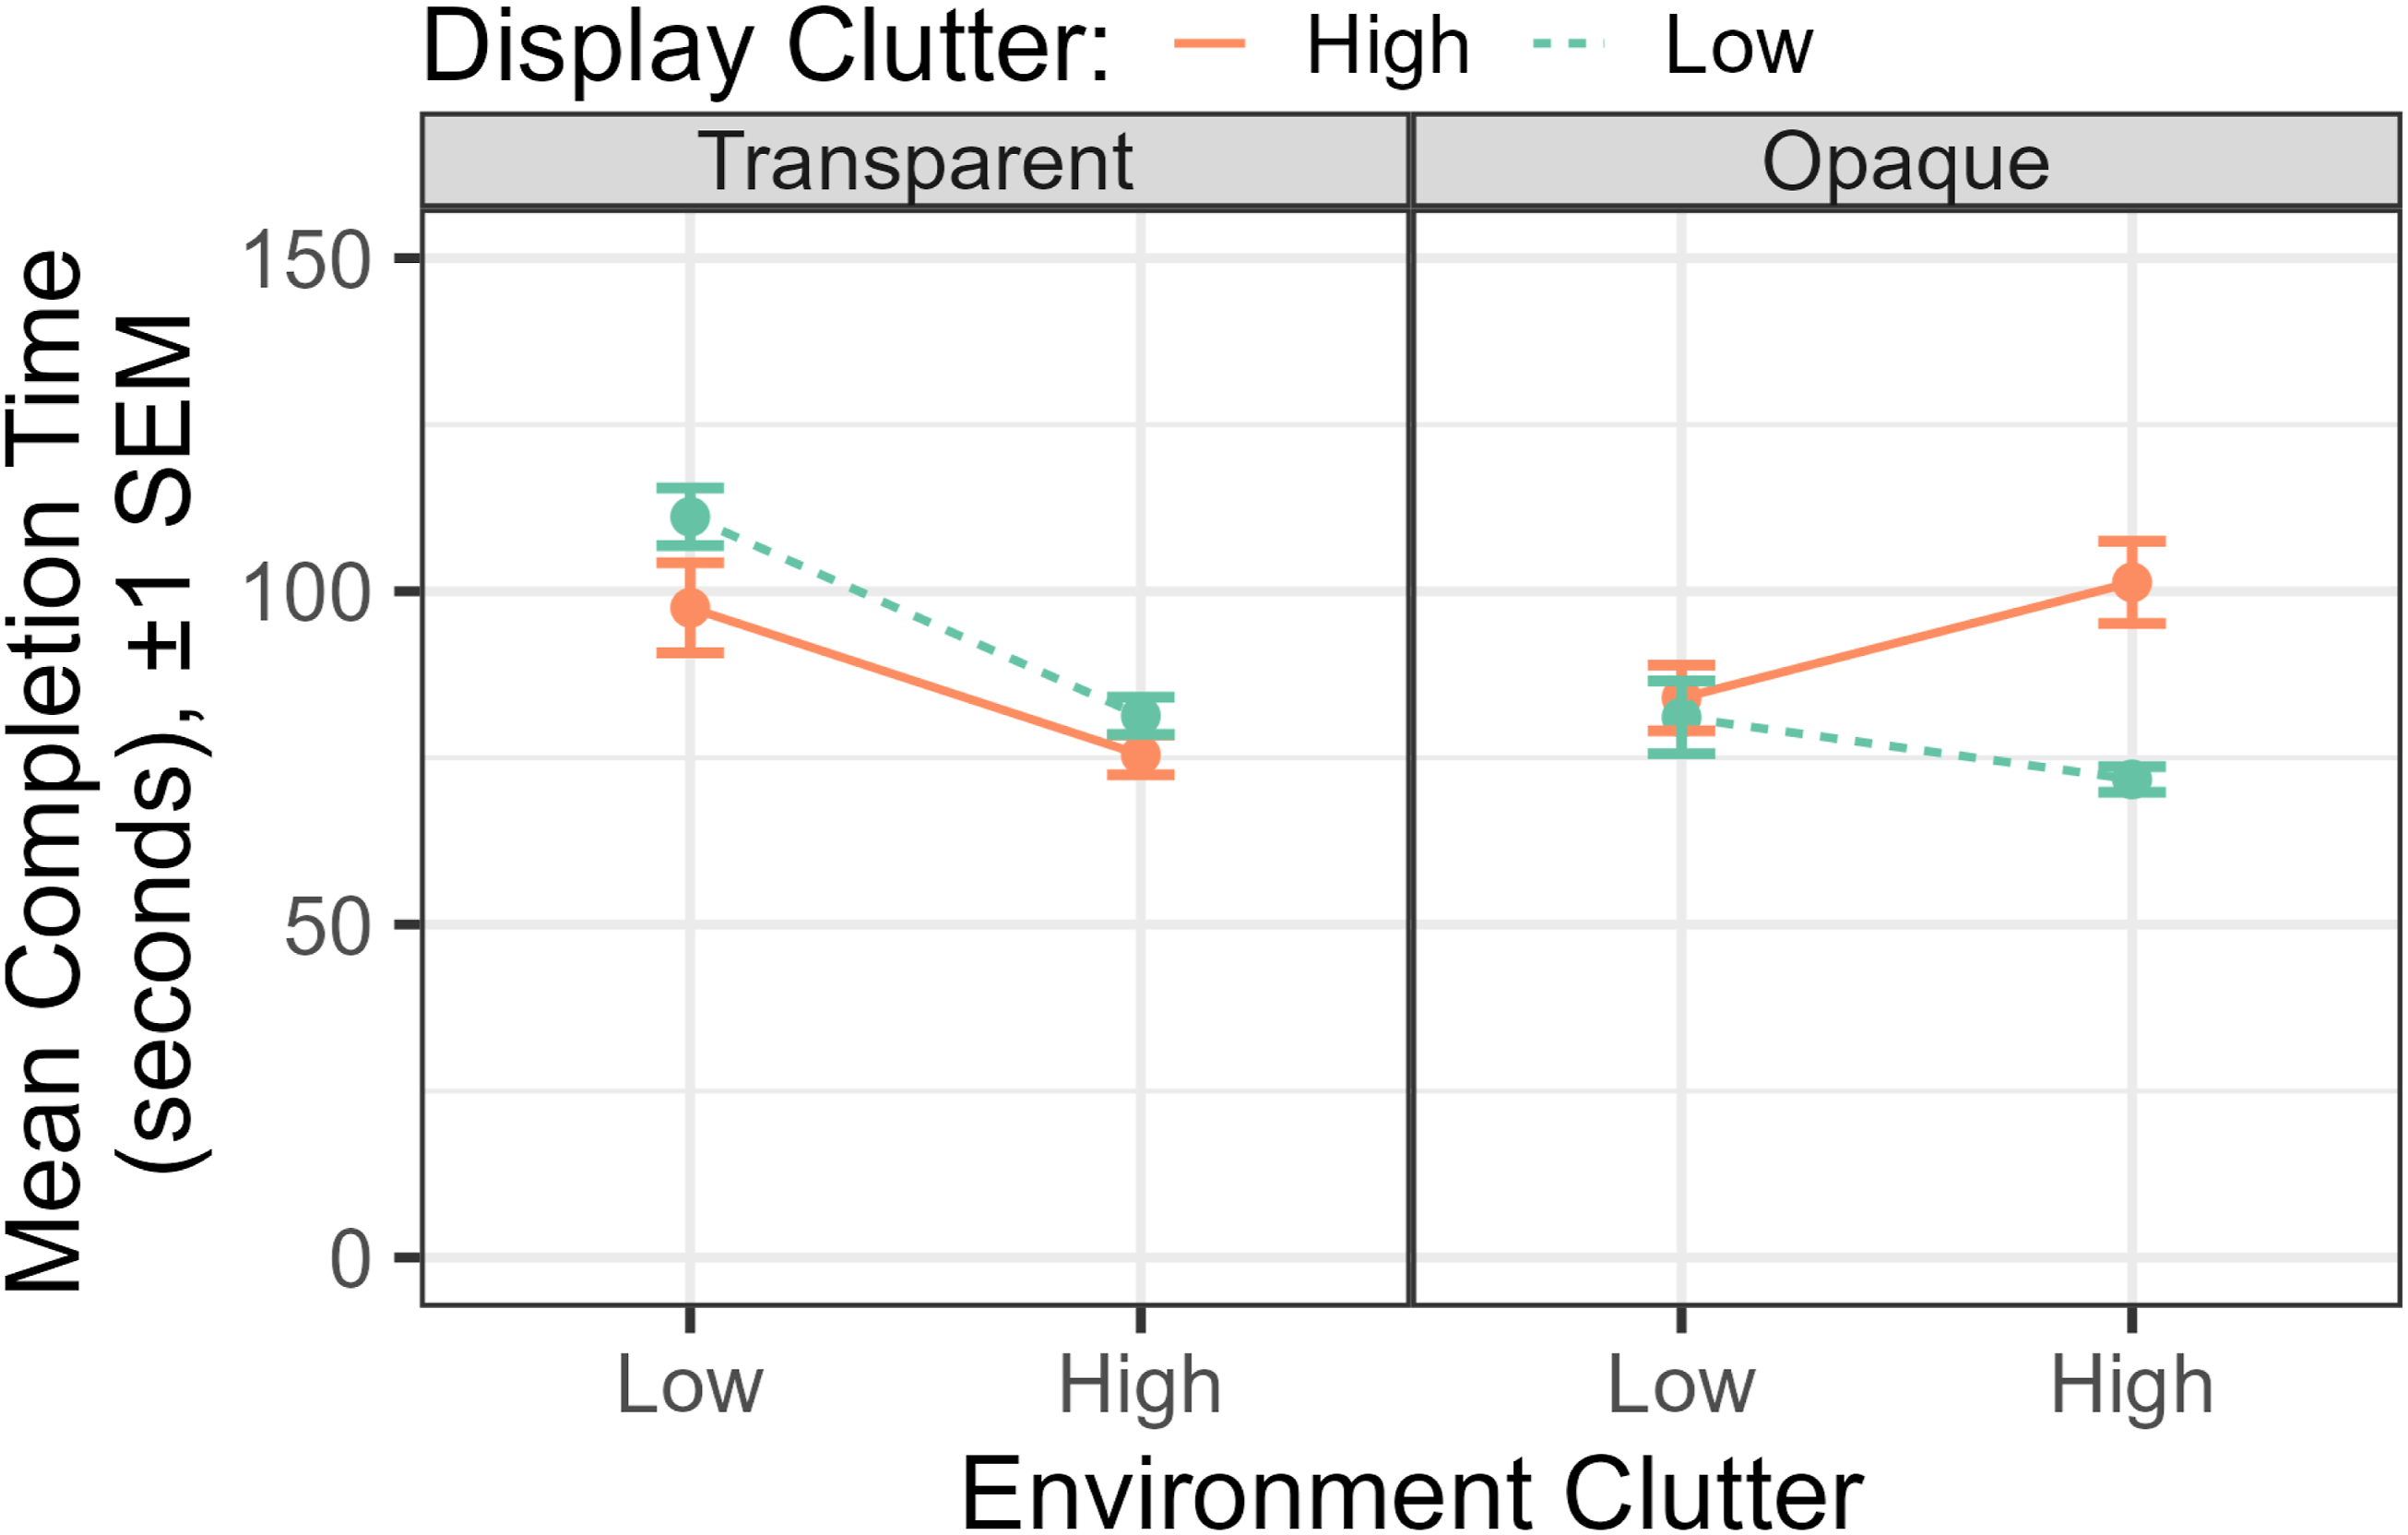
While display clutter did not affect completion time (F (1, 29) = 0.64, p = 0.43), the significant interaction between display clutter and transparency showed that high display clutter slowed completion time when the display was opaque (right panel), but not when the display was transparent (left panel; F (1, 29) = 39.37, p < .001,
Safety (proximity entry)
Proximity entry, violating safety constraints, was calculated whenever the boat crossed an 8-m limit surrounding either islands or floating hazards. These were counted for each trial. There were very few actual collisions with islands, so safety was defined only by the penetration of the safety zone around the islands.
Figure 6 presents the findings for unsafe proximity entry. ANOVA on the log-transformed data revealed that, as with completion time, high environmental clutter led to more proximity entries (F (1, 29) = 208.70, p < .001, Mean of proximity entry. These values are then plotted according to the opacity level, environment clutter, and display clutter. Error bars represent one standard error of the mean.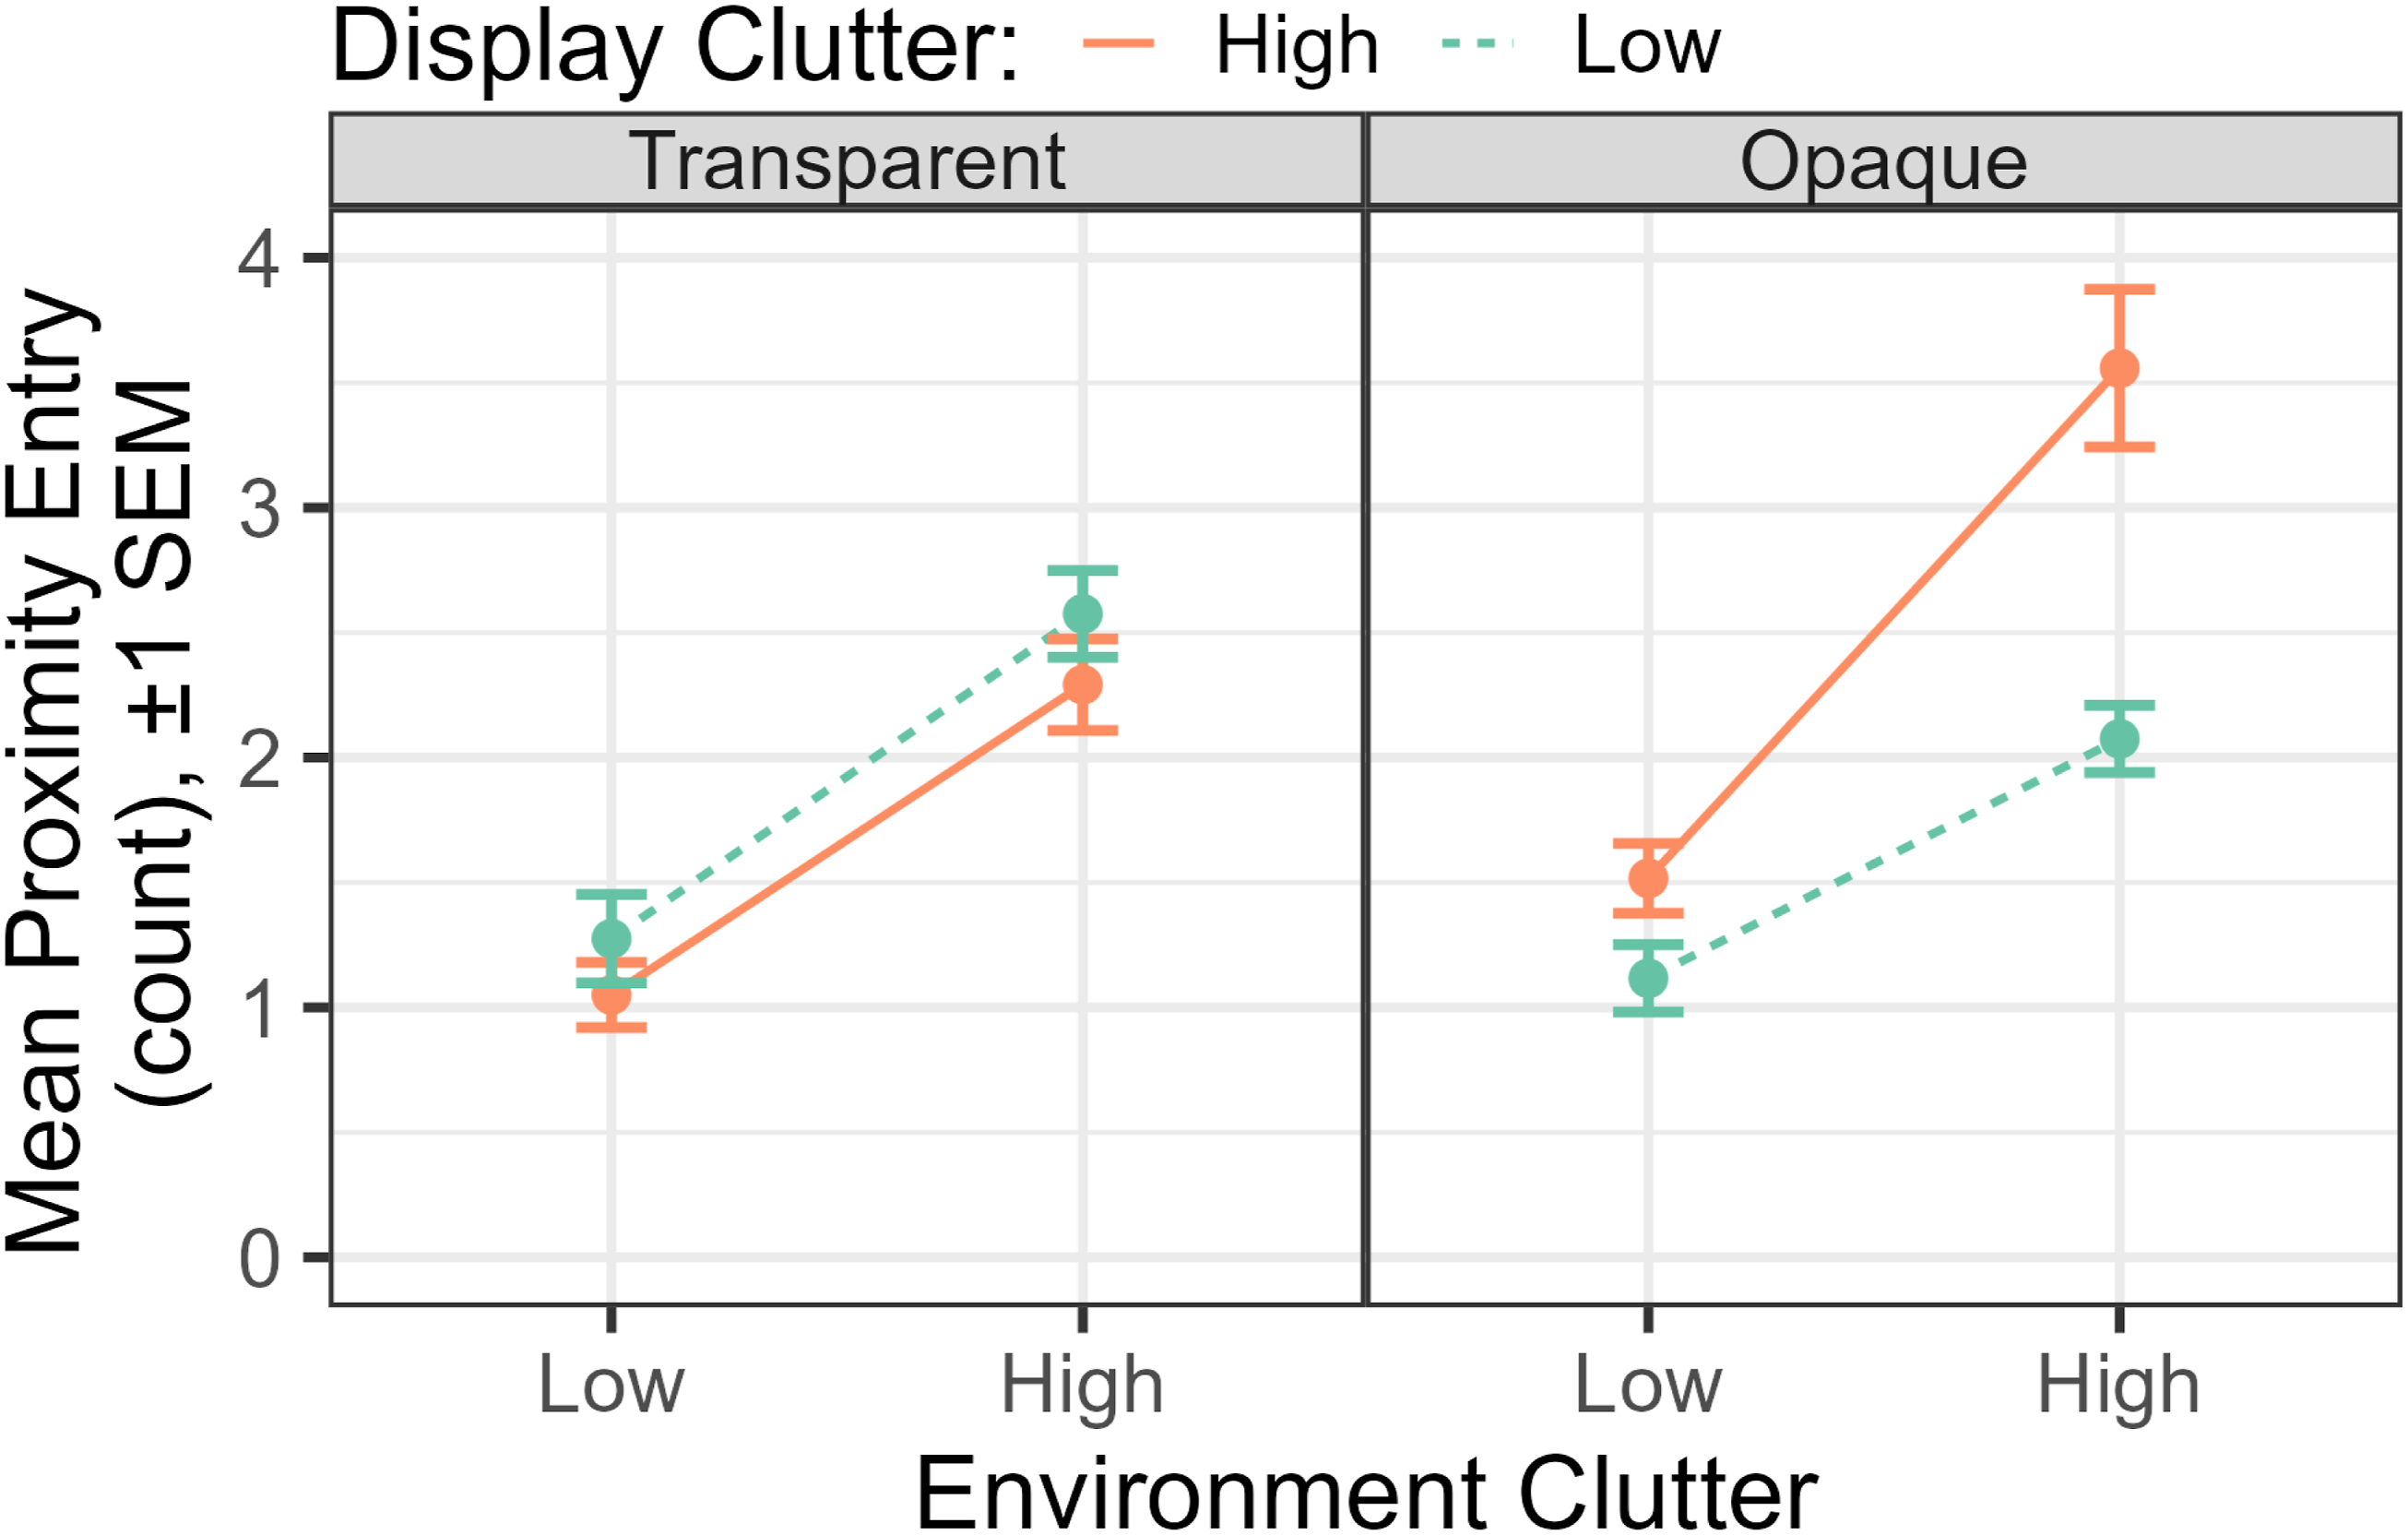
The significant effect of display clutter showed that safety violations were higher for high clutter (F (1, 29) = 4.95, p < .05,
To follow up on this analysis, we examined separately whether the penetrations were related to islands or the floating hazards. Figure 7 depicts the same data as Figure 6, but now broken down separately by penetrations of floating objects (left) or islands (right). It is apparent that obstacle penetrations were minimal and not affected by the independent variables. Thus, the composite effects shown in Figure 6, are exclusively associated with penetrations of the unsafe space surrounding the islands. Individual graphs for mean obstacles and mean island proximity entry. These values illustrate the difference in hazards from the Mean Proximity Entry and were plotted according to opacity level, environmental clutter, and display clutter. Error bars represent one standard error of the mean.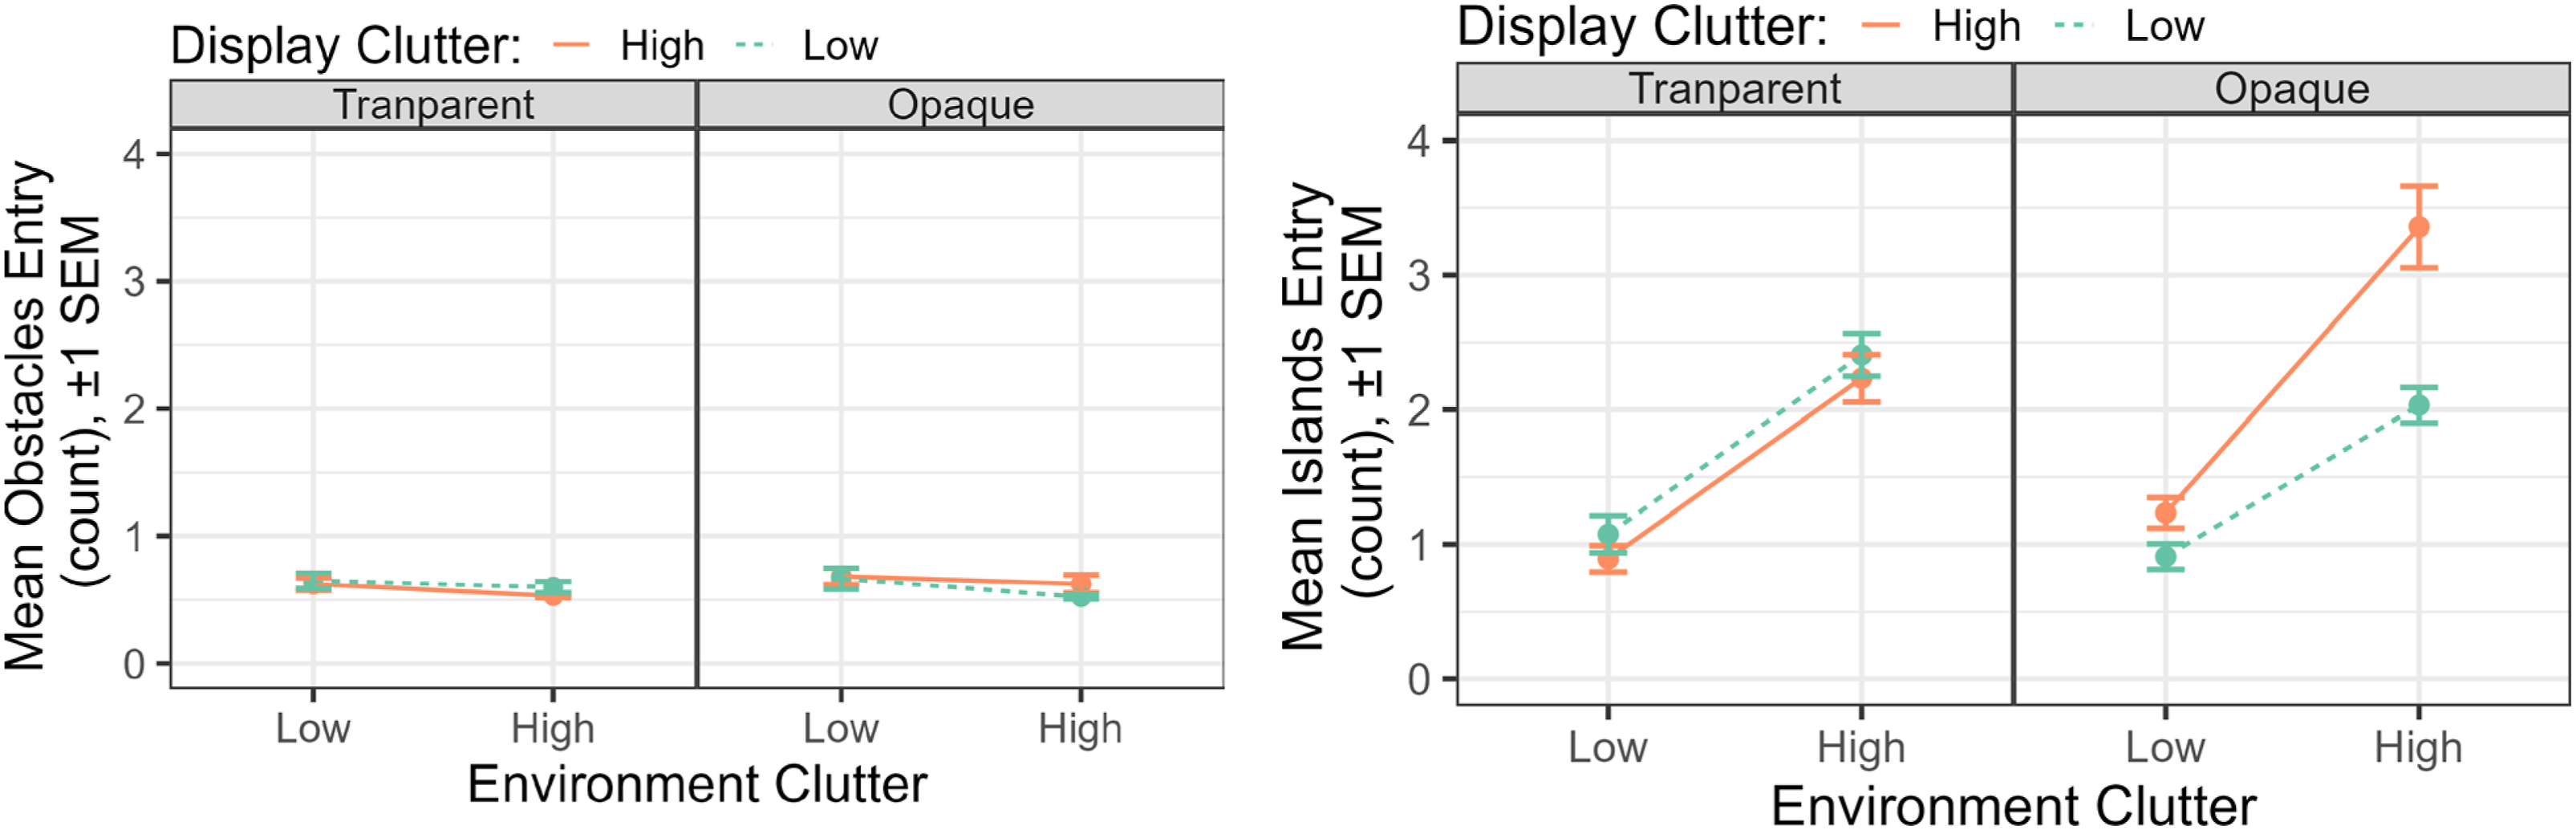
Mental workload TLX
While participants rated all six subscales of the TLX rating scale, in the current analysis, we focused exclusively on the mental demand scale. The other subscales were excluded because mental demand captured participants’ cognitive effort, decision making, and attention during the experimental task. Figure 8 presents the NASA-TLX mental demand rating as a function of clutter and transparency. An ANOVA on these data revealed that there was no effect of environmental clutter (F (1, 203) = 3.22, p = 0.074) but significantly higher workload when the display was transparent (F (1, 203) = 18.59, p < .001). There was also a statistically significant interaction between environmental clutter and opacity, such that low environmental clutter increased workload when the display was transparent, but not when it was opaque (F (1, 203) = 5.83, p < .05). Furthermore, during our debrief, 6 out of 30 participants reported nausea, blurry images, and dizziness as discomfort after finishing the experiment. Mean of mental demand. These values are then plotted according to the opacity level, environment clutter, and display clutter. Error bars represent one standard error of the mean.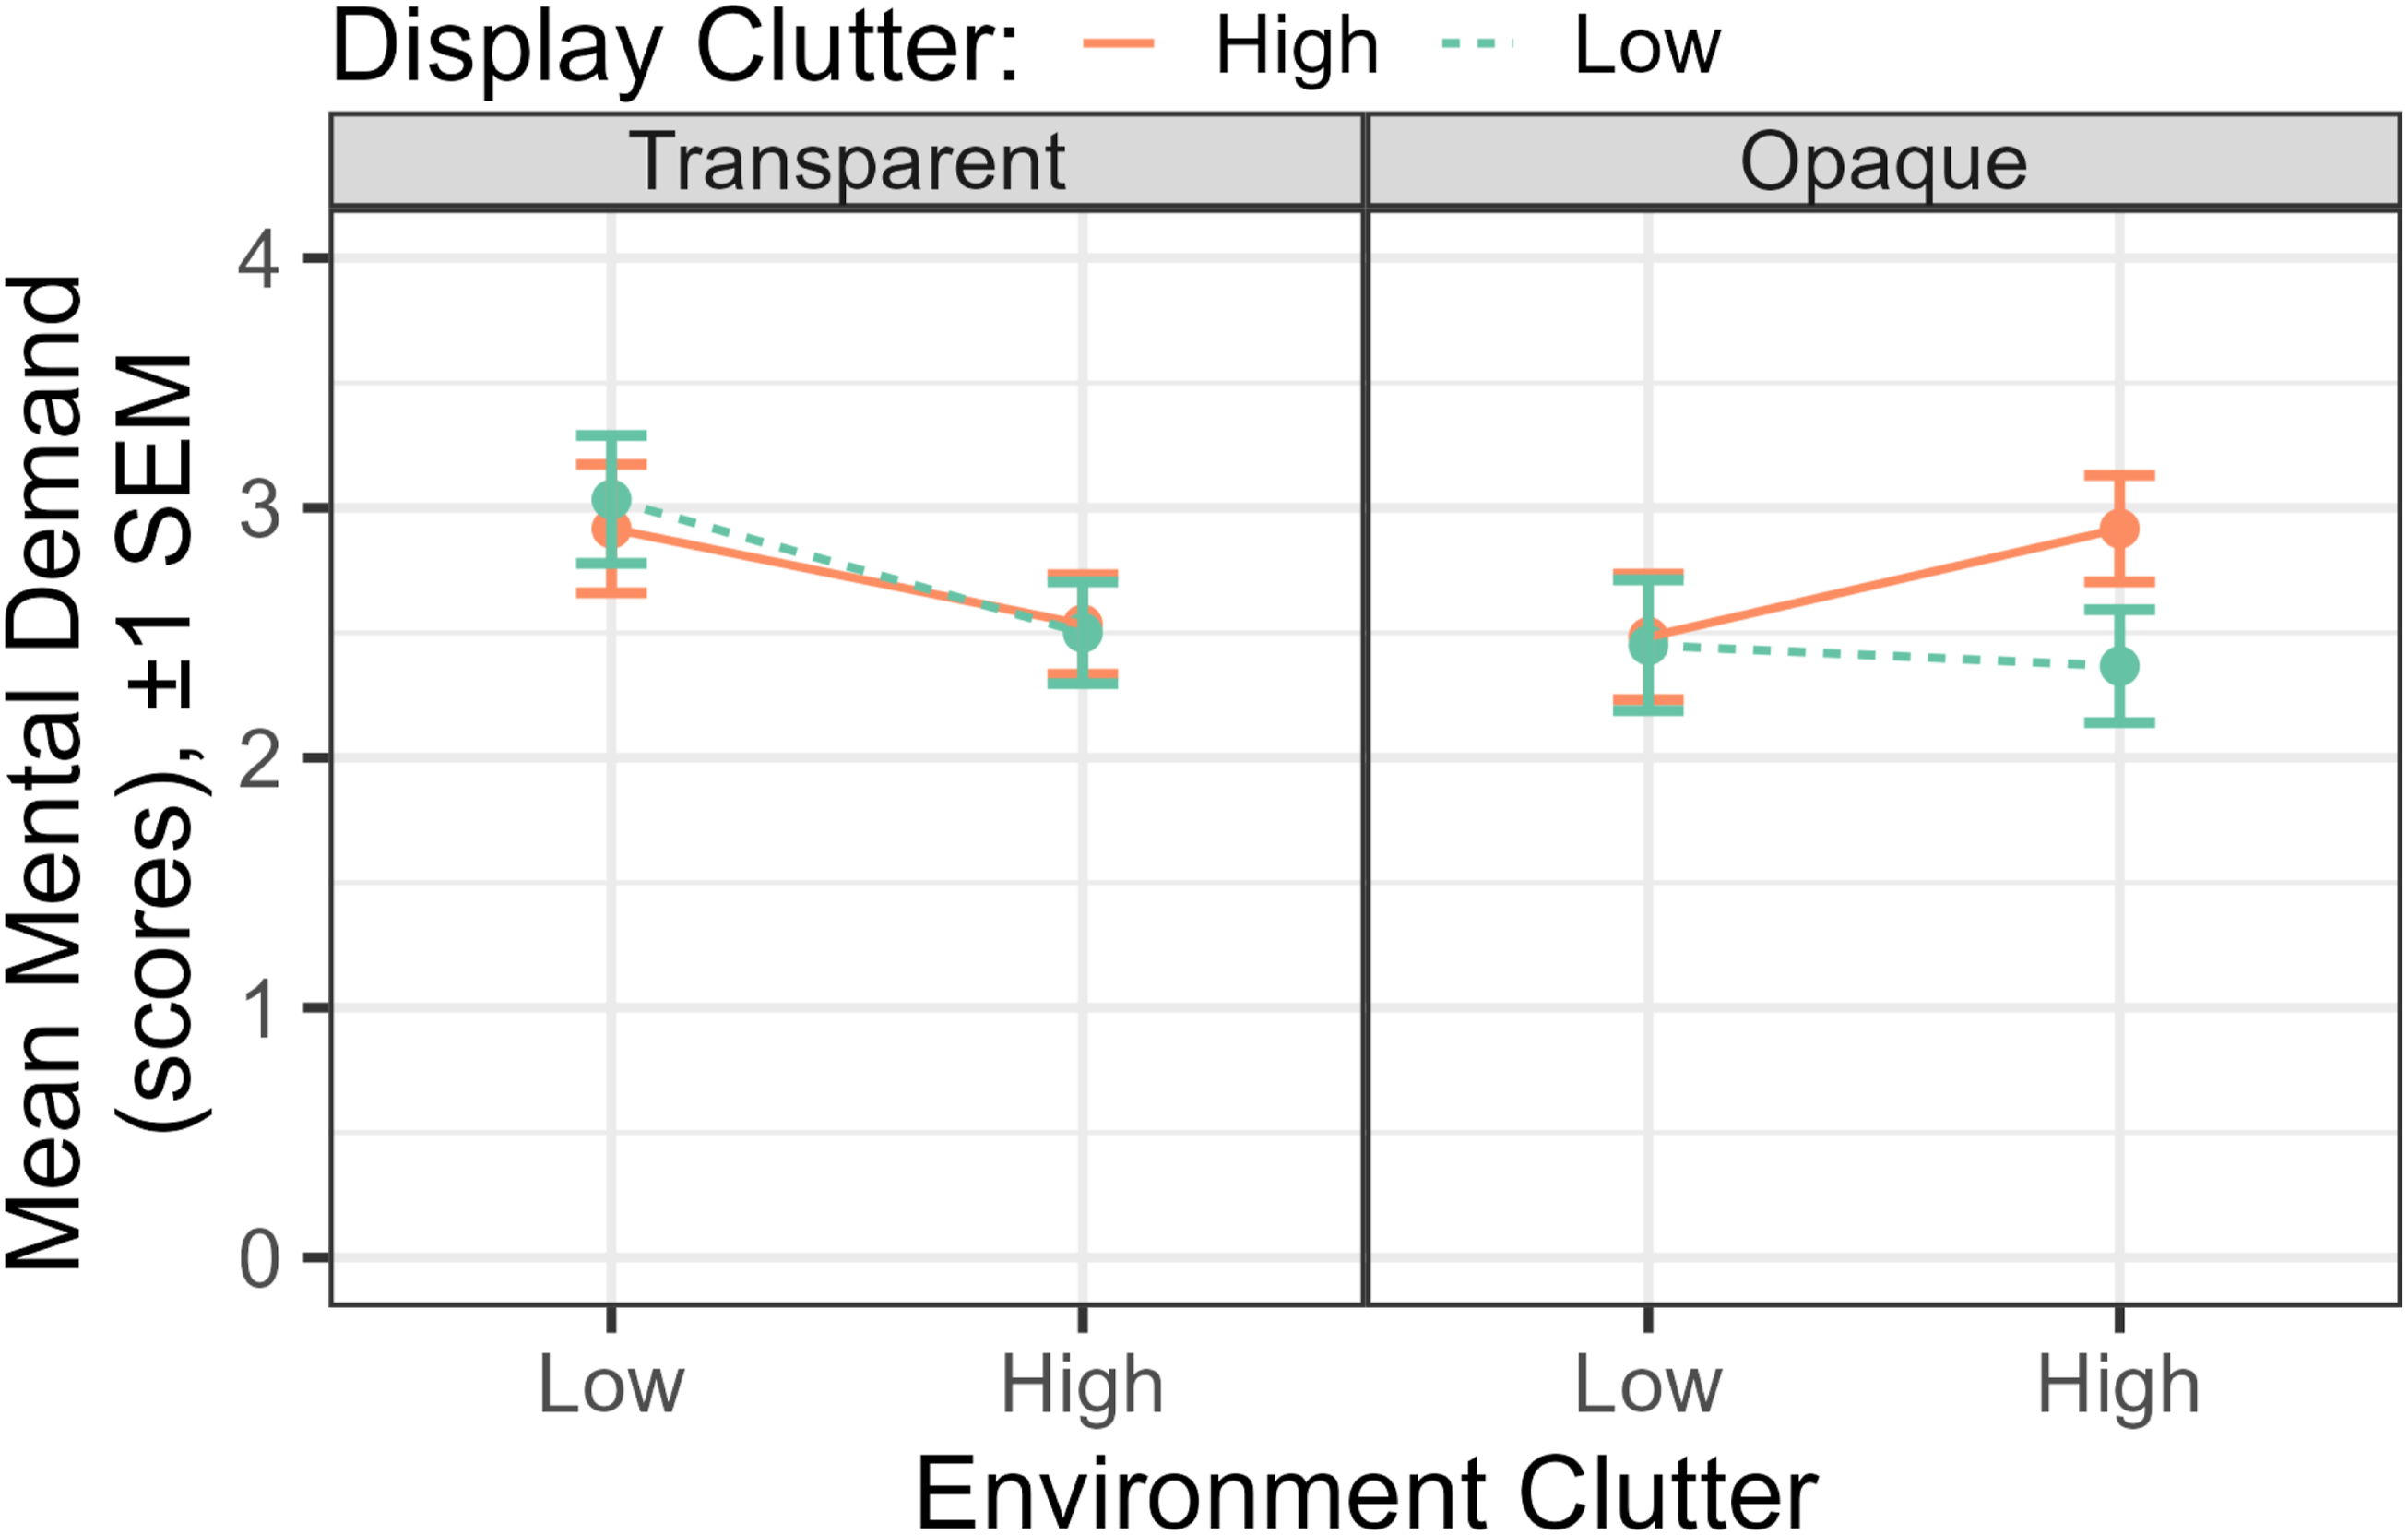
Discussion
In the current experiment, we evaluated the effects of two properties of the HMD—display transparency (versus opacity) and display clutter—along with an important property of the environment in which it is deployed—its clutter—in order to assess how these three features would influence the efficiency and safety of performance in a nautical navigation task. Below, we describe how the results initially impact efficiency and then safety, followed by a discussion of their effects on mental workload. The effects we describe are assumed to be mediated by three information processing variables: a cognitive variable related to the strategic choice of speed, a perceptual variable related to the degraded legibility of relevant display information, and an attentional/perceptual variable related to the distracting effects of overlay clutter (Warden et al., 2024).
Efficiency
We measured efficiency in terms of the environmental transit time. A preliminary analysis revealed that all of the influences of our three variables on transit time were imposed on the mean speed of travel, rather than the distance traveled. A slower speed, we reasoned, was a result of greater caution or less confidence in navigating the water safely, and hence a conscious choice to use lower throttle settings.
For each measure, we evaluated three hypotheses:
H1a proposed that increasing environmental clutter, here the number of islands would lead to slower travel. In fact, we found the reverse: more islands yielded faster transit, particularly and consistently when the display was transparent (display interface elements were hard to interpret), and hence environmental objects were highly visible in the field of view. We reasoned that this strategic choice to travel faster was guided by better visibility of environmental objects: if you can see them better, you travel faster. And if you can see smaller objects (Islands) more clearly, it further influences the decision to travel faster.
H1b proposed that transparency, and hence greater visibility of objects would slow travel because of greater caution exercised by the participants, and this was in fact found; particularly when there was low environmental clutter; that is, fewer, but larger, islands to be seen, a conclusion supported by the large interaction of the two variables, visualized in Figure 5.
H1c proposed slower travel with the more display clutter, an effect observed only with the opaque display (Figure 5) where the obscuration would “hide” more islands.
Safety
In terms of the penetrating safety violations with islands and hazards, our results revealed that nearly all of these, as well as the effects thereon, were witnessed by penetration of, or near collisions with islands, rather than with floating hazards.
H2a proposed more penetrations in a more cluttered, island-rich environment, and this was indeed strongly confirmed in Figure 6. Indeed, this effect of environmental clutter on safety penetrations could be predicted on purely statistical grounds: with twice as many islands (20 versus 10), participants choosing to navigate just within the bounds of safety nevertheless penetrated approximately twice as often (M = 2.7, SE = 0.17 vs M = 1.3, SE = 0.17). Figure 6 shows that this environmental clutter effect is relatively independent of the level of the other two variables, a pattern reflected by the absence of interactions.
H2b proposed that the opaque display, more obscuring of hazards, would increase the number of penetrations with those hazards, and, indeed, it did so. However, the interaction and the visual trend seen in Figure 6 indicated that this increased penetration rate was only observed under conditions of high display clutter, when, of course, there are more of those islands to be somewhat obscured by the opacity of the display.
Finally, H3 proposed that the increase in display clutter would partially obscure more environmental objects and hence lead to more “near collisions” with them, and this was indeed confirmed, although, as noted, only when those objects (islands) were more obscured by the more opaque display. Thus, display clutter and opacity both amplified each other’s degrading effect on safety.
The pattern of effects of the three variables on mental demand (Figure 8) appeared to closely mimic those on completion time (Figure 5), as did the pattern of statistical effects on the two variables. This would suggest that participants are highly sensitive to the factors that caused a delay, and use these as a proxy for their posttrial rating of mental demand.
Given the overall pattern of results, an HMD systems designer may wish to assess which combination of display features provides the most effective HMD design in nautical navigation. Here, the pattern of data provides no clear guidance, although they do suggest that when navigating in a highly cluttered environment, the poorest design for both efficiency and safety is an opaque display with high display clutter. However, such guidance is quite tentative at this point and requires considerably more research in which, in particular, more than a single level of transparency is examined. The current data also support the viability of theory-based metrics of clutter in predicting performance in this operational task. Collectively, the data reveal only partial success in this endeavor. Employing the well-validated object-count metric of clutter (Warden et al., 2024; Yeh & Wickens, 2001), our manipulations doubled the amount of both display and environmental clutter. Doubling environmental clutter (twice as many islands) produced a clear performance decrement of slightly more than doubling the number of unsafe proximity violations (Figure 7). However, it had no effect at all on completion time, suggesting the existence of a speed-accuracy tradeoff. It is quite possible that any negative effect of doubling the number of islands was offset by the benefit of increasing the ability to find a straighter path through them.
Doubling display clutter, and hence doubling the amount of either full (opaque) or partial (transparent) occlusion of the environmental hazards, appeared to have the predicted effect only when the display was in the fully occluded mode (right panels of Figures 6 and 7). Under this condition, the doubling of clutter nearly doubled the number of safety-violating penetrations and significantly increased completion time (no speed-accuracy tradeoff). However, the transparent display, whose goal was to decrease the clutter costs, expectedly reduced the clutter effects; but by effectively eliminating these costs altogether, it thereby rendered the clutter metric useless.
Limitations and future directions
One limitation of the current study was that the design of the environment, and particularly that the floating objects did not appear to be hazards at all, as their safety zones were never penetrated, and hence, floating hazard safety was not influenced by any of the independent variables. Future research will require a combination of increasing numerosity and varying the salience of such objects to create true hazards, akin to the runway incursions used in aviation HUD research (e.g., Fadden et al., 2001). Another limitation is the absence of eye movement data to assess the degree of use of various display elements and hence the extent to which these could be defined as necessary clutter. Another constraint on this research, also to be addressed in future experiments, is that we did not consider three other UI design factors, all deemed to be important in assessing the desired properties of HMDs for transportation systems: • The similarity in hue between displayed information and the dominant elements in the scene (Warden et al., 2023b). For example, the perception of green imagery rendered by an HMD would be expected to be degraded when viewed against a blue-green seascape beyond. • The layout of the HMD interface, which would be expected to induce maximum clutter costs for detecting scene hazards, if dense information were positioned directly over the center of the field of view in an HMD. The rationale is that humans use the central vision largely to see the information in sharp focus with maximum attention. We argued that in safety-critical environments, this central region of the UI should be kept free from HMD interface elements, as was done in the current design (see Figure 4). • A future study might explore designing the HMD interface and symbology to allow users to rely solely on the symbology, contrasting this with a condition where users engage in strategic decision making to identify the optimal path. • The difference in optical distance between the HMD imagery and the scene beyond. Collimation of HMD information to long distances approaching optical infinity, while viewing a distant scene, would be expected to reduce attention switching time between the two domains in a way that could benefit performance. But also, the removal of this differential cue of distance could impair the ability to focus on one domain while ignoring the other.
Conclusion
This experiment investigated nautical navigation performance when changing display opacity and the amount of clutter in both domains (HMD and environment). The task was evaluated in terms of efficiency, safety, and mental demand. The results of the study suggest to system designers preliminary guidance on reducing display clutter and using more transparent display designs in high-cluttered environments. However, this guidance is speculative as the study looked at one level of display transparency on reducing clutter and requires further examination in providing effective HMD display feature design.
Key Points
• We varied the display clutter and transparency of a simulated HMD in a nautical navigational task through environments of different clutter level. • A transparent HMD feature in high environmental clutter situations increased nautical navigational efficiency in terms of the task completion time with lower mental demand. • An opaque and highly cluttered HMD in nautical navigation decreased safety as it increased the proximity to hazards in the environment. • In a nautical navigational task with HMD under high environmental and display clutter situations, leading to more hazard proximity and decreased safety. • We identified compromises to both safety and efficiency associated with the combination of low display transparency and high display clutter on an HMD navigating a cluttered environment.
Footnotes
Declaration of conflicting interests
The authors declared no potential conflicts of interest with respect to the research, authorship, and/or publication of this article.
Funding
The authors received no financial support for the research, authorship, and/or publication of this article.