
Abstract
Costs and benefits are associated with how information is presented depending on the type of task required. A meta-analysis was conducted to examine the costs and benefits associated with overlaying information on a single display, as in the case with a head-mounted display, or presenting information more separately, as in the case with a head-down display (e.g., a tablet). Seventeen studies contributed a total of 82 individual effect sizes that met the inclusion criteria for the meta-analysis. Overall, overlaid displays led to a response time benefit for integration tasks without compromising accuracy, whereas separate displays led to an accuracy benefit for focused attention tasks. The findings here speak favorably to the use of head-mounted displays for tasks that require integrating information on the display with information in the real world.
Keywords
Introduction
As augmented reality head-mounted displays (AR-HMDs) become more pervasive in domains such as the military, aviation, and medicine, it is crucial to understand any performance tradeoffs that occur when using these devices for different tasks. For example, a common task for a soldier on the battlefield is to identify an enemy target embedded within a real-world scene (e.g., urban terrain) that is located some distance away from the soldier’s current location. Information about where the enemy is located can be conveyed directly on an HMD with a cue overlaying location information onto the real world. Such overlay reduces the amount of scanning, and therefore effort, required to access information. However, overlay information can impose a cost of clutter, obscuring the view of non-salient elements in the world beyond, which could have negative consequences. An alternative display format is to present this information on a head-down display (HDD), such as a tablet. While this increases the amount of scanning required when integrating information on the HDD with the real world, the magnitude of the costs in comparison to the costs of overlay clutter may not be as severe (Yeh et al., 2003).
One meta-analysis (Fadden et al., 2000) examined the benefits of head-up displays (HUDs) relative to head-down displays (HDDs) in vehicles, specifically cars and airplanes. Overall, evidence suggests that reduced scanning improved performance despite costs associated with overlay clutter imposed by the HUD. Another key finding indicated that performance costs and benefits were moderated by the type of task. The advantage of the HUD overlay was amplified when displayed information had to be integrated with real world information. This advantage was compared to situations where two information sources were processed independently, as is the case with dual-tasking, or when only focused attention was required for only one source of information. The interaction between display separation (overlay vs separate) and task type (integration vs focused attention) is a key aspect of the proximity compatibility principle. The proximity compatibility principle proposes a tradeoff, such that close display proximity (HMD overlay) improves performance for tasks requiring integration between two or more sources of information (Wickens & Carswell, 1995; Kroft & Wickens, 2003). But tasks requiring focused attention would benefit from reduced overlay clutter, suggesting information should be presented more separately (on an HDD like a tablet).
Previous literature suggests that HUD overlay has overall performance benefits compared to separate displays, particularly for integration (Fadden et al., 2000). However, little work has examined the issue of overlay clutter and increased display separation in meta-analytic form for HMDs. In addition, there is no meta-analytic examination of the differences between overlaid and separate sources of information presented on a 2D flat panel display (e.g., overlaying traffic and weather geospatial databases on a map). Furthermore, while some papers have reviewed the extensive applications of HMD and reported their performance effects (Dey et al., 2018, Jeffri & Rambli, 2021), they have not explicitly contrasted HMD performance with their counterparts on HDDs or hand-held displays (HHDs).
The data presented here are preliminary analyses examining the relationship between display location and task type. Display location takes into consideration both information presented on an HMD and information presented on 2D flat panel displays where different databases of information are directly overlaid or presented separately (i.e., side-by-side or further separated). The goal of the present work is to empirically determine the costs and benefits of overlay versus separate displays and to examine the moderating variable of task type.
Method
Literature Accumulation
We conducted a literature search using various databases (e.g., Academic Search Premier, APA PsycInfo, and Behavioural Sciences), including U.S. Army Research Laboratory technical reports. We also used web-based search engines, like Google Scholar, to find additional relevant references. After gathering the initial articles, we reviewed the reference lists to find other relevant articles. The primary search terms included: database/information integration, display separation, overlay, superimposition, separated, HHD, HDD, HMD, HUD, proximity compatibility principle, and augmented reality HMDs. We found a total of 218 empirical research articles, conference publications, and technical reports.
Inclusion Criteria
All manuscripts were reviewed to ensure they met the following inclusion criteria: (1) reported an empirical examination between overlaid versus adjacent information presented on a desktop display, or a comparison between information presented with an HMD versus information presented on either an HDD (e.g., tablet) or HHD (e.g., smartphone); (2) reported performance measures of response time and accuracy or error; (3) the tasks were either a focused attention task, an information integration task, and/or a dual-task scenario; (4) the design was within-subjects repeated measures; and (5) included sufficient statistics required for computing effect sizes.
Using these inclusion criteria, 22 manuscripts were excluded after reviewing the abstract alone. Other reasons for exclusion included: no direct comparison between the displays of interest (n = 98), duplicate records (n = 4), wrong study design (n = 37), wrong dependent measures (n = 48), and insufficient data reported (n = 6). After reviewing the articles, a total of 6 examined the comparison between overlay and adjacent displays, and 11 examined the comparison between HMDs and HHDs/HDDs. An additional 12 articles compared HUDs and HHDs/HDDs but were excluded here to focus our analysis on the differences between HMDs and HHDs/HDDs. A total of 17 articles contributed to the present meta-analysis. All literature included in this analysis is listed in the reference with an asterisk by the first author’s last name.
Effect Size Calculation and Variance Estimates
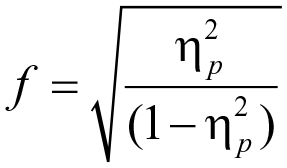
A total of 82 individual effects met the inclusion criteria for the display comparisons and were extracted from the articles. These effects included both significant and non-significant effects comparing either overlay versus adjacent displays or comparing HMDs versus HHDs/HDDs. After extracting the data for all the relevant effects in each study, each statistic was converted to a Cohen’s d effect size. Some studies only reported F-values while other studies only reported t-values or means and standard deviations (SD). To compute Cohen’s d from F-values, partial-eta squared (

In formula above, F represents the reported F-value and dfeffect and dferror represents the between-groups and the within-groups degrees of freedom, respectively. After computing
Next, Cohen’s f values were converted to Cohen’s d using the formula below (Cohen, 1988):

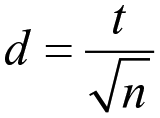
For all studies that reported t-values with no additional information, Cohen’s d was computed directly from the t-value and the sample size using the equation (Lakens, 2013; Rosenthal, 1991):
For all repeated measures studies that reported only means and SD, Cohen’s d was computed using the equation below (Lakens, 2013):
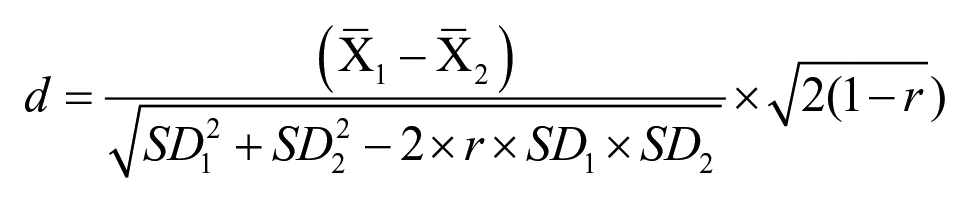
In the formula above, the numerator is the difference between the means of two groups and the denominator is the SD of the difference scores from the SD of both groups and their correlations (Lakens, 2013; Cohen, 1988), where r represents the correlation between measures, and SD represents the standard deviation. The sampling variance of d was computed using the method reported in the literature (see Cooper et al., 2009; Wilson, 2017).
Most of the articles consisted of multiple individual effects, therefore effects measuring the same dependent variable were average and weighted to account for the non-independence of multiple effect sizes. Effect sizes were aggregated and separated based on the display characteristics, dependent measures, and the moderating variable of task type (described below). For example, if one study reported three effects showing a benefit for overlaid compared to adjacent displays for response time during a focused attention task, those three effects were averaged and weighted (i.e., multiplied by 1/3, since a total of 3 effects were included). All effect sizes were categorized as either a benefit (i.e., shorter response time or higher accuracy) of overlay or of HMDs (+d) or a benefit of adjacent or separate displays (-d). Specifically, a benefit of overlay (+d) means that overlaid displays decreased response time (i.e., faster response time) and increased accuracy compared to separate displays, whereas a benefit of separate (-d) means that separate displays decreased response time and increased accuracy compared to overlaid displays.
Moderator Variable
A critical moderator variable was the type of task. The tasks of interest included focused attention tasks, information integration tasks, and dual-tasking scenarios. Focused attention tasks include those that required focused attention on only one source of information. Information integration tasks required participants to integrate information between two sources. Dual-tasks included a primary task (e.g., flight tracking, navigation, driving) and a secondary focused attention task (e.g., monitoring, detection, digit recall) that were completed simultaneously. These are hybrids between integration tasks and focused attention tasks. Like integration tasks, in that they require processing information in each domain. But like focused attention tasks, where they require sequential focus of attention on one database and then the other, with no integration. Table 1 presents examples of task details from some of the studies.
Unique examples of different types of tasks for each unique display comparison. Note that only dual-tasks consisted of both primary and secondary tasks.

Results
The combined effect sizes from all studies were averaged to examine whether display type (overlay/HMD vs separate) or task had an impact on response time and accuracy or error. A result was considered significant if the mean effect size was at least two standard errors (2SE) away from zero.
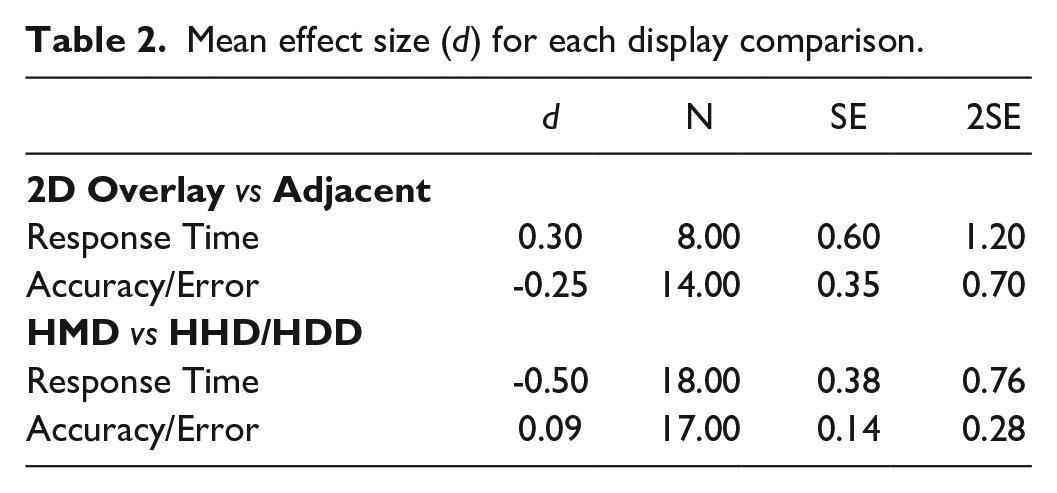
Table 2 provides the mean effect sizes (Cohen’s d) for response time and accuracy, the number of effects (N), standard error (SE), and two SE (2SE) values for the display comparisons only: (1) overlay versus adjacent displays and (2) HMD versus HHD/HDD (separate) displays. Based on 2SE, there appear to be no significant benefits of either overlay/HMD or adjacent/separate displays.
Mean effect size (d) for each display comparison.
In order to examine the role that the moderating variable had on response time and accuracy, data were collapsed across display types such that overlay and HMD were categorized as ‘overlay’, and adjacent and HHD/HDD were categorized as ‘separate.’ Figure 1 shows the average weighted mean effect sizes for response time as a function of task type. The error bars represent 2 SE of the mean. Dual-tasks have a mean effect size that is nearing significance (d = -0.65, SE = 0.39, 2SE = 0.78), suggesting a possible benefit of adjacent displays. The effect size for focused attention tasks was not different from zero (d = 0.79, SE = 0.64, 2SE = 1.28). The non-significance of such large effect sizes for both dual-tasks and focused attention tasks may be due to too few studies and high variability, and thus warrants further investigation. For information integration tasks, there was a significant benefit for overlaid displays compared to separate displays (d = 0.86, SE = 0.32, 2SE = 0.64). Overall, these findings suggest that overlaid displays decrease response time for tasks that require information integration, but not for those that require focused attention or dual-tasking.
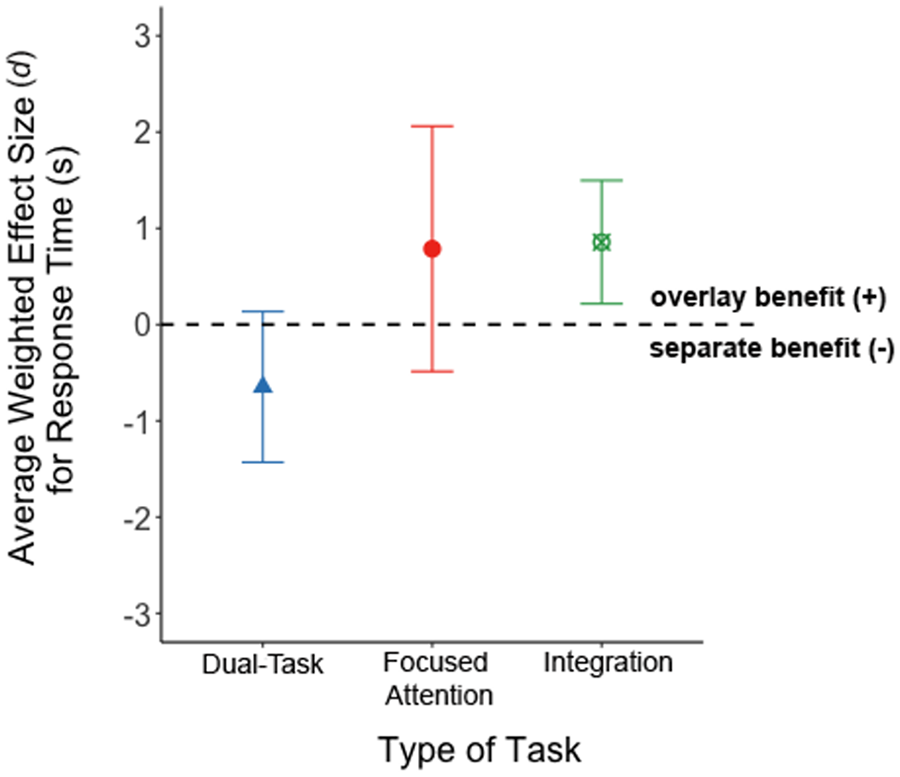
Mean weighted effect sizes (Cohen’s d) for response time as a function of task type. Error bars represent two SEM. Positive and negative effects indicate a benefit for overlay and separate displays, respectively.
Figure 2 shows the average weighted mean effect sizes for accuracy as a function of task type. The mean effect size for dual-tasks neared significance but with a small effect size (d = 0.17, SE = 0.12, 2SE = 0.24), hinting at a minor potential accuracy benefit for overlaid displays. For focused attention tasks, there was a significant large benefit of separate compared to overlaid displays (d = -2.14, SE = 1.0, 2SE = 2.0). Integration tasks showed no benefit on accuracy for either type of display (d = 0.06, SE = 0.23, 2SE = 0.46). Separate displays can therefore be seen to play an influential role on improved accuracy for focused attention tasks.
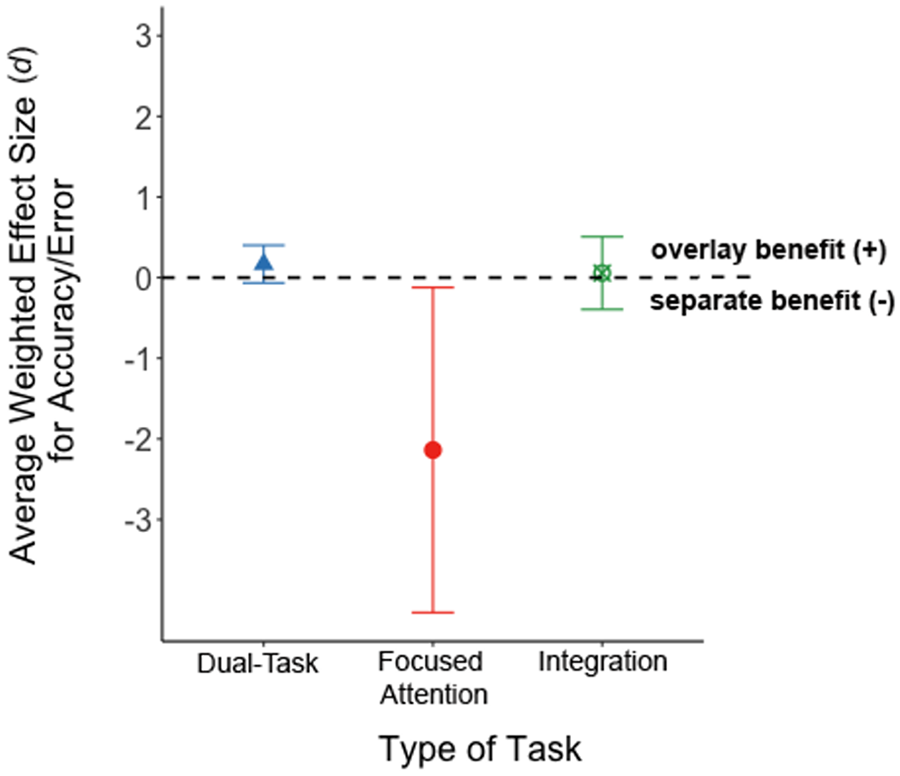
Mean weighted effect sizes (Cohen’s d) for accuracy as a function of task type. Error bars represent two SEM. Positive and negative effects indicate a benefit for overlay and separate displays, respectively.
Discussion
The present work aimed to synthesize the overall body of literature examining performance differences when using either 2D database overlay or head-mounted displays compared to separate displays (2D adjacent database, HDDs, or HHDs) for different types of tasks (dual-tasking, focused attention, and information integration). A total of 82 individual effect sizes from 17 articles were included in the meta-analysis. The collective wisdom from these effects conveys relatively clear findings consistent with the proximity compatibility principle.
Consistent with the principle, the collective effect for response time data indicates that overlay displays are best for information integration tasks, but not for focused attention tasks. This is likely attributed to reduced scanning and head movements between separate sources of information when integration is required. Also consistent, the collective effect for accuracy indicates that separate displays are best for focused attention tasks, but not for information integration tasks. This is likely due to the effects of overlay clutter when information in two domains (e.g., information on an HMD and information in the real world scene) are superimposed. In this context, overlay clutter refers to the visual complexity of a scene or display of information that is created when more than one source of information is superimposed onto another. Such overlay clutter can disrupt the perception of visual information, causing issues with locating and extracting relevant information for a given task due to occlusion and crowding (Pankok & Kaber, 2018). In line with prior work, overlay clutter appears to have decreased accuracy for focused attention tasks, but not information integration (Kroft & Wickens, 2003).
In the methods section, dual-tasking was defined as a hybrid of integration and focused attention tasks, such that they require the processing of information in each domain (integration) and they often involve sequentially focusing on one database at a time (focused attention). The current results support this hybrid status. Specifically, dual-tasking never significantly benefited from either type of display configuration (overlay or separate). Furthermore, dual-tasking scenarios hint at a trend toward faster response time for separate displays and more accurate performance for overlay displays, suggesting a speed-accuracy tradeoff.
That overlay displays benefit response time without hindering accuracy for tasks requiring information integration speaks favorably for HMDs. For example, in the context of target cueing, a soldier is required to integrate location information indicated by a cue on an HMD with information in the real world as quickly and accurately as possible when deciding whether they have found an enemy target (Yeh et al., 2003). In such sensitive situations, reducing search time without imposing an accuracy cost is critical. In the context of augmented reality head-mounted displays (AR-HMDs), related work has shown a reduction in search time for 3D objects at specific locations in a room when cues guided attention to the location of a specific target (Warden, et al., 2022). This benefit was greater for an arrow cue, which minimized overlay clutter, compared to a minimap cue which occluded more of the real world scene. Fadden and colleagues (2000) also found an overall benefit of overlay for HUDs compared to separate displays, especially for conformal imagery which is an analog to augmented reality. Thus, overlaying information on devices such as AR-HMDs appears to be a viable option for time-critical tasks that require integration across more than one domain of information.
Contrary to the prior meta-analysis examining the costs and benefits of HUDs compared to separate displays (Fadden et al., 2000), the collective findings here did not reveal an overall significant benefit of overlay compared to separate displays for either response time or accuracy. It may be the case that this lack of effect is due to the limited amount of research examining HMDs. Specifically, much of the literature does not examine the direct comparison between HMDs and separate display formats for tasks that require focused attention, integration, or dual-task scenarios (see Dey et al. 2018 for review). Much of the current literature on HMDs not included in the present work examines other measures, such as user preferences, mental workload, or subjective reports, and the few studies that do examine performance measures do so for different types of tasks (Dey et al., 2018, Jeffri & Rambli, 2021).
Conclusions
The main finding that emerges from the present meta-analysis is that overlay displays improve response time for integration tasks and separate displays improve accuracy for focused attention tasks. However, no overall benefit of one display format over another was found. The key moderating variable of task type appears to drive the costs and benefits of one display format over another. Therefore, while the use of overlay displays may benefit response time for integration tasks, such use may hinder performance when a task requires focused attention on only one source of information. These findings have design implications for how to present information for various types of tasks.
Limitations & Future Directions
A common limitation of meta-analyses is that they include different types of studies and that the summary effects may not take into account differences between studies. While the work here established specific inclusion criteria, the studies inherently have fundamental differences. Another limitation is that the work here did not include effect sizes from research examining HUDs, the other design where overlay is critical. One reason for this was to explicitly look at the effects of HMDs, which has not been done before. However, further work could include effects from studies examining HUDs, given that HUDs can also be projected onto displays that are akin to HMDs.
Footnotes
Acknowledgements
This research was supported by the Office of Naval Research under grant numbers N00014-21-1-2949 and N00014-21-1-2580. Dr. Peter Squire was the scientific/technical monitor.