
Abstract
Objective
This experiment examined performance costs when processing two sources of information positioned at increasing distances using a flat panel display and an augmented reality head-mounted display (AR-HMD).
Background
The AR-HMD enables positioning virtual information at various distances in space. However, the proximity compatibility principle suggests that closer separation when two sources of information require mental integration assists performance, whereas increased separation between two sources hurts integration performance more than when a single source requires focused attention. Previous studies have provided inconsistent findings regarding costs associated with increased separation. Few of these experiments have examined separation for both focused and integration tasks, compared vertical and lateral separation, or measured head movements.
Method
Three experiments collectively examined these issues using a flat panel display and a virtual display presented with an HMD, where the separation of information varied laterally or vertically during a focused attention (digit reading) task and an information integration (mental subtraction) task.
Results
There was no performance cost for either display when information was increasingly separated. However, head movements mitigated performance costs by preserving accuracy at larger separations without increasing response time.
Conclusion
Head movements appear to mitigate performance costs associated with presenting information increasingly far apart on flat panel displays and HMDs. Both eye scanning and head movements appear to be less effortful than expected.
Application
These findings have important implications for design guidelines regarding the placement of information presented on flat panel displays and, more specifically, HMDs, which can present information 360° around the user.
Keywords
INTRODUCTION
Advanced displays overlay layers of information, such as terrain information overlaid with weather information. In electronic maps, designers may choose to overlay features on the geographical terrain (the base layer), such as labels, weather, hazards, or traffic information (Illingworth & Feigh, 2022; Kroft & Wickens, 2001; Wickens et al., 2000). Other sophisticated displays, such as head-up displays (HUDs) and head-mounted displays (HMDs), similarly overlay information on the display onto the real world scene. Display configurations of these devices can vary in their spatial separation of information sources. On one end, the HUDs or HMDs superimpose (i.e., overlaid) information onto the real world scene, which minimizes spatial separation and visual scanning but imposes costs associated with clutter. At the other end, large screen monitors, multiple monitors, head-down displays (HDDs), and side view mirrors eliminate costs imposed by clutter when overlaying multiple sources of information but impose costs associated with eye scanning and often head movements to access separated sources of information. Such an unwanted cost of visual scanning is referred to as information access effort (IAE), denoting the mental or physical effort required to move attention from one source of information to another (Wickens, 2014). When positioning and configuring displays, both clutter and visual scanning represent a tradeoff, known as the scan-clutter tradeoff, between information that is overlaid or presented separately. In the present work, three experiments examine any costs associated with IAE and how different attention demands imposed by the task modulate these costs. These experiments are based on a theory of information access effort, proposing that any effort involved in sequentially accessing sources of information (a) can be tied to muscle movement, (b) has a performance cost, (c) can produce costs to accuracy if effort is insufficiently allocated to assure that all information is resolved in foveal vision, and (d) can interact with the cognitive effort imposed by working memory demands.
The Scan-Clutter Tradeoff and the Proximity Compatibility Principle
The scan-clutter tradeoff has been examined in the context of both overlaid maps (Illingworth & Feigh, 2022; Kroft & Wickens, 2002) and HUDs (Fadden et al., 2000, 2001). A meta-analysis examining performance differences between HUDs (i.e., overlay displays) and head-down (i.e., separate) displays for pilots and vehicle drivers revealed an overall large benefit of HUDs, suggesting that reduced scanning improved performance. A corresponding meta-analysis for HMDs appears to reveal similar trends (Warden et al., 2023), and one specific experiment comparing performance with an HMD to an HDD indicated a general advantage for the HMD (Yeh et al., 2003).
Both the meta-analyses and the experiment by Kroft and Wickens (2002) suggest that the advantage of overlay (HUD or HMD) relative to HDDs was moderated by the type of task, specifically, differences between a focused attention task and an information integration task. A focused attention task requires extracting information from one source, such as searching for a landmark on a map while ignoring other information. An integration task requires combining multiple sources of information, such as directing a user’s attention to important real world elements with a cue on a display. Performance on these tasks is directly impacted by how information is displayed. According to the proximity compatibility principle (Wickens & Carswell, 1995; Wickens et al., 2022; Yang et al., 2014), overlay displays represent close spatial proximity and separate displays represent distant spatial proximity. According to this principle, tasks requiring integration are better supported by display overlay (close display proximity), whereas tasks requiring focused attention are not.
Information Access Effort
The primary factor examined in the current work is the degree of visual scanning imposed when displays are spatially separated, which influences performance with information displays. This factor represents the general concept of IAE. Specifically, when the distance between sources of information increases, the amount of scanning required to access information increases (Draschkow et al., 2021; Gray & Fu, 2004). In prior experiments, the cost of separation has been confounded by the removal of clutter (Kroft & Wickens, 2002; Yeh et al., 2003). However, IAE imposed by spatial separation alone remains an important issue in human factors design. An increased IAE due to an increased visual angle of separation (VAS) can impose costs in terms of increased response time and errors when moving attention from one source of information to another (Ballard et al., 1995; Martin-Emerson & Wickens, 1992; Schons & Wickens, 1993; Wickens, 1993; Yang et al., 2014). While these costs are often measured in terms of performance, IAE can also be quantified in terms of keystrokes or mouse movements required to access database information (Ballard et al., 1995; Yang et al., 2014), as well as the frequency of eye scans and head movements (Kim et al., 2010). Quantifying the effects of the VAS (a.k.a. eccentricity or display separation) has practical implications that inform how far apart displays or information within displays can be without imposing excessive costs of scanning or head movements. A few examples where excessive costs of scanning or head movements may come into play include large display workstations, or glanceable AR, in which important HMD information can be presented in augmented reality (AR) outside the forward field of view of the HMD and 360° around the viewer (Lu et al., 2020). Another example includes the positioning of rear and side view mirrors relative to the driver’s forward line of sight (Murata et al., 2018).
An excessive VAS may lead viewers to implicitly decide not to relay on a peripheral source of information in order to conserve effort (Wickens, 2014). Instead, individuals may choose to rely upon the memory of what was last viewed at a prior location or to tolerate the risk of not looking there at all (Ballard et al., 1995; Draschkow et al., 2021; Gray & Fu, 2004). For example, drivers may fail to check the blind spot, which involves high IAE of not only the head but also a full torso rotation. Alternatively, peripheral information access may be insufficient. A quick glance may fail to bring the critical region into full foveal vision, but only into the lower resolution area known as the parafoveal region, spanning approximately 8° (Kishishita et al., 2014; Sharmin & Vohnsen, 2020), or enables information at the destination to be only poorly resolved with peripheral vision. In addition to the consequences associated with excessive VAS, it is important to consider other factors that moderate the effort to access information.
Information access effort can be moderated by the type of task, and, therefore, directly linked to the proximity compatibility principle. When integrating information is required, information from the first source must be retained in working memory while accessing the second source. A longer “travel time” in terms of the visual angle between sources can degrade the contents of the information in working memory to a greater degree, which consequently hinders accuracy. In a synthetic work environment, research has documented the effects of memory load on inhibiting information access over larger visual angles (Ballard et al., 1995; Draschkow et al., 2021). As predicted by the proximity compatibility principle, the costs of increasing VAS should be greater for an integration task than a focused attention task due to the greater working memory load.
Quantifying Information Access Effort
The information access cost in terms of visual angle of separation (VAS) is generally assumed, and sometimes found, to be nonlinear. This is because as VAS increases, three different muscle groups are successively activated, resulting in different levels of physical effort when accessing information. Houtmans and Sanders (1984) define the region up to approximately 20°–25° of eccentricity as the eye field, where a simple eye movement is adequate to access information. Due to the low inertia of eyeball rotation, the amount of muscle effort to make an eye movement is small, and the movement is essentially ballistic. With greater separation beyond approximately 25°, the head field is entered. In this region, it becomes uncomfortable to rotate only the eyeball, and neck rotation is then also required (Kim et al., 2010). The head has far more mass than the eyeball, requiring more muscles to rotate it and, therefore, requiring more physical effort. Furthermore, unlike the eye field, with greater VAS within the head field, there is progressively more resistance to make longer head rotations, and hence a nonlinear increasing function conveying a greater performance cost. Finally, VAS beyond the head field enters the body field where torso rotation is required (e.g., checking the blind spot in a car). The simple prediction of “effort” as a function of VAS is postulated in Figure 1. The slight acceleration once the head field is entered reflects a nonlinear resistance to neck rotation at higher angles. Hypothetical data conveying Information Access Cost as a function of increasing visual angle of separation (VAS). The x-axis depicts spatial separation measured in degrees and the y-axis depicts the hypothesized performance cost measured as increasing response time and/or error rate.
There are two consequences of increasing VAS imposing greater effort: (1) simply moving the gaze, assisted by nonballistic head movements, takes more time and (2) there may be a reluctance to move the gaze sufficiently far enough to fully foveate information at the destination, causing reliance on peripheral vision from a quick glance to perceive what is there, which may degrade accuracy.
We examined a set of prior studies that varied VAS across two or more levels to determine: (1) if any nonlinearity has been observed with increasing VAS as predicted in the original model of Houtmans and Sanders (1984) when the head field was entered and (2) if there was any consensus across studies about the presence and value of a discontinuity or “elbow” in the graph denoting the transition from the eye field to the head field. Data for the standardized response times are shown in Figure 2. The general increasing response time with increasing VAS is highly apparent. However, regarding nonlinearity, there is little evidence for a discontinuity, with only one study appears to show a clear accelerating visual trend (darker green solid line). This study appears to suggest a discontinuity at around 30°. A meta-summary of standardized response times as a function of lateral (circles) and vertical (triangles) display separation. Colors and line types correspond to different experiments for the listed reference, all of which used spatial tasks. The Figure is standardized by dividing measured response time for each study/condition by the maximum value within the set which is the pink dashed line at 30°.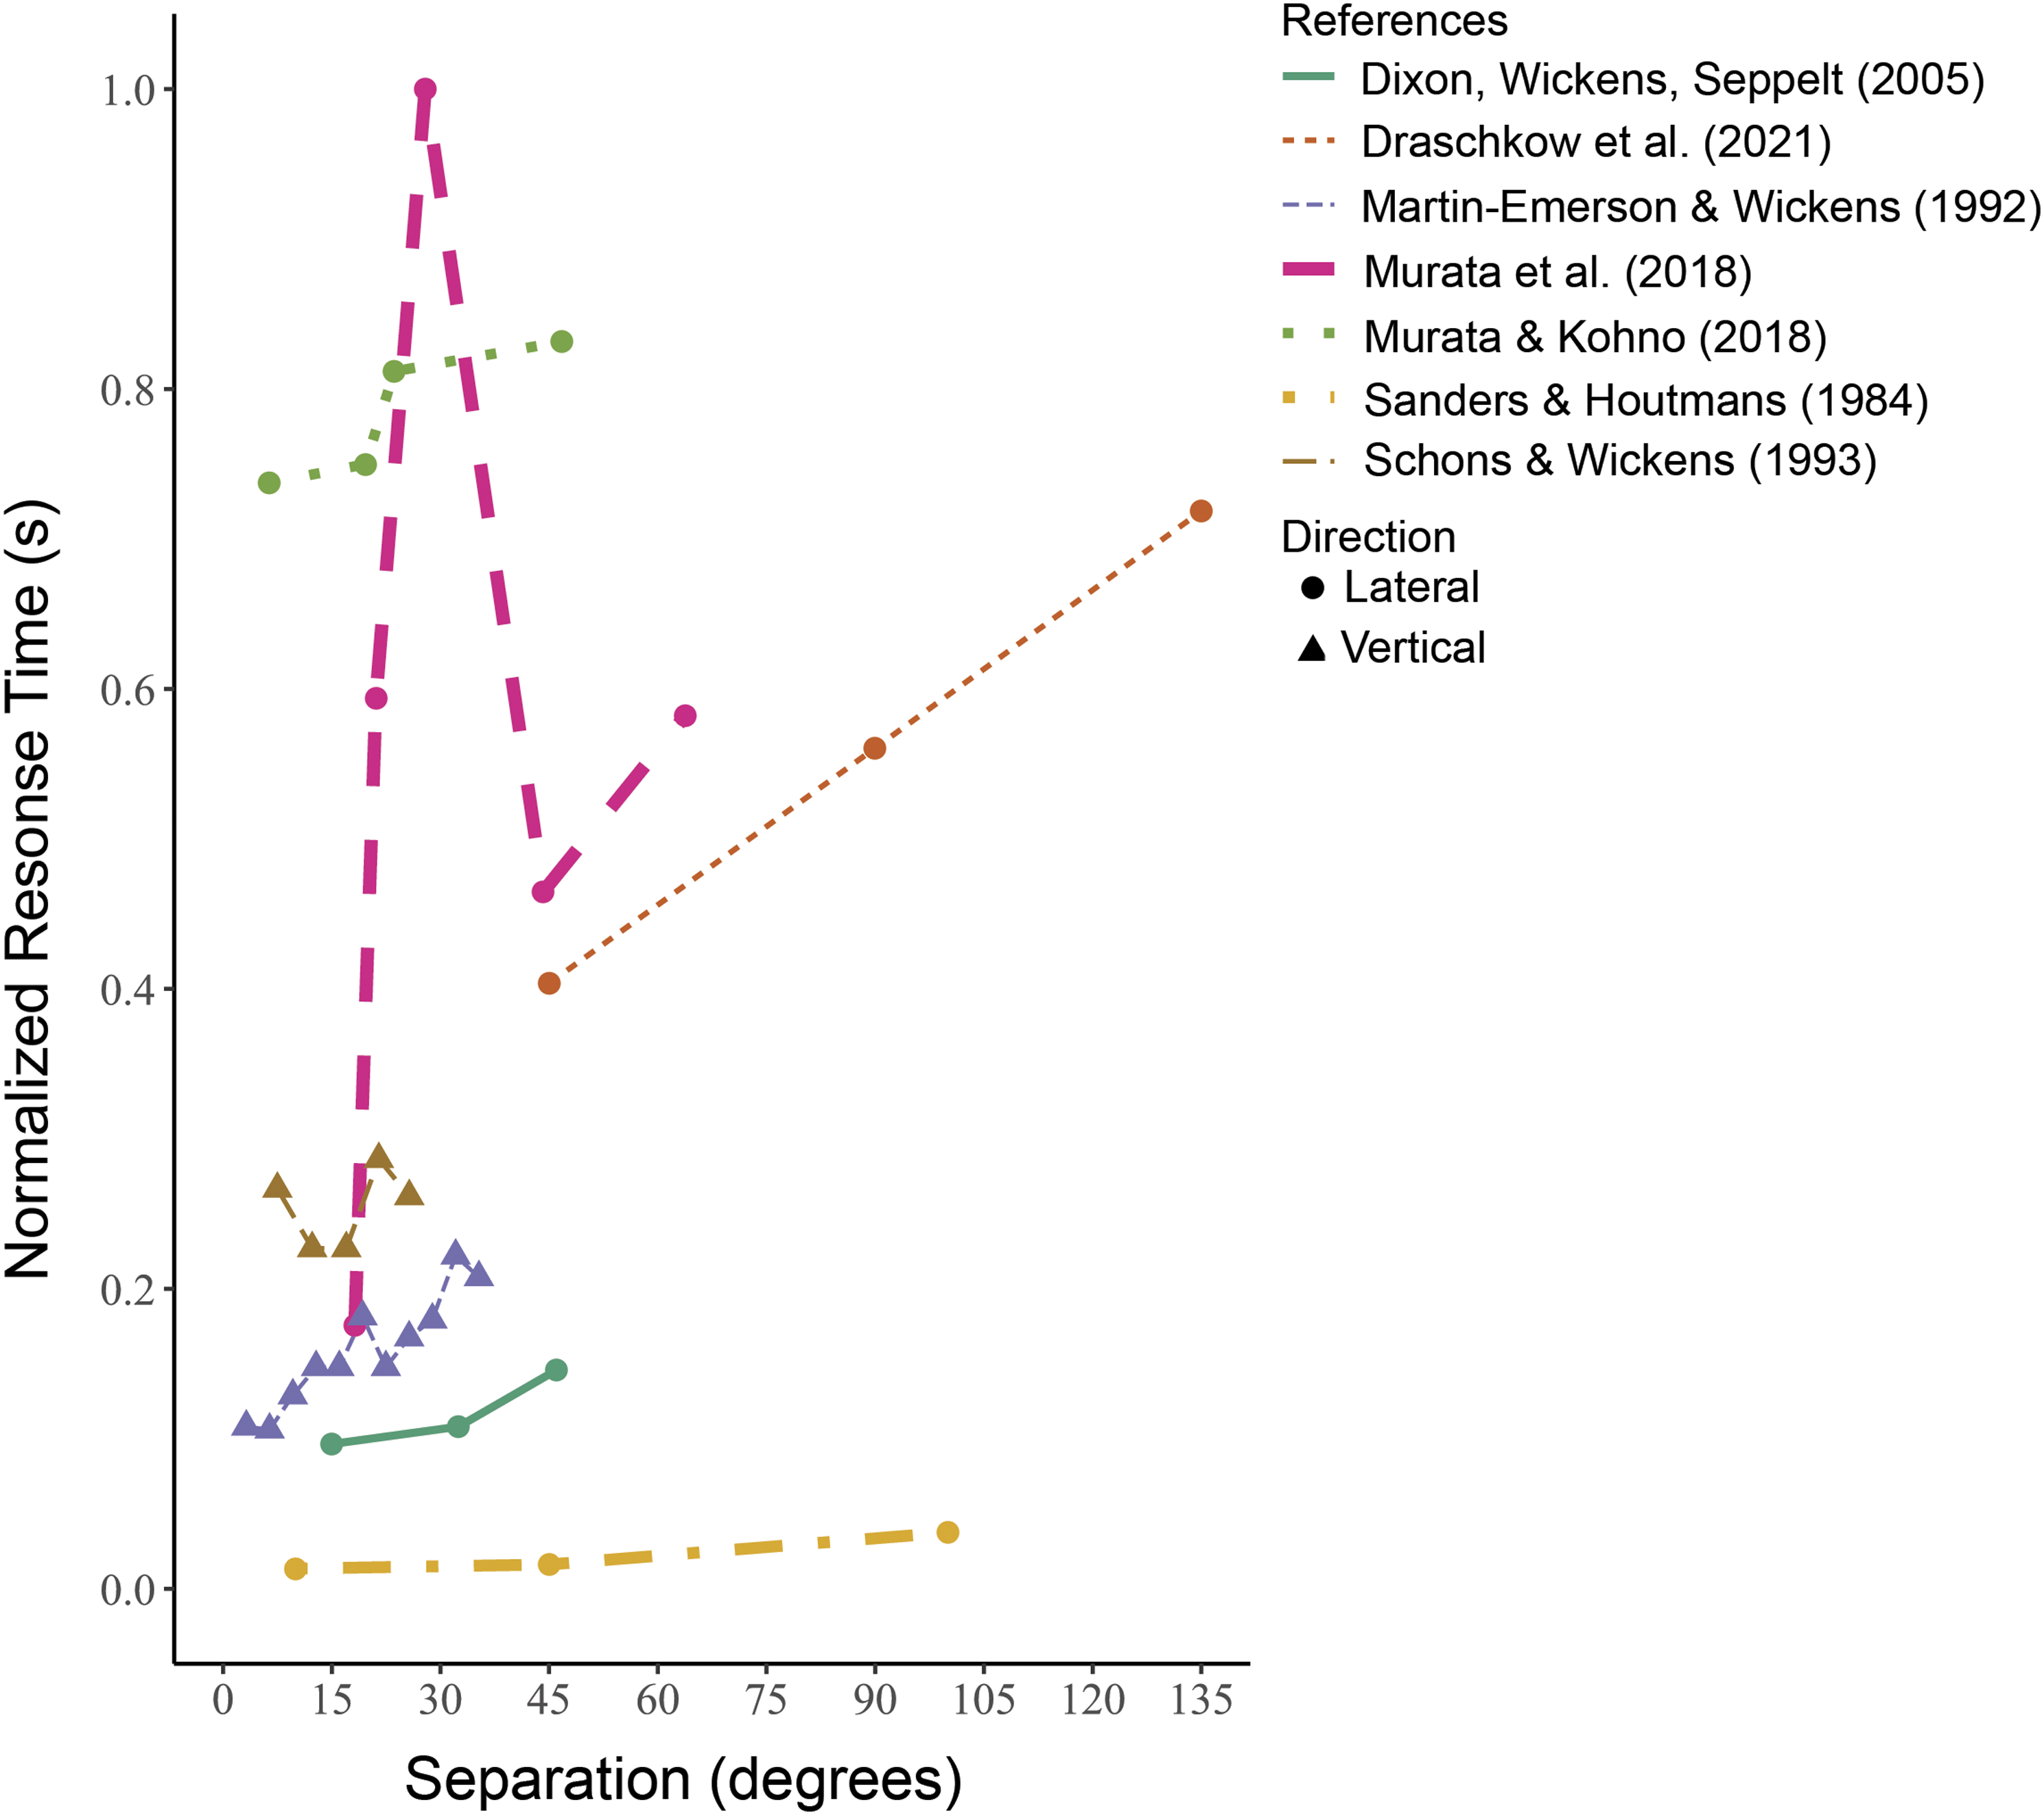
We investigated how error would increase with greater VAS, as insufficient visual scanning may prevent information from reaching foveal vision to obtain sufficient resolution. Decreased visual acuity can result in errors or misinterpretation, especially when information requires discrimination (i.e., distinguishing specific number values or words). Data equivalent to Figure 2, for standardized error, are presented in Figure 3. These data again show the generally increasing visual trend in error as VAS increases. However, there is inconsistency among the visual trends. Concerning the nonlinearity, the evidence for an accelerating visual trend is quite limited similar to response time, with only one study (orange dotted line) at lower visual angles (<25), indicating a shallower slope than the collective visual trends of other studies at higher angles. This study appears to suggest a discontinuity at around 30°. A meta-summary of additional standardized measures (error, effort) as a function of lateral (circles) and vertical (triangles) display separation. Colors and line types correspond to different experiments for the listed reference, all of which used spatial tasks.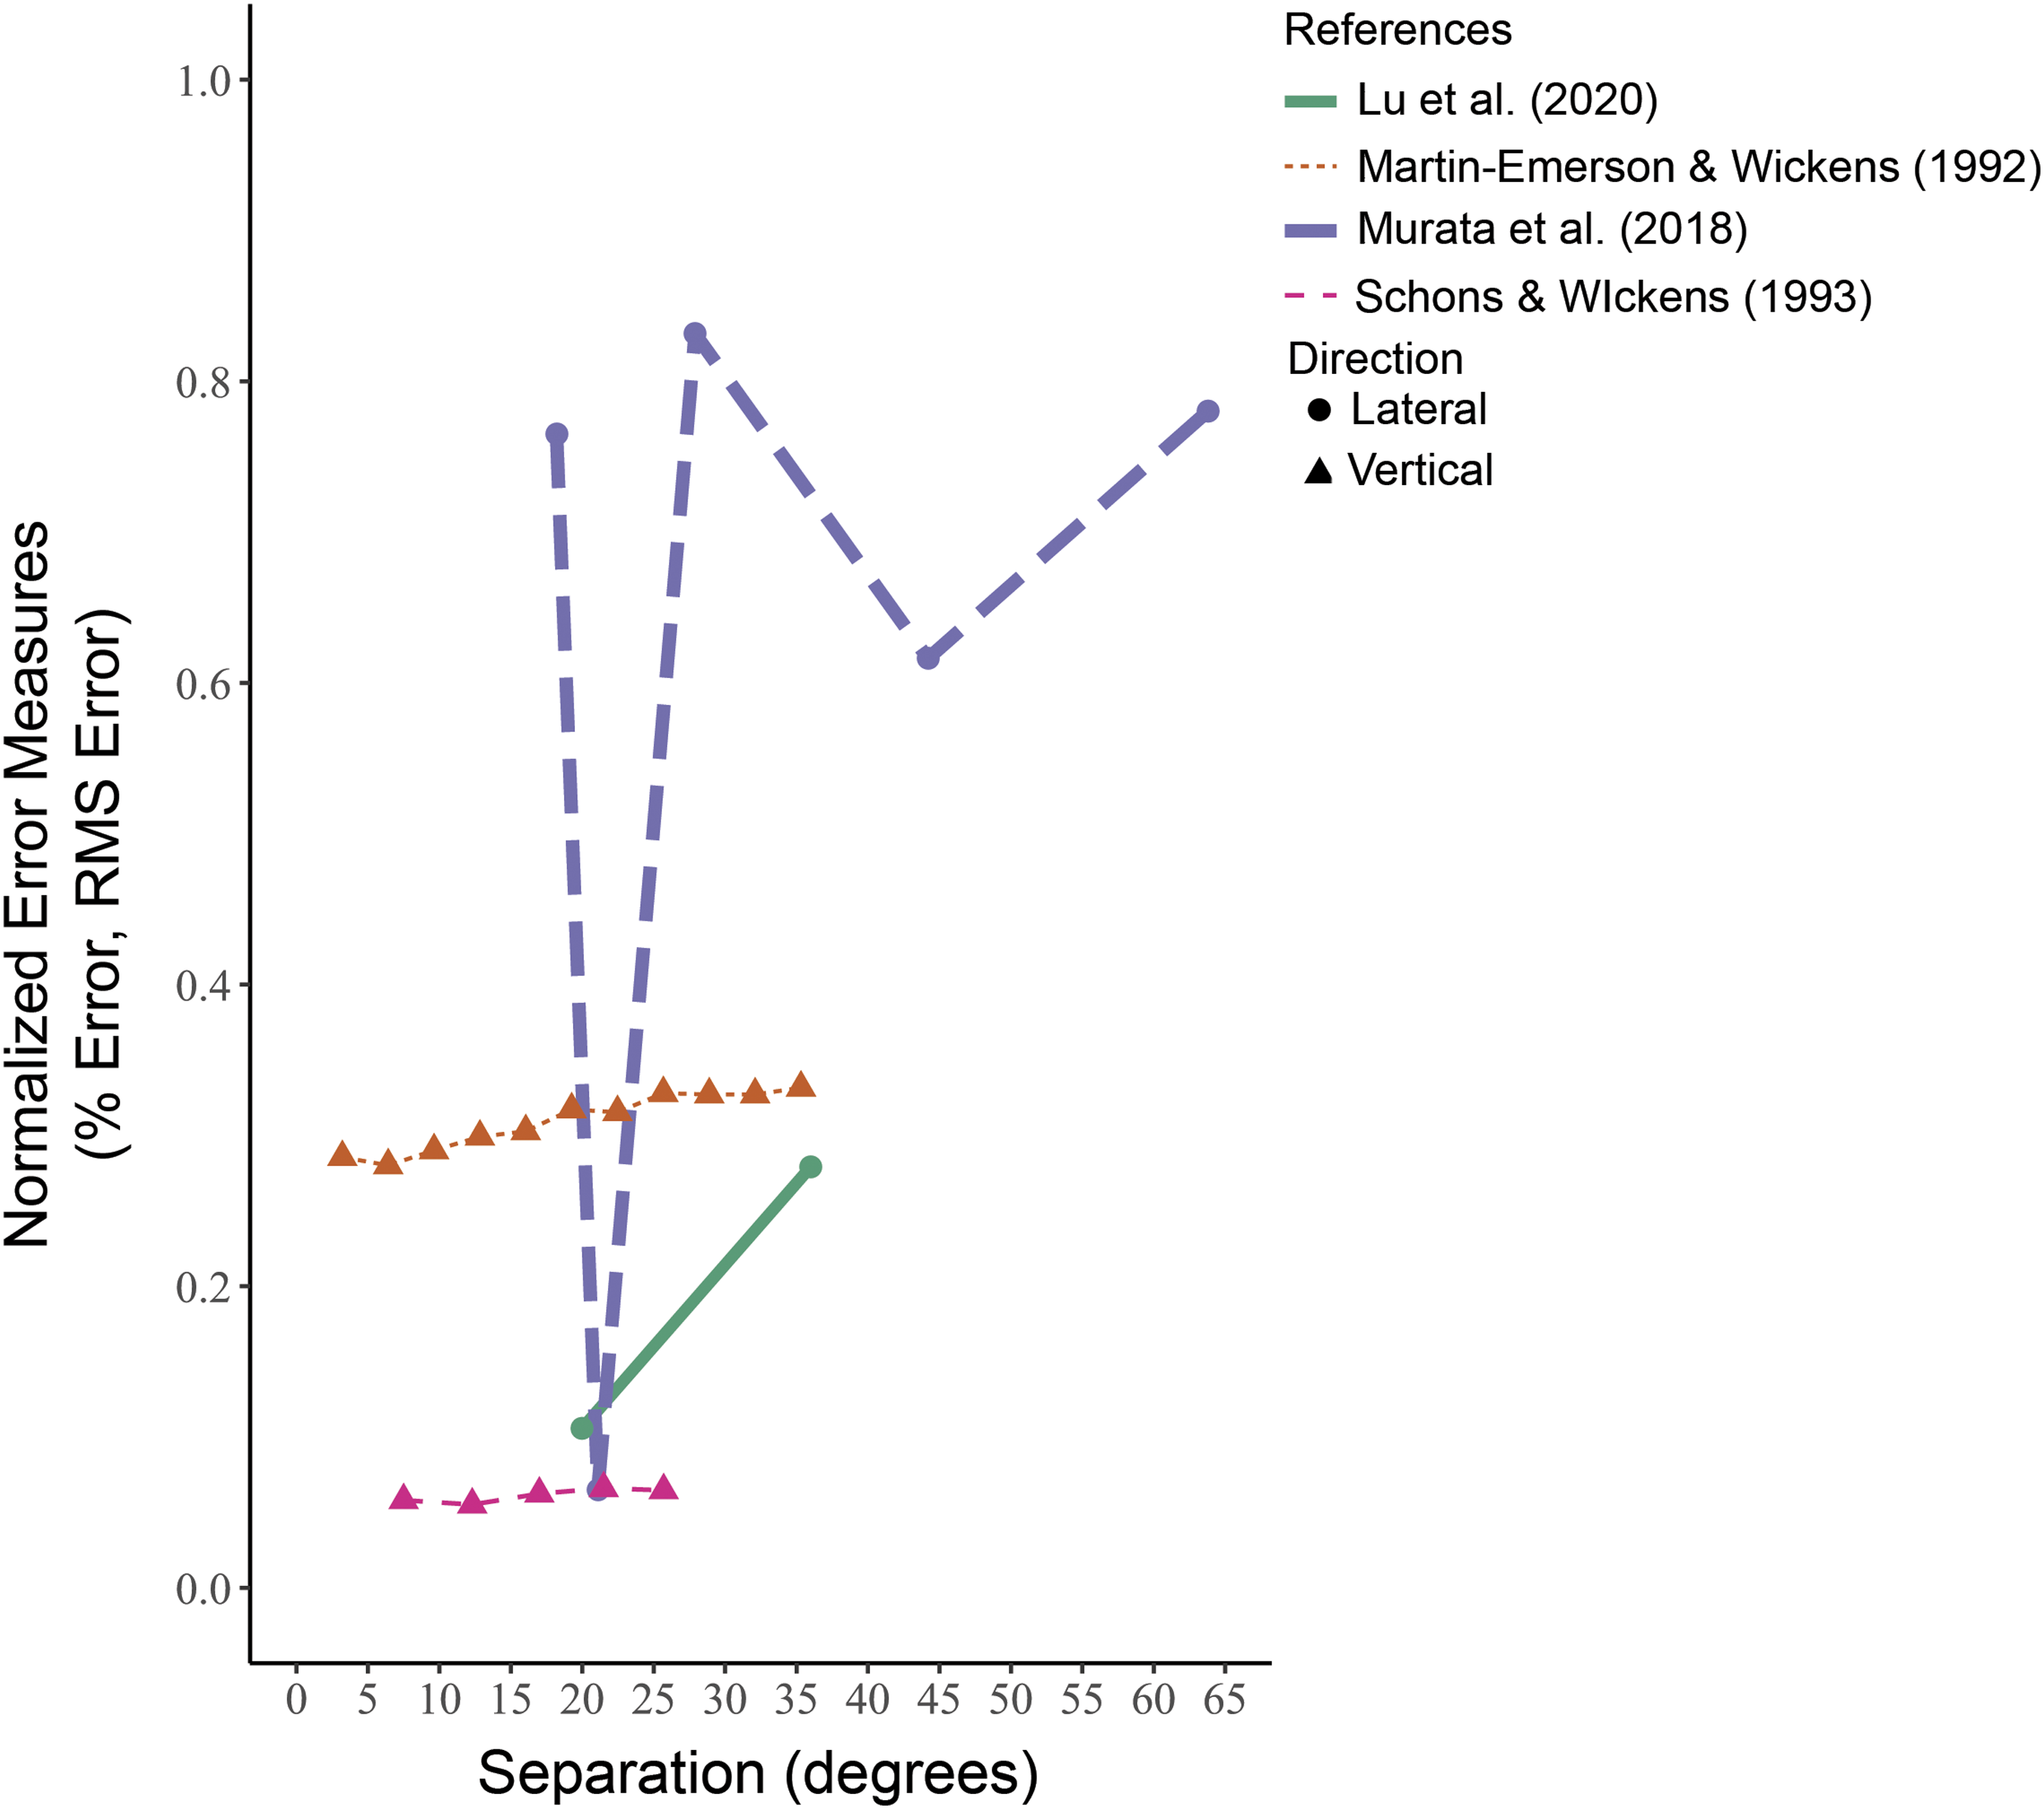
Finally, two experiments by Kim and colleagues (2010) assessed the relative contribution of head versus eye movements with increasing VAS instead of performance measures. Both studies indicated a distinctly linear trend from 0 to 50°, as well as considerable individual differences. The former effect suggests that there is not a substantially greater increase in effort as the head field is entered. The individual differences suggest that there are differences in how much “discomfort” a person is willing to tolerate with very eccentric eye movements before it becomes more comfortable to make a small head movement.
Overall, these findings suggest inconsistent effects of VAS across studies. However, two other variables that can modify the prototypical curve in Figure 1 include task type and the axis of spatial displacement. Recall that integration tasks can impose a load on working memory, which could amplify the costs of increasing VAS, and therefore predict a greater performance cost (i.e., steeper slope). Furthermore, whether the information was displaced laterally (left-right) or vertically (up-down) may impact performance differently as VAS increases. Figures 2 and 3 indicate few differences between those studies that have employed lateral versus vertical displacement, but they do hint at a greater cost for vertical movement. Only Wickens and colleagues (2005) and Kim and colleagues (2010) examined both vertical and lateral dimensions within the experiment, but the latter did not measure performance. Wickens and colleagues (2005) found that equivalent VAS on the lateral and vertical axis imposed a greater performance cost on the vertical axis, a finding consistent with the greater loss of acuity along the vertical than along the horizontal axis (Abrams et al., 2012; Becker, 1991).
Aims and Hypotheses
The aim of the present work is to identify the performance and effort functions as VAS increases by collectively examining response time, accuracy, and the direct measure of IAE via neck rotation in a single study. In doing so, we can examine the extent to which the effort of such rotation mitigates the predicted performance costs at larger visual angles. We examine this issue across five different levels of VAS. Results from prior studies, visualized in Figures 2 and 3, provide only a hint of the accelerating curve predicted by the original eye-field versus head-field distinction (Sanders & Houtmans, 1984).
We also examine the two important moderating influences on the VAS function (Figure 1). First, as predicted by the proximity compatibility principle, is the function steeper or higher when information integration, a task demanding working memory, is required when moving attention from one source to another? Second, is the function different for lateral versus vertical attention movement? The latter is an issue not previously examined within a single experiment that has measured both performance and head movements.
We employ numeric tasks in which the high resolution of foveal or near foveal vision is required. In Experiment 1, we tested the effect of display separation (i.e., increasing VAS) on performance for a computational integration task and a focused attention task presented on a desktop computer (2D flat panel display). To examine whether findings generalize to an HMD, Experiments 2 and 3 were carried out in the lateral and vertical dimensions, respectively, using an AR-HMD. Three hypotheses are proposed.
The first hypothesis predicts a decrease in performance for both task types as VAS increases (H1a) and that this will reflect a nonlinearity between the eye and head field depicted in Figure 1 (H1b). The examination of head movements will provide a better understanding of where the boundary between the eye and head field is in terms of VAS.
The second hypothesis predicted that the integration task will be harmed by display separation more than a focused attention task (H2a) and that the IAE functions (see Figure 1) will reflect a greater cost in performance (i.e., steeper slope with increasing VAS) for an integration than for a focused attention task (H2b). This is grounded in the general prediction of the proximity compatibility principle that information integration is disrupted more by the cognitive effort of moving attention to access information because the task requires holding information in working memory.
The third hypothesis (H3a) predicted that vertical displacement (Experiment 3) will induce a greater cost to performance than lateral displacement (Experiment 2), in part because of the reduced peripheral acuity in the vertical dimension (Abrams et al., 2012; Becker, 1991), and because of the greater performance costs associated with the vertical dimension observed by Wickens and colleagues (2005). We also hypothesize a greater cost of upward than downward head movement (H3b) because of reduced visual acuity in the upper visual field (Abrams et al., 2012).
Across all experiments, we were interested in the extent to which head movements mitigated decrements in accuracy. Collectively, we anticipate that the results of these experiments will establish the extent to which there are benefits of an HMD compared to a separated platform (as a function of where that platform is viewed) and assess any costs of moving HMD information farther into the periphery as viewed in “glanceable AR” (Lu et al., 2020).
EXPERIMENT 1
We examined the cost of increasing VAS (a.k.a., display separation) measured in visual angle for two tasks using a flat panel display. Participants either focused attention on a number presented at an increasing degree of separation from an initial fixation point or integrated two different numbers by computing their difference, which were located at an increasing degree of separation from each other.
Method
Participants
Twenty-five students from Colorado State University participated in the experiment. Ten participants volunteered without compensation and 15 participants enrolled in an introductory psychology course received course credit as compensation for completing the experiment. All participants had self-reported normal or corrected-to-normal vision. This and all other experiments were approved by the university’s Institutional Review Board.
Experimental Design
Experiment 1 was a 4 (VAS: 2, 16, 32, 40°) × 2 (task: focused attention, integration) within-subject design.
Stimuli and Apparatus
All stimuli were presented on a 23" monitor with a screen resolution of 1920 by 1080 pixels. Participants were seated at a viewing distance of approximately 70 cm from the display to ensure a maximum visual angle of approximately 40° from the left to the right side of the screen. The stimuli and experiment were created and presented in E-Prime 3.0 (Psychology Software Tools, Pittsburgh, PA). The experiment consisted of two tasks. The focused attention task required participants to fixate on a 2-digit number presented on the display and to indicate whether the number was less than or greater than a constant 2-digit number. The constant 2-digit number was not presented during each trial but was provided in the instructions before both the practice and experimental trials. The integration task required participants to mentally subtract two numbers from each other and indicate whether the absolute difference between the two numbers was less than or greater than a constant 2-digit number. All stimuli were presented on a white background.
As depicted in Figure 4 (left), for the focused attention task, a red fixation cross was presented on the left side of the screen, and a single 2-digit number was subsequently presented randomly in the lateral rightward direction at one of four VASs (2°, 16°, 32°, 40°) from the fixation cross. The red fixation cross and the numbers were displayed horizontally across the middle of the screen. Each trial began with a red fixation cross located at the left side of the screen for 3 s. Occasionally, the fixation cross jittered back and forth at various frequencies during each trial (i.e., zero, one, or two times). As a secondary task, participants were instructed to continuously monitor the fixation cross and press the spacebar every time the cross jittered. This continuous monitoring task ensured that participants initially fixated on the left side of the screen prior to looking at the 2-digit number that appeared at one of four VASs from the fixation cross. The response to the focused attention stimuli used keys “Q” for “less than” and “P” for “greater than” 45. A static illustration of Experiment 1 depicting a single trial for the focused attention task (left) and the computation integration task (right). In the top two images, information was separated by 2°. In the bottom two images, information was separated by 40°. For the focused attention task, the straight line “+” represents the continuous monitoring jitter task. Below the display boundary is a representation of where each level of separation could be located relative to the desktop display.
For the integration task (Figure 4, right), “XX” appeared on the left side of the screen to ensure that participants fixated at the left side of the screen. The first 2-digit number replaced this “XX,” and 3 s later a second 2-digit number was presented at one of the four rightward VASs (2°, 16°, 32°, 40°) from the first number. Participants were instructed to mentally calculate the absolute difference between the two numbers. Using the same key presses as above, participants indicated whether the difference was “less than” or “greater than” 37.
Procedure
Participants gave informed consent and were seated in front of a computer. They were given instructions for the tasks, and told not to move the chair, or lean forward. Each task started with practice trials that provided auditory feedback to the participant before the main test trials. Participants were instructed to make all responses as rapidly and accurately as possible. We emphasized that they should focus on both speed and accuracy because both were equally important. During the experiment, head movements were recorded by the experimenter. One head movement was recorded anytime the participant moved their head in a single direction (i.e., looking to the right and then back to the left counted as two head movements).
Participants completed two cycles of the two tasks. For the first cycle, each task consisted of 16 practice trials and 56 test trials for a total of 144 trials. For the second cycle, each task consisted of 56 test trials for a total of 112 trials. The entire experiment consisted of 256 trials. The tasks were counterbalanced. For each task, the presentation order of the level of display separation (VAS) was blocked, and trials within each level of display separation were randomized. For example, participants completed all 14 trials when information was presented at 16° of separation and the trials were presented in a random order. There was an optional 60 s break between each task. The entire experiment lasted approximately 30 min.
Results
Outlier criteria were based on whether the response time for individual trials for each participant was 1.5 times beyond the upper bound of the interquartile range (IQR) or below 300 ms for each task. The lower bound criteria were based on physiological limitations concerning the speed at which a person can process and respond to stimuli. Altogether 281 trials were removed from the analysis, or 5% of the total data points. We note that the results including all data points converged to similar statistical findings below. However, for the sake of space, we choose to report the findings after outliers were excluded.
Data were analyzed in R using one-way repeated measures ANOVAs to test whether there was a decrease in performance for both tasks as VAS increased (H1). For this and all other experiments, we corrected for the positively skewed response time data by log-transforming response time. Analysis on the untransformed data revealed essentially the same effects. Data for this and the following experiments are plotted in untransformed response time to assist in the visual interpretation of the data.
For the focused attention task, the effect of VAS on response time and percent error is shown in the solid blue lines at the bottom of the left and right panels of Figure 5. The ANOVA showed a statistically significant effect of VAS on the log-transformed response time, F (3, 72) = 91.02, p < .001, ηp2 = .79. Response time increased as visual angle increased. There was no statistically significant effect of VAS on percent error, F (3, 72) = 1.31, p = .28, ηp2 = .05. Experiment 1: The mean response time (left) and mean percent error (right) plotted as a function of VAS (degrees) for the focused attention task (circles solid line) and integration task (triangles dashed line). Error bars represent one standard error of the mean.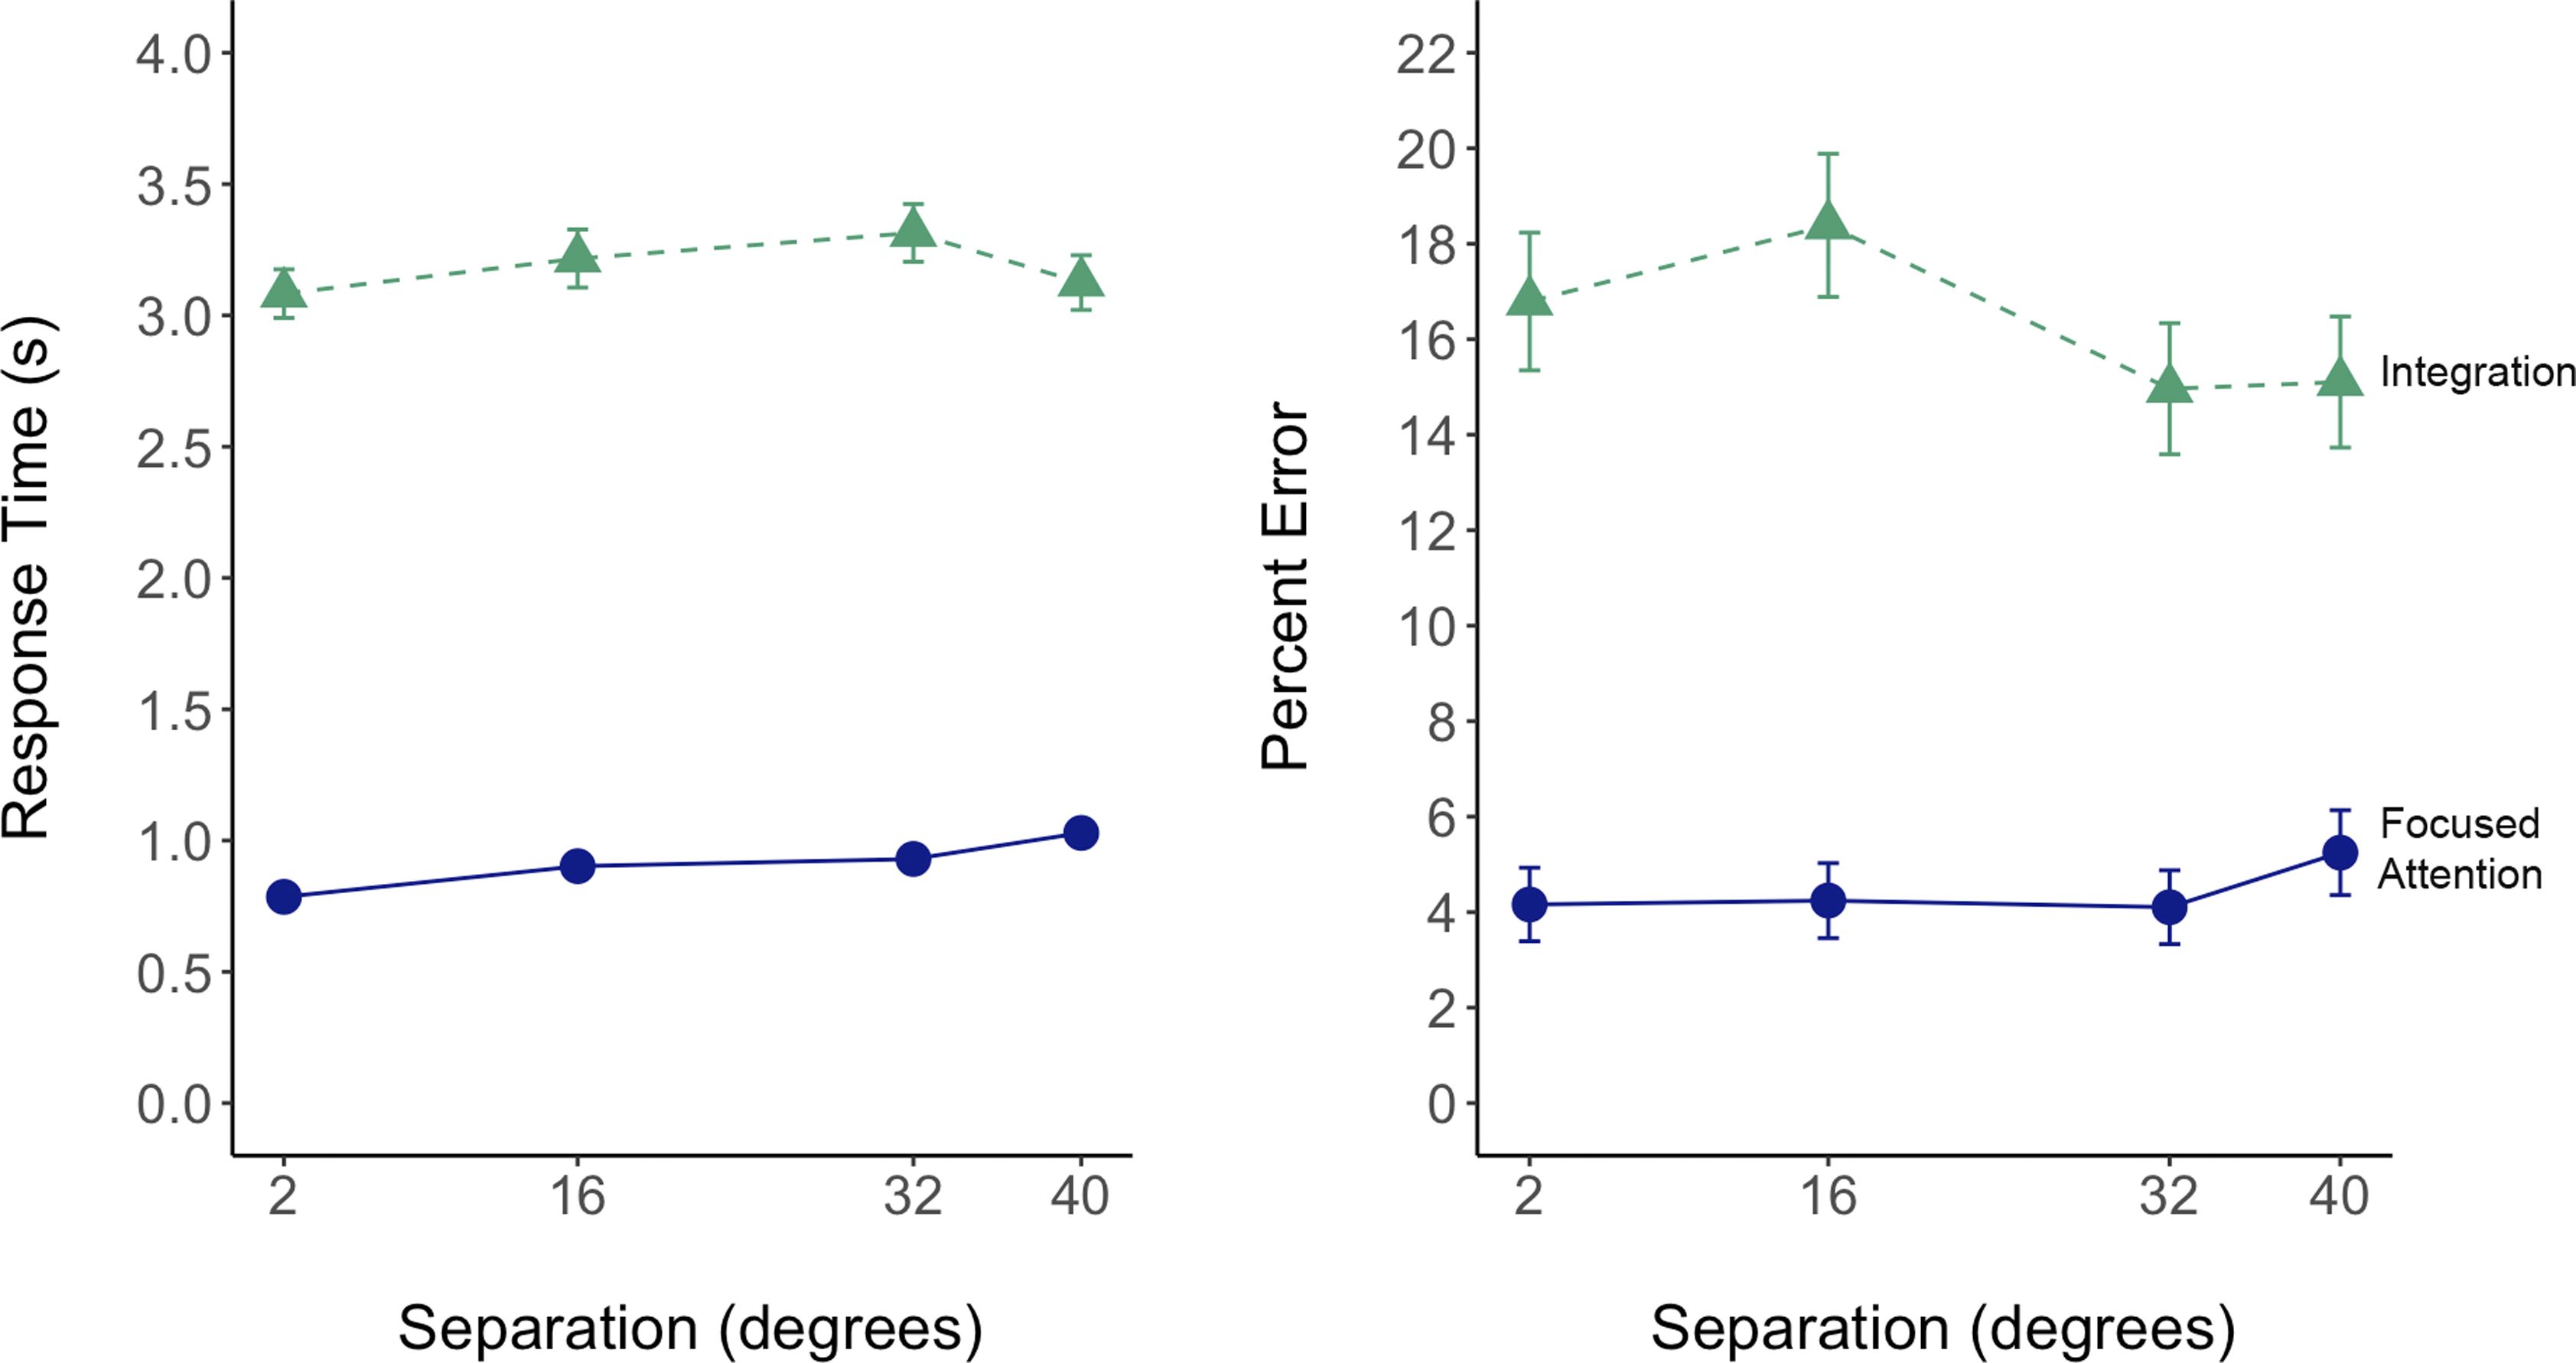
Data from the continuous monitoring secondary task suggested that participants kept their fixation at the far-left side of the display at the start of each trial. A one-way repeated measures ANOVA showed no statistically significant effect of VAS on jitter response time, F (3, 72) = 1.28, p = .29, ηp2 = .05, or accuracy, F (3, 72) = 1.00, p = .40, ηp2 = .04. Overall, participants were 85% accurate during the secondary task for all VAS indicating they did not differentially tradeoff performance in the primary task with accuracy of the secondary task.
For the integration task, the effects of VAS on response time and percent error are shown by the dashed green lines near the top of Figure 5. The ANOVA showed no statistically significant effect of VAS on the log-transformed response time, F (3, 72) = .86, p = .47, ηp2 = .03, nor on percent error F (3, 72) = 1.63, p = .19, ηp2 = .06.
Next, we conducted a 2 (task) x 4 (VAS) repeated-measures ANOVA to examine whether the data supported our second hypothesis: that there would be a greater performance cost for the integration task than the focused attention task (H2a), and this cost would be amplified as VAS increases (H2b). For the log-transformed response time, the ANOVA revealed a statistically significant increase with increasing VAS, F (3, 72) = 15.72, p < .001, ηp2 = .40 (described above). Participants also had significantly longer response times with the integration task, F (1, 24) = 109.90, p < .001, ηp2 = .82. In addition, there was a significant interaction between VAS and task, F (3, 72) = 19.26, p < .001, ηp2 = .45. Response time decreased at the furthest visual angles for the integration task but continued to increase for the focused attention task. This contradicts our prediction (H2b) that participants would take longer at greater visual angles with the more difficult integration task compared to the focused attention task.
For the error data, a two-way ANOVA revealed that percent error was much higher in the integration task, F (1, 24) = 25.07, p < .001, ηp2 = .51. There was no statistically significant effect of VAS, F (3, 72) = .65, p = .58, ηp2 = .03, nor a significant interaction between VAS and task, F (3, 72) = 2.77, p = .05, ηp2 = .10.
Lastly, we examined whether head movements mitigated performance decrements as eccentricity increased. Head movements were averaged across each block of VAS. These data are shown in Figure 6. For the focused attention task, a one-way ANOVA showed that head movements significantly increased as VAS increased, F (3, 72) = 13.55, p < .001, ηp2 = .36. The pairwise comparison revealed no statistically significant increase in number of head movements between 2° and 16°, t (24) = −1.00, p = .33, d = .28, or between 32° and 40°, t (24) = −1.39, p = .18, d = .24. However, there were significant increases between 16° and 32°, t (24) = −4.15, p < .001, 95% CIs [−2.48, −.84], d = .62, and between 16° and 40°, t (24) = −4.42, p < .001, 95% CIs [−3.46, −1.26], d = 1.02. This would seemingly indicate the head field was entered somewhere beyond 16°. Experiment 1: Mean number of head movements (per block) as a function of VAS (degrees) for the focused attention task (circles solid line) and integration task (triangles dashed line). Error bars represent one standard error of the mean.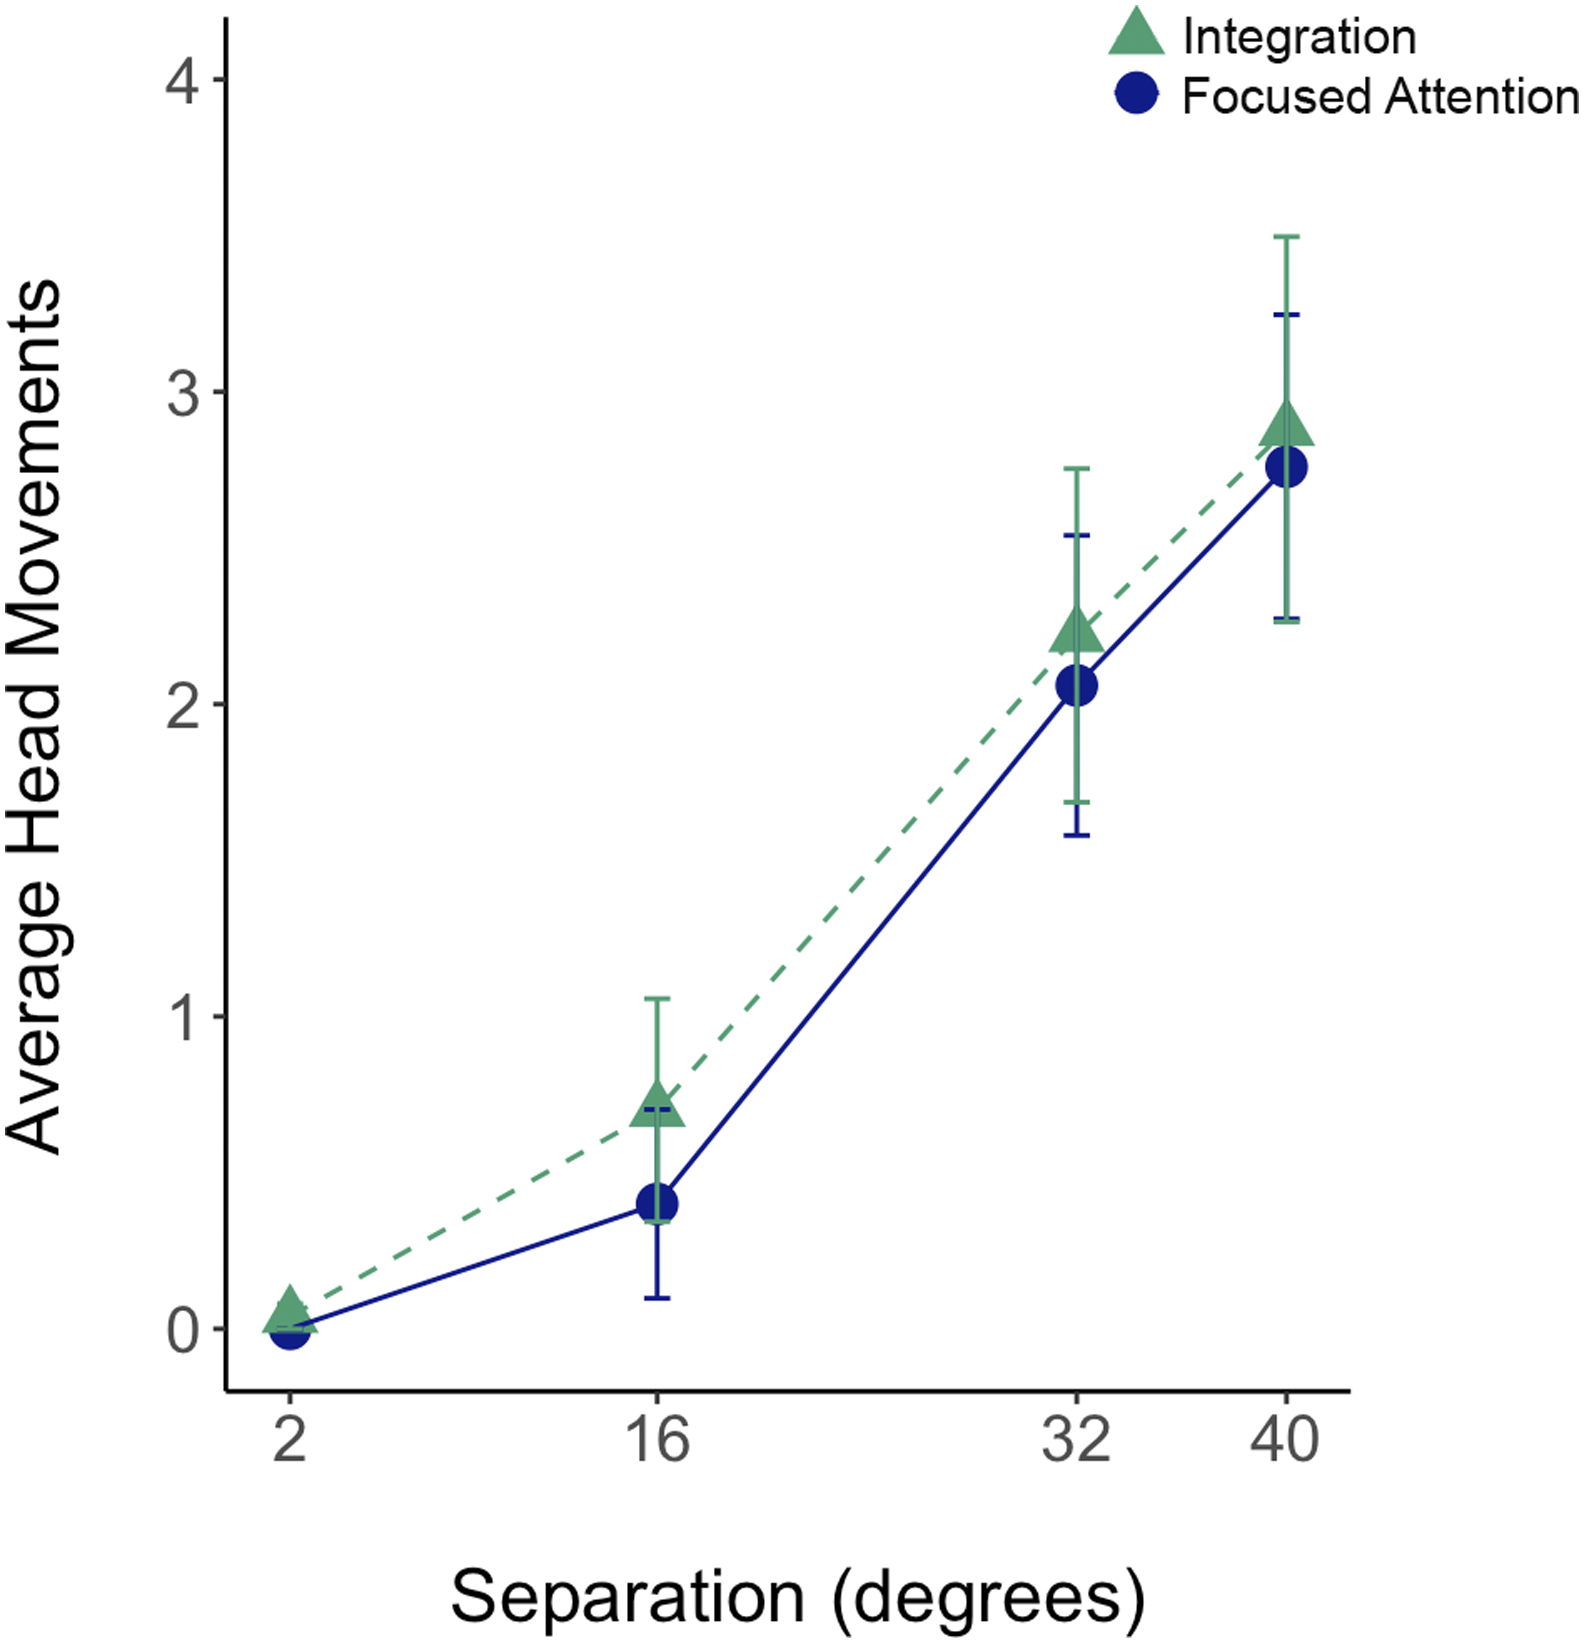
For the integration task (see Figure 6), there was a statistically significant increase in the number of head movements as VAS increased, F (3, 72) = 10.34, p < .001, ηp2 = .30. The pairwise comparison revealed no statistically significant difference between 2° and 16°, t (24) = −1.63, p = .12, d = .43. However, head movements increased as VAS increased from 16° to 32°, t (24) = −3.06, p = .01, 95% CIs [−2.54, −.59], d = .53, from 16° to 40°, t (24) = −3.32, p = .003, 95% CIs [−3.53, −.83], d = .67, and from 32° to 40°, t (24) = −2.26, p = .03, 95% CIs [−1.26, −.10], d = .18. The data again suggest that the head field enters within the range of 16° and 32°.
An ANOVA combining the focused attention and integration task was conducted for head movements and revealed, as expected, a statistically significant effect of VAS, F (3, 72) = 17.63, p < .001, ηp2 = .42. There was no statistically significant effect of task, F (1, 24) = .19, p = .67, ηp2 < .001, and no significant interaction, F (3, 72) = .06, p = .98, ηp2 < .01.
Comments made by some participants after the experiment indicated that there may have been some use of simple heuristics during the integration task (e.g., rounding), which often gave the correct response but may have bypassed the intended heavy processing requirements of mental subtraction. Using such a heuristic would reduce the working memory demands intended by the integration task. Consequently, we chose to repeat the experiment with a Boolean logic integration task whose working memory demand could not be readily circumvented by a heuristic. For this task, participants compared whether a number and a letter presented at various distances from each other met specific true/false criteria. To the extent that full processing was now required of both stimuli, we anticipated observing a more profound effect of VAS when integration was required. For the sake of space, we do not include the details of this study, but the results (N = 27) were essentially identical to those of the computation integration task above. This suggests the current findings were not a function of participant strategies during the task. Therefore, we chose to continue using the computation integration task for the remaining experiments.
Discussion
Experiment 1 examined the effect of display separation on performance for a focused attention task and a computation integration task to quantify the cost of increasing VAS. Aligning with prior work, we found partial support for our prediction that performance will degrade with increasing visual angle (H1a): response time increased significantly as display separation increased, aligning with the expected effect for the focused attention task. However, percent error did not increase significantly with VAS. The expected nonlinearity (H1b) for both response time and percent error was not observed because there was no greater increase in either performance measure from 32° to 40° of separation. While the integration task was more difficult, as indicated by longer response time and lower accuracy compared with the focused attention task (H2a), we did not find the expected interaction between display separation and the type of task. These results did not conform to our predictions that the performance cost for the more difficult integration task would be amplified by increasing visual angle (H2b). However, the head movement data provides a plausible explanation that may account for the lack of the expected performance decrement as eccentricity increased.
In this regard, accuracy was preserved rather than decreased as predicted by Figure 1 likely due to the increasing number of head movements at 32° and 40° of separations. At 16° of separation, we assume, given the lower number of head movements, that peripheral vision was used to look at the second number. Such exploitation of peripheral vision would likely limit visual resolution of the number and reduce accuracy (Figure 5); (McKee & Nakayama, 1984). Head movements became more necessary at further degrees of eccentricity (32° and 40°) to bring the second number into foveal vision, and therefore head movements likely preserved accuracy.
EXPERIMENT 2
An augmented reality HMD (AR-HMD) can place information within the eye, head, and body fields. Using an AR-HMD, Experiment 2 evaluated the impact of increasing VAS for the same two tasks from Experiment 1, extending separation to a wider visual angle. Here, we assess to what extent our findings from Experiment 1, which used a 2D flat panel display, generalize to an AR-HMD and the magnitude of the cost of VAS for an AR-HMD compared to a traditional desktop display.
Method
Participants
Twenty-six students from Colorado State University participated in the experiment using the same criteria for selection as those used in Experiment 1. No students from Experiment 1 participated in Experiment 2.
Experimental Design
Experiment 2 was a 4 (VAS: 2°, 16°, 32°, 50°) × 2 (task: focused attention, integration) within-subject design.
Stimuli and Apparatus
Participants completed the experiment using an AR-HMD (HoloLens 2). The HoloLens 2 (HL2) is a mixed-reality headset developed by Microsoft Corporation that renders interactive 2D and 3D objects with an optical-see-through holographic lens. The HL2 uses cameras and sensors to overlay and merge digital content onto the physical world, thereby creating new environments that contain physical and digital objects that the user can see and interact with. The HL2 has a total lateral field of view (FOV) of 43° and a total vertical FOV of 29°. The experiment was developed using a Universal Windows Platform (UWP) application. This experiment was presented with a virtual display which was viewed against the surface of a wall. Participants sat approximately 75 cm away from the wall to ensure the maximum lateral visual angle of the virtual display was 50°. The tasks were the same as in Experiment 1 except that the four VASs were 2°, 16°, 32°, and 50°. Since the total maximum lateral visual angle of the AR-HMD display is 43°, this meant that participants were required to move their head to see information located at 50° on the virtual display (see Figure 7). All other locations were within the 43° FOV of the device. A static illustration of Experiment 2 depicting a single trial for the computation integration task where the two numbers are separated by the maximum visual angle (50°). The dashed line represents the physical field of view of the AR-HMD and the solid line represents the virtual display area.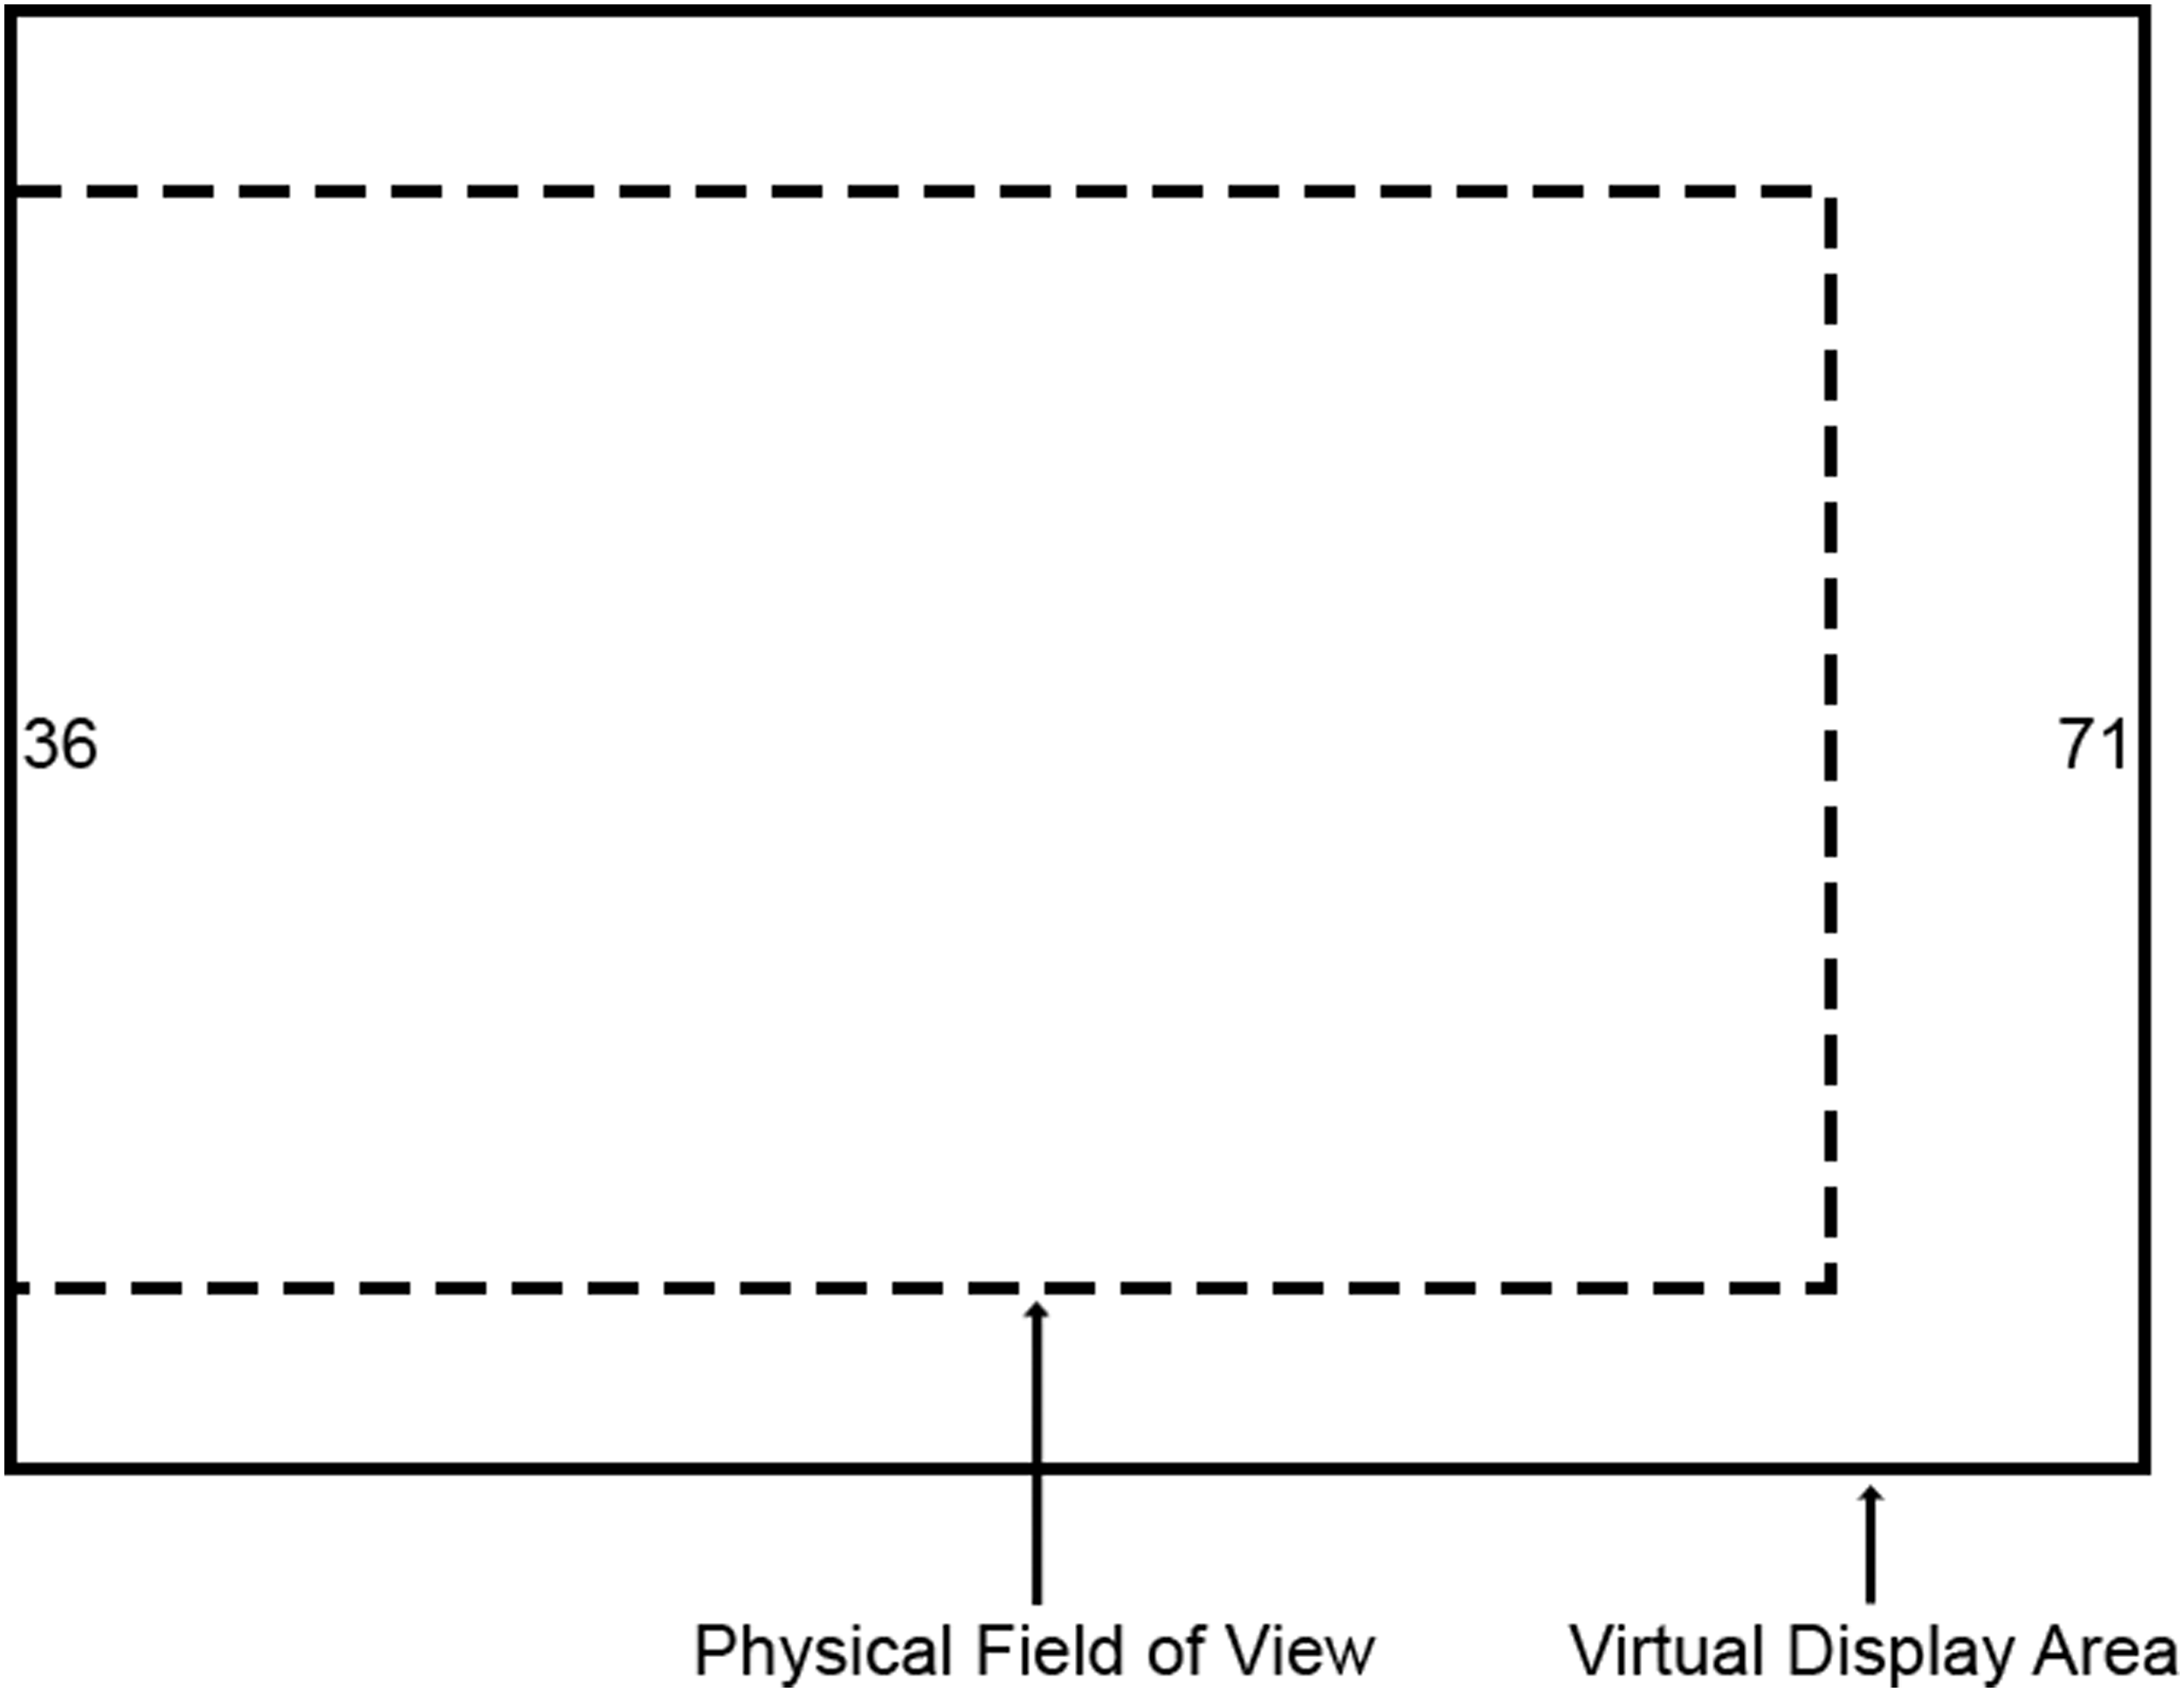
Procedure
All participants read a consent form and agreed to the information before putting on an AR-HMD and sitting in front of a wall. Instructions for the focused attention task (including the secondary continuous monitoring task) and the integration task were the same as in Experiment 1, except participants were told that one number would sometimes appear out of view, and they would have to turn their head rightward to see the number. The experimental design and distribution of trials were the same as Experiment 1.
Results
Data from one participant was removed because that participant had chance accuracy for all levels of VAS. Additional outlier criteria were the same as in Experiment 1. Approximately 6% of the data points from both tasks (168 trials from the focused attention task and 169 trials from the integration task) were removed. Results without excluding these trials were essentially identical to those described below.
We conducted one-way repeated measures ANOVAs to examine if performance decreased as visual angle increased (H1). The effect of VAS for the focused attention task is shown by the blue solid line in Figure 8. For log-transformed response time, the ANOVA showed no statistically significant effect of VAS, F (3, 72) = 2.10, p = .10, ηp2 = .08. For error rate, there was no statistically significant effect of VAS, F (3, 72) = .96, p = .42, ηp2 = .04. Hypothesis 1 was disconfirmed for both measures. Experiment 2: Mean response time (left) and mean percent error (right) plotted as a function of VAS (degrees) for the focused attention task (circles solid line) and integration task (triangles dashed line). Error bars represent one standard error of the mean.
Response time and percent error for the continuous monitoring secondary task were analyzed the same way as in Experiment 1. Neither response time, F (3, 72) = .68, p = .57, ηp2 = .03, nor error, F (3, 72) = .27, p = .85, ηp2 = .01, were significantly affected by VAS of the primary task. Overall, participants had above chance accuracy (76% accurate) during the secondary task for all degrees of separation.
For the integration tasks, the effect of VAS on response time and percent error is shown by the green dashed line in Figure 8. There were no statistically significant effects of VAS for either log-transformed response time, F (3, 72) = .07, p = .98, ηp2 < .001, or percent error, F (3, 72) = 1.90, p = .14, ηp2 = .07.
A 2 (task) x 4 (VAS) repeated measures ANOVA on the log-transformed response time assessed whether there was a greater performance cost for the integration than the focused attention task (H2a), and whether this cost would be amplified as VAS increased (H2b). The ANOVA showed a 2.9 s slower response time for the more difficult integration task compared to the focused attention task, F (1, 24) = 180.60, p < .001, ηp2 = .88, thereby supporting that performance on the more difficult integration is slower than the focused attention task (H2a). Neither the effects of VAS, F (3, 72) = 1.30, p = .28, ηp2 = .05, nor the interaction between VAS and task type were statistically significant, F (3, 72) = .85, p = .47, ηp2 = .03, thereby failing to support the hypothesis that the cost in performance in the integration task was amplified by increasing visual angle (H2b).
A second ANOVA showed a significant mean increase in error of 13% (from 4% to 17%) for the integration task compared to the focused attention task, F (1, 24) = 29.1, p < .001, ηp2 = .55, supporting a greater cost in performance for the integration task (H2a). Neither the effect of VAS, F (3, 72) = 2.45, p = .07, ηp2 = .09, nor the interaction between VAS and task significantly impacted percent error, F (3, 72) = .87, p = .46, ηp2 = .04, thereby failing to confirm H2b.
As with Experiment 1, to help explain why there was no cost in performance, we examined the role that head movements played during each task by conducting a 2 (task) × 4 (VAS) repeated measures ANOVA. One participant only had partial head movement data and was excluded from the analysis. Head movement data from three other participants was excluded due to an incorrect experimental set up when running the participants. We also excluded the participant that was an outlier in the performance measures analysis. Figure 9 presents the mean number of head movements for both tasks. Experiment 2: Mean number of head movements (per block) plotted as a function of VAS for the computation integration task (triangles dashed line) and the focused attention task (circles solid line). Error bars represent one standard error of the mean.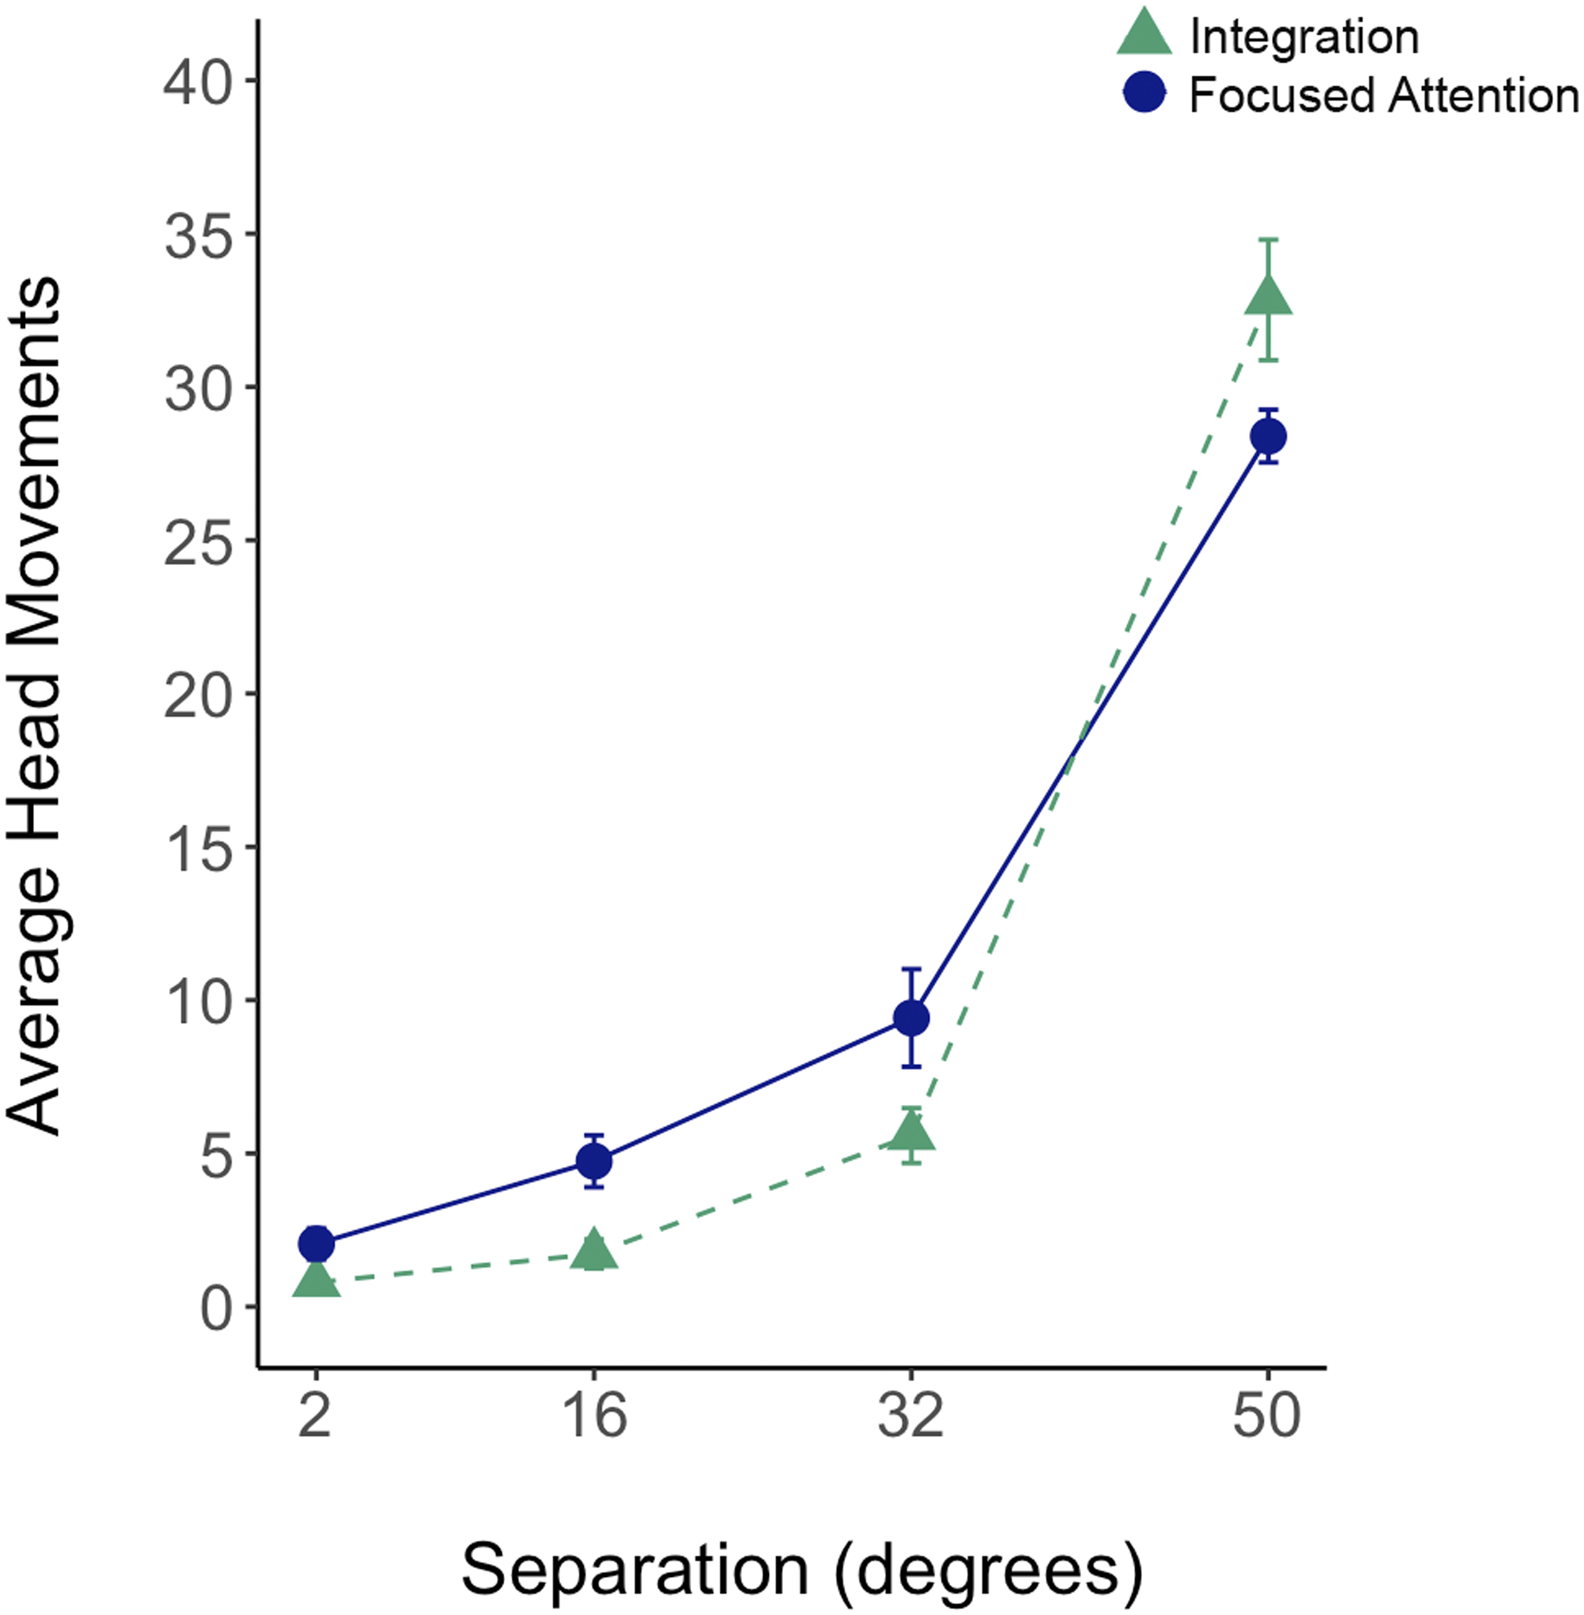
There was a statistically significant effect of VAS on head movements, F (3, 60) = 237.65, p < .001, ηp2 = .92. The number of head movements increased as visual angle increased, particularly from 32° to 50°, to be expected given that the latter condition was out of the initial FOV (i.e., not initially invisible). There was no statistically significant effect of task, F (1, 20) = .40, p = .53, ηp2 = .02. However, there was a statistically significant interaction between VAS and task, F (3, 60) = 6.71, p < .001, ηp2 = .25. This suggests that only when both stimuli cannot be seen simultaneously, do head movements increase disproportionately in the integration task, to compensate for its working memory demands.
To establish the statistical validity of the apparent nonlinear accelerating trend evident in Figure 9, we performed a quadratic regression analysis on nontransformed data collapsed across both tasks. The analysis yielded a significant quadratic effect, as well as the linear one. Furthermore, the quadratic model explained 87% of the variance (R2 = .87, F (2, 81) = 268.7, p < .001), whereas the linear model explained 72% of the variance (R2 = .72, F (1, 82) = 208, p < .001), suggesting that the data are better explained by the quadratic model. For the integration task, this could suggest that people relied more on peripheral vision when information was presented closer (16°) but due to the demands on working memory, they had to make more back and forth head movements at 32° and 50° compared to the focused attention task. These findings also support our claim that the head field appears to come into play at visual angles between 16° and 32°.
Discussion
When participants completed the two tasks presented on an AR-HMD, the results were relatively consistent with those found when presented on the flat panel display (Experiment 1). However, there were a few exceptions. First, while Experiment 1 did show an increasing cost in response time as visual angle increased for the focused attention task (Figure 5), Experiment 2 (Figure 8) showed no such increase. Second, the overall number of head movements at the largest visual angle was 11 times greater in Experiment 2 (Figure 9) than in Experiment 1 (Figure 6). Third, the frequency of head movements in Experiment 2 increased nonlinearly across the visual angles outside the eye-field, especially for the integration task. In contrast, they showed a much reduced, although still significant, increase across visual angles in Experiment 1. We note in Experiment 2 that the increase from 32° to 50° is because at least one movement is mandatory to bring the second stimulus into the field of view of an HMD. However, for the focused attention and integration task, the number of head movements were approximately 2 per trial (specifically, 2.04 and 2.34, respectively), which exceeds the mandatory single movement per trial. The increase for the integration task is greater likely due to its working memory requirements when compared to the focused attention task. In addition, the integration task also reveals the same accelerating increase from 2° to 32°, suggesting the head field is again entered above 16°. In Experiment 2, the large increase in head movements plausibly compensated for any loss of accuracy without imposing a penalty on response time.
EXPERIMENT 3
Experiments 1 and 2 examined increasing VAS in the lateral direction. In Experiment 3, we evaluated increasing VAS instead, in the vertical direction for the same two tasks using an AR-HMD. This axis direction contrast was examined because Wickens and colleagues (2005) had found a greater cost for vertical displacement than lateral, and because of differences in visual resolution across the two axes (Abrams et al., 2012; Wickens et al., 2016).
Method
Participants
Thirty students enrolled in an introductory psychology course at Colorado State University participated in the experiment using the same criteria for selection as those used in Experiments 1 and 2. No student from Experiments 1 and 2 participated in Experiment 3.
Experimental Design
Experiment 3 was a 2 (VAS: 16°, 4°) × 2 (vertical direction: upward, downward) × 2 (task: focused attention, integration) within-subject design.
Stimuli and Apparatus
As in Experiment 2, participants used the HoloLens 2 (an AR-HMD) to complete the experiment. Participants sat approximately 55 cm away from the wall to ensure a maximum vertical visual angle of 40° in both the upward and downward direction relative to each participant’s central fixation point at the forward field of view (FFOV). The tasks were the same as in Experiment 1 except that information was presented at only two levels of separation (16° and 40°) in the upward or downward direction (Figure 10). This restriction was imposed because additional larger visual angles would have all fallen outside of the vertical FOV of the device, therefore having only one number outside of the FOV was sufficient for our examination. Given that the vertical FOV of the HoloLens 2 is 29°, participants were instructed to position the information located at the center (0° in Figure 10) so that it was at the bottom of the HMD FOV for the upward condition and at top of the HMD FOV for the downward condition. This required a negligible adjustment to ensure that the information presented at 16° was within the FOV of an HMD. The information presented at 40° required participants to vertically move their heads (nod). A static illustration of Experiment 3 conveying how the virtual display was presented with an AR-HMD for the focused attention task (left) and the computation integration task (right). Each image represents a single trial depicting one of two levels (either 16 or 40°) of VAS relative to the center of the display.
Procedure
All participants read a consent form and agreed to the information before starting the experiment. Before setting up the virtual display, participants were seated and asked to indicate to the experimenter where their natural FFOV was on the wall, which served as the central fixation point located at 0° of visual angle. Participants were told that information presented at the 16° location should be located at the edge of an AR-HMD when information was presented either upward or downward and to adjust their position accordingly. The instructions for the focused attention task (with the secondary monitoring task) and the integration task were otherwise the same as in Experiment 2.
Participants completed two counterbalanced blocks (upward, downward) for each task type. Each block consisted of 8 practice trials (4 at each display location) and 60 test trials (30 for each display location presented in a randomized order) for 68 trials per block. Participants completed a total of 272 trials for the entire experiment. Display direction (upward, downward) was blocked within each task, and levels of VAS were blocked. Trials within each level of VAS block were randomized. The entire experiment lasted approximately 30 min.
RESULTS
One participant’s data were removed from all analyses due to technical difficulties during the experiment. Additional outlier criteria were the same as in Experiment 2. Approximately 5% of the data were removed from both tasks (183 trials from the focused attention task and 165 trials from the integration task). Response time and percent error data were analyzed as in Experiments 1 and 2.
We analyzed the data in R using 2 (VAS) × 2 (direction) repeated measures ANOVAs (Figure 11) to test whether there was a decrease in performance for both tasks as visual angle increased (H1) and whether any observed cost in performance differs by direction (H3). The response time data are shown in the left panel of Figure 11. For the focused attention task shown at the left side of the left panel, neither the effect of VAS, F (1, 28) = 1.47, p = .24, ηp2 = .05, of direction, F (1, 28) = 1.51, p = .23, ηp2 = .05, nor their interaction, F (1, 28) = .92, p = .35, ηp2 = .03, significantly impacted the log-transformed response time. Experiment 3: The mean response time (left) and mean percent error (right) plotted as a function of VAS (degrees) for the focused attention task and integration tasks, and vertical direction (downward: solid lines, upward: dashed lines). Error bars represent one standard error of the mean.
For the integration task, shown on the right side of the left panel, there was no statistically significant main effect of VAS, F (1, 28) = 1.27, p = .27, ηp2 = .04. However, there was a statistically significant effect of direction on log-transformed response time, F (1, 28) = 14.85, p < .001, ηp2 = .35. Overall, participants were .47 s faster when information was presented downward than upward. This main effect of direction is further explained by the statistically significant interaction between VAS and direction, F (1, 28) = 5.64, p = .02, ηp2 = .17. The post hoc comparison between upward and downward at 16° was not significant, t (28) = −1.59, p = .12, d = .14. However, the comparison between upward and downward at 40° was significant, t (28) = −4.09, p < .001, d = .42. Downward displacement substantially decreased response time at the larger visual angle for the integration task.
Regarding accuracy, the percent error data are shown in the right panel of Figure 11. For the focused attention task on the left side of the right panel, there were no effects of VAS, F (1, 28) = .34, p = .57, ηp2 = .01, direction, F (1, 28) = .52, p = .48, ηp2 = .02, or their interaction, F (1, 28) = .02, p = .88, ηp2 < .01.
For the integration task, shown in the right side of the right panel, there was no statistically significant effect of VAS, F (1, 28) = .44, p = .51, ηp2 = .02, direction, F (1, 28) = .76, p = .39, ηp2 = .03, or their interaction, F (1, 28) = .61, p = .44, ηp2 = .02.
Data from the continuous monitoring task suggests that participants followed instructions to keep their fixation at the center of the display at the start of each trial. A one-way repeated measures ANOVA showed no statistically significant effect of VAS on jitter response time (p = .22) or accuracy (p = .39), suggesting the desired consistent performance across VAS. Overall, participants were 83% accurate during the secondary task.
The effect of VAS and direction on the number of head movements for the focused attention task is shown in Figure 12 (left). The ANOVA revealed a statistically significant effect of VAS, F (1, 28) = 95.04, p < .001, ηp2 = .77. Participants made substantially more head movements when information was located at 40° of VAS than at 16°. There was no statistically significant effect of direction on head movements, F (1, 28) = 3.48, p = .07, ηp2 = .11. Furthermore, the interaction between VAS and direction on head movements was nonsignificant, F (1, 28) = 3.95, p = .06, ηp2 = .12. Experiment 3: The mean head movements (per block) plotted as a function of VAS (degrees) for the focused attention (left) and integration (right) task. Solid lines and circles represent information presented downward. Dashed lines and triangles represent information presented upward. Error bars represent one standard error of the mean.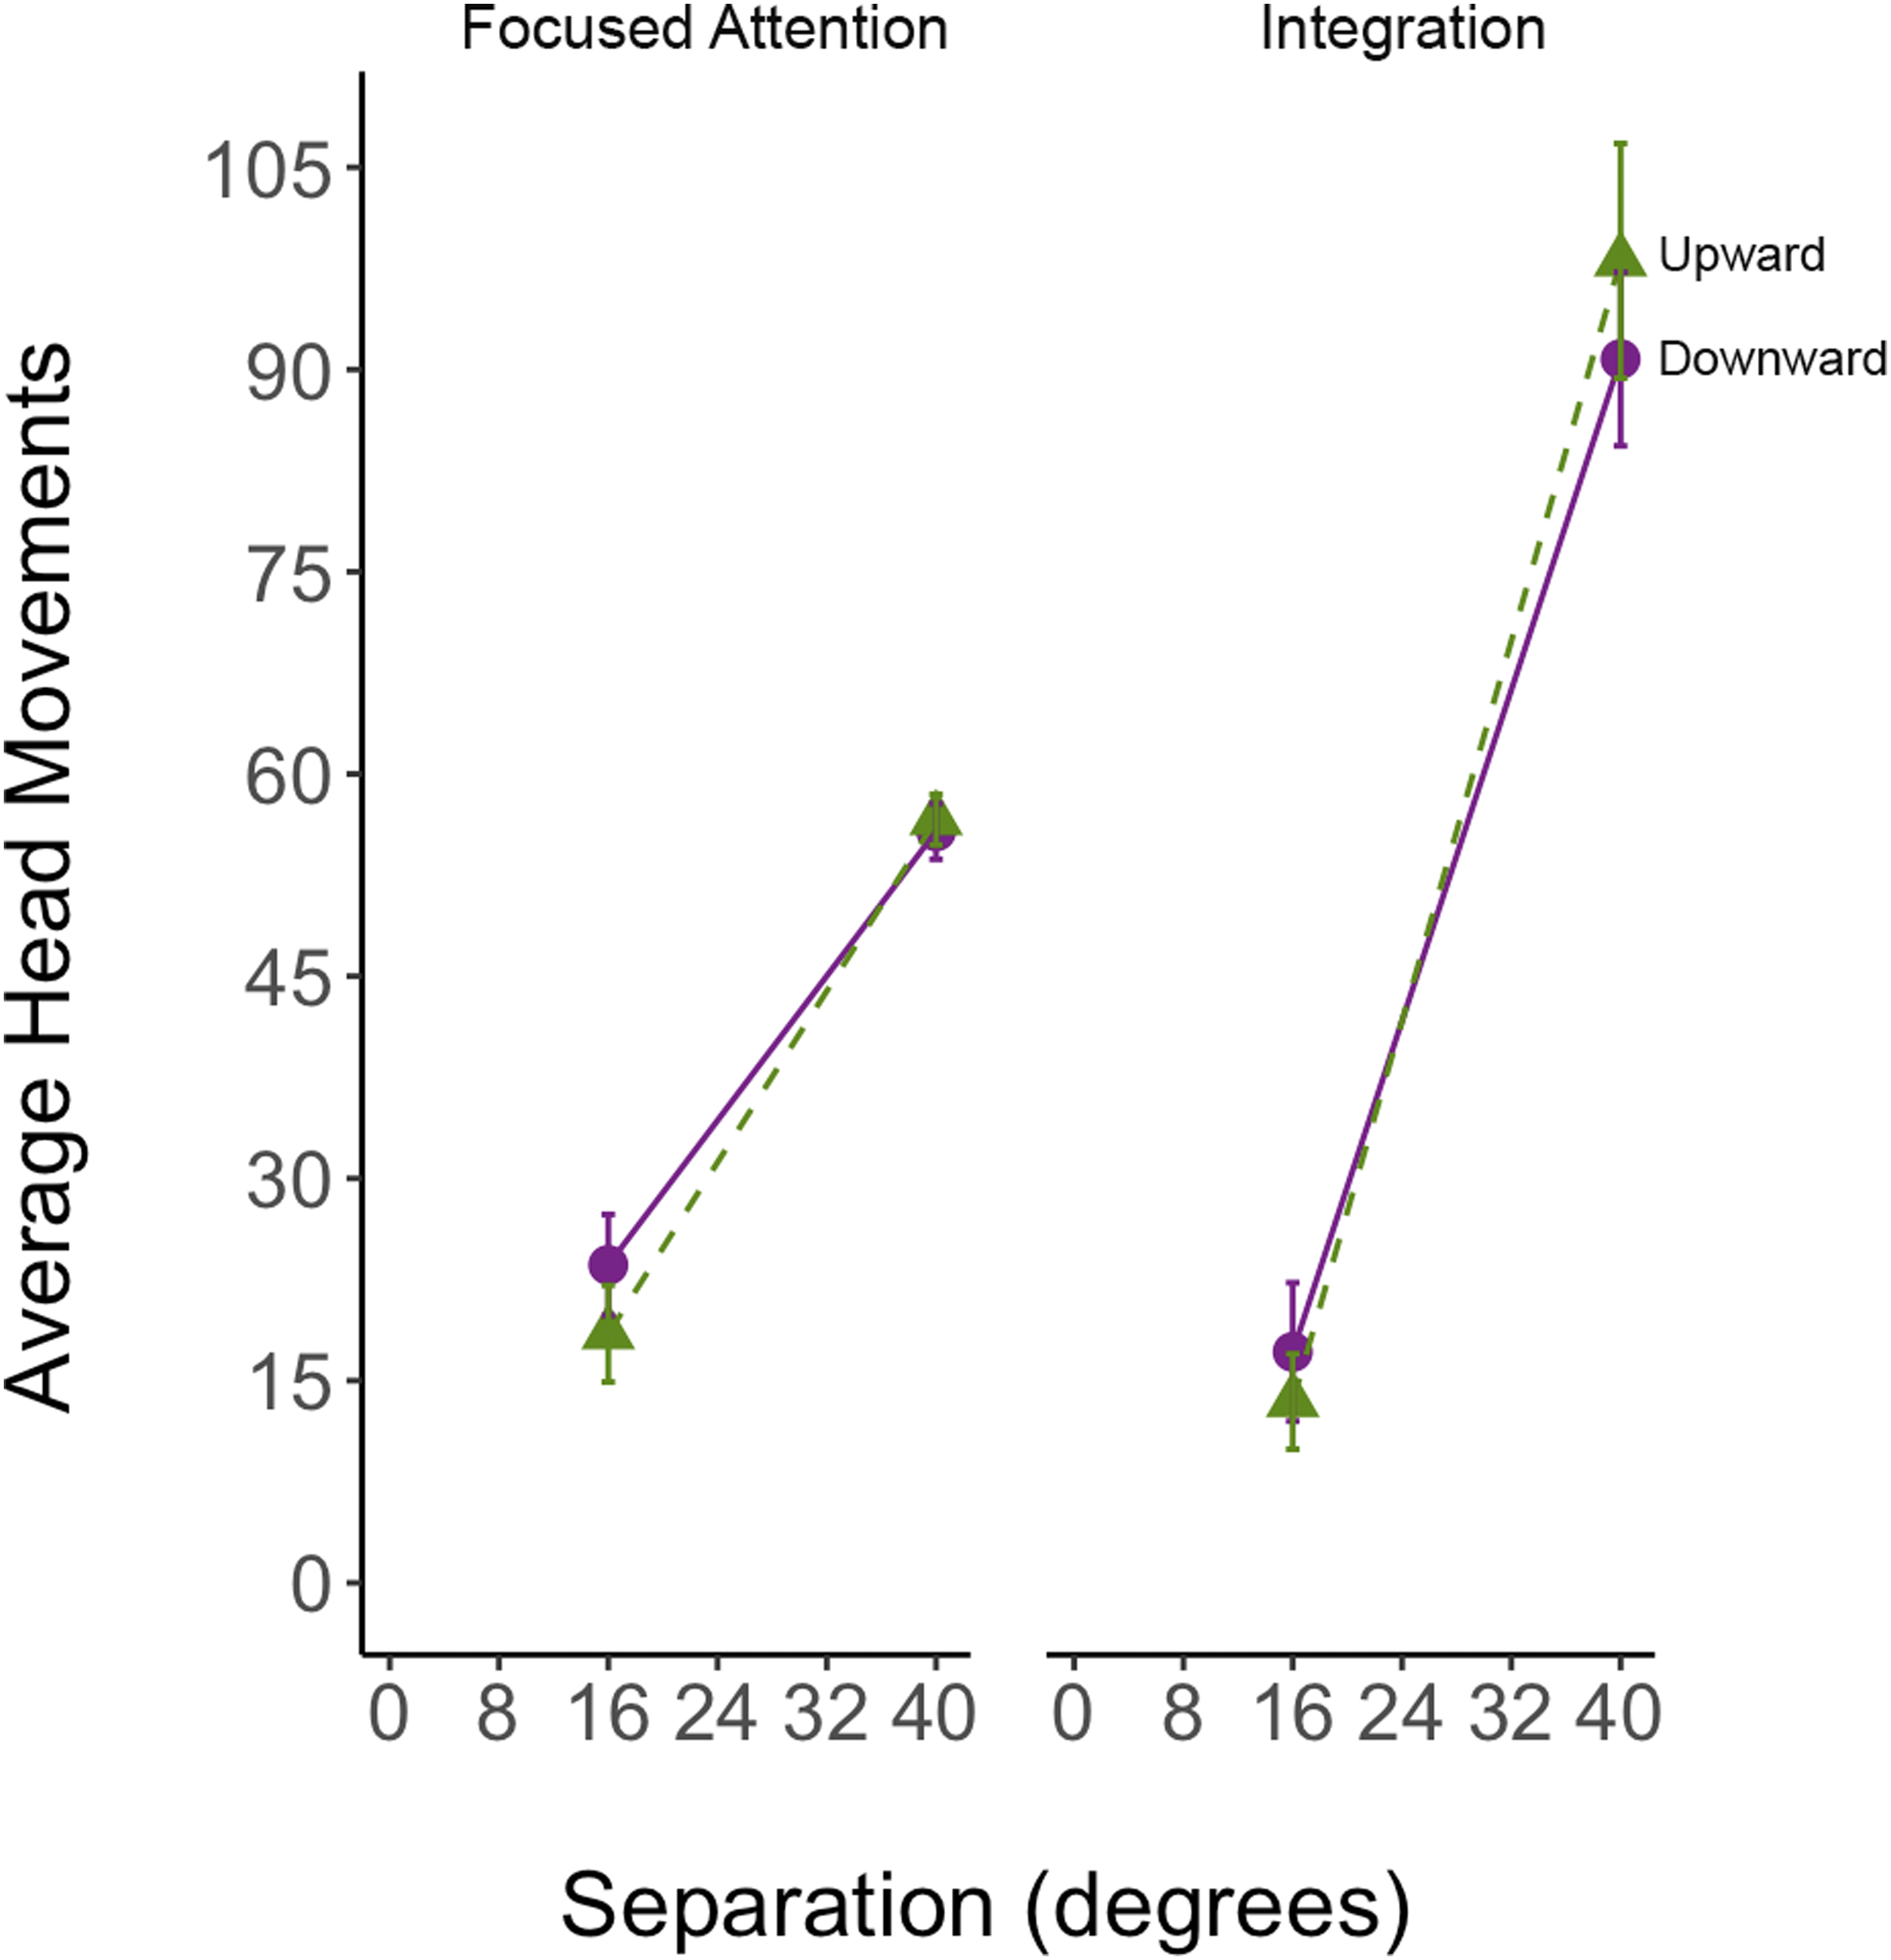
For the integration task, the effect of VAS and direction on the number of head movements is shown on the right side of Figure 12. The ANOVA revealed a large and statistically significant effect of VAS, F (1, 28) = 88.53, p < .001, ηp2 = .76. There was no statistically significant effect of direction, F (1, 28) = .34, p = .54, ηp2 = .01, nor a significant interaction between direction and task, F (1, 28) = 3.17, p = .09, ηp2 = .10.
Figure 12 clearly shows an increase in head movements as VAS increases for both tasks, indicating that vertical head movements mitigated performance decrements. In addition, there is a steeper increase in head movements from the smallest to the larger visual angle for the integration task (approximately 79) compared to the focused attention task (approximately 35), suggesting greater working memory demands for the integration task.
THE ORIENTATION DIRECTION EFFECT: COMBINED ANALYSIS OF EXPERIMENTS 2 AND 3
Summary of Performance Measures for the Focused Attention Task (Top Table) and the Integration Task (Bottom Table) for Experiments 2 and 3. Small VAS (Display Separation) Refers to 16° and Large VAS (Display Separation) Refers to 40° and 50°. Note That Response Time is Measured in Seconds (s)
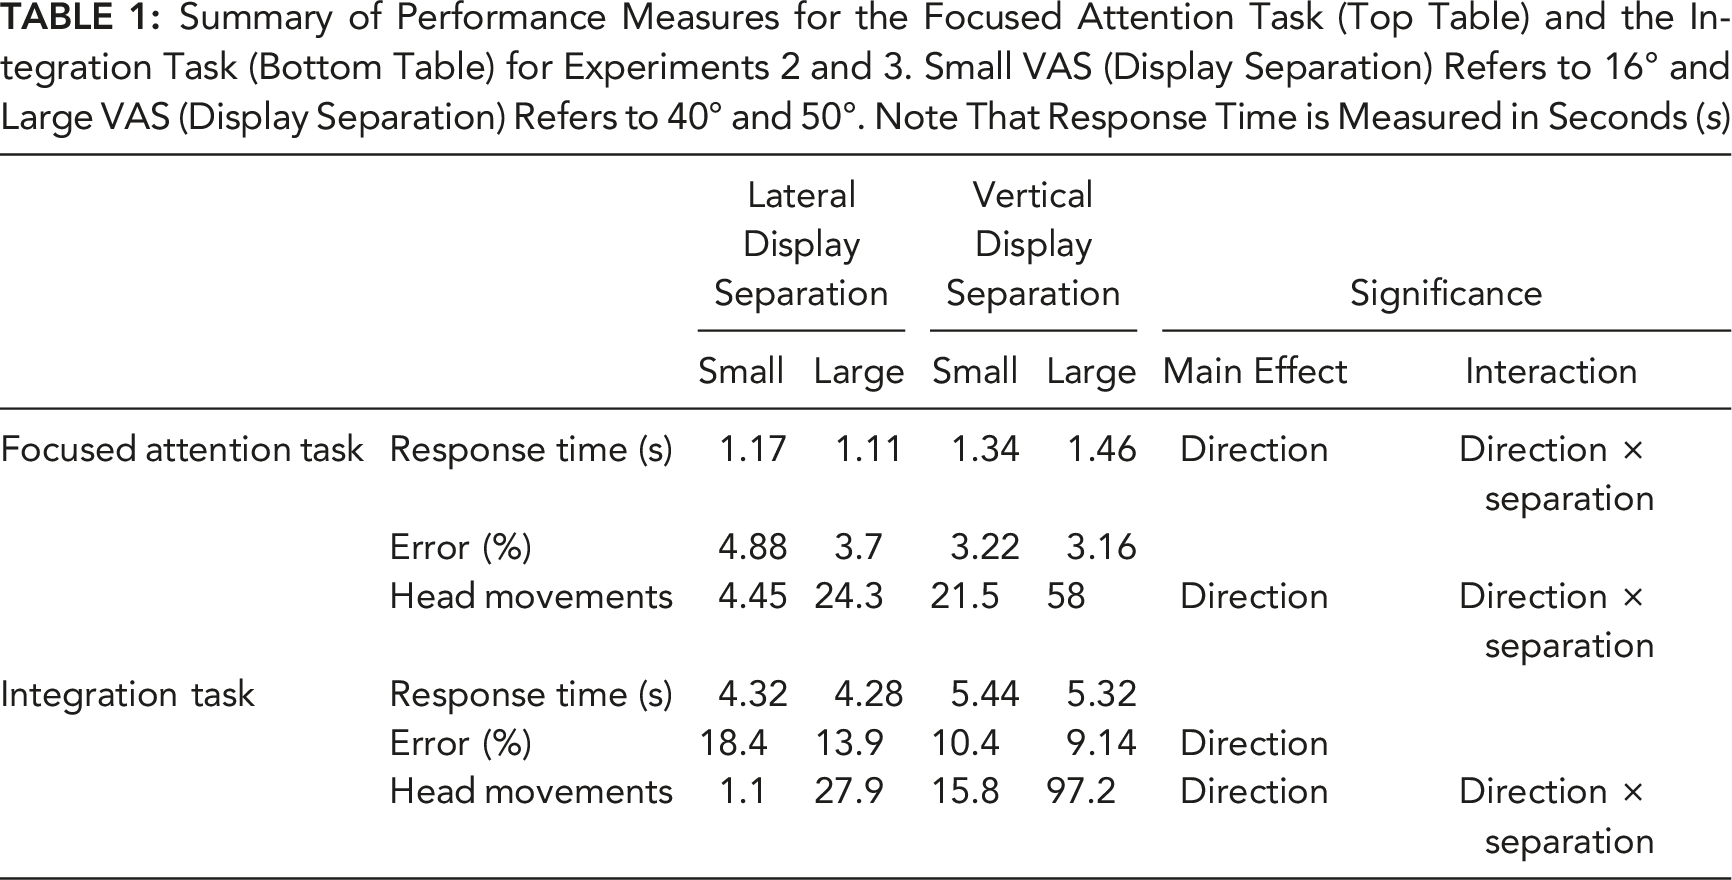
We conducted a 2 (direction) by 2 (VAS) mixed ANOVA with data from the two experiments. Before the analysis, we recoded visual angles as “small” (16°) and “large” (40° or 50°, depending on the experiment). In reporting our analysis below, we report only those effects that include direction (i.e., not the main effect of separation).
Focused Attention
The ANOVA revealed a significant effect of direction on the log-transformed response time, F (1, 51) = 10.68, p < .001, ηp2 = .17. As shown in the top half of Table 1, participants responded .26 s faster when the location of information was varied in the lateral direction compared to the vertical direction. There was a significant interaction between direction and VAS, F (1, 51) = 5.26, p = .03, ηp2 = .09, indicating a greater increase in response time at larger visual angles when information was displaced vertically. Importantly, this increase is revealed even though the visual angle difference was actually smaller for the vertical than for the lateral direction.
The ANOVA on percent error revealed neither a statistically significant effect of direction, F (1, 51) = 1.04, p = .30 ηp2 = .02, nor of VAS, F (1, 51) = 1.01, p = .32, ηp2 = .02, nor a significant interaction between direction and VAS, F (1, 51) = .83, p = .37, ηp2 = .02.
An ANOVA revealed a large and statistically significant effect of direction on the frequency of head movements, F (1, 51) = 97.14, p < .001, ηp2 = .66. In addition, the interaction between VAS and direction was statistically significant, F (1, 51) = 14.11, p < .001, ηp2 = .22. These effects indicated both more head movements overall, and a greater increase in head movements as VAS increased in the vertical rather than the lateral axis, consistent with the greater loss of acuity in the vertical dimension (Abrams et al., 2012; Becker, 1991).
Information Integration
We analyzed data from the integration task the same way as described above. As shown in the bottom half of Table 1, the ANOVA on the log-transformed response time revealed no statistically significant effect of direction, F (1, 51) = 2.18, p = .15, ηp2 = .04, or VAS, F (1, 51) = .87, p = .36, ηp2 = .02, and no statistically significant interaction between VAS and direction, F (1, 51) = .28, p = .60, ηp2 < .001.
The ANOVA on percent error revealed that participants were significantly 6.4 percentage points more accurate (lower error) when information was presented vertically compared to laterally, F (1, 51) = 6.69, p = .01, ηp2 = .12. The interaction between VAS and direction was nonsignificant, F (1, 51) = 1.76, p = .19, ηp2 = .03. This suggests that the higher error when information was presented laterally was not directly because the larger separation was outside the initial field of view.
The ANOVA on head movements revealed a large effect of direction, F (1, 51) = 75.32, p < .001, ηp2 = .60. Participants made more head movements for information displayed vertically compared to laterally. There was a significant interaction between VAS and direction on the number of head movements, F (1, 51) = 30.26, p < .001, ηp2 = .37, signaling that the amplification of head movements at larger visual angles increased much more when the movement was vertical rather than lateral.
Discussion
Overall, we replicated the null effects found in Experiments 1 and 2, showing no performance cost associated with visual angle for either task in Experiment 3. However, a performance cost was associated with the direction (upward vs. downward) for the integration task. Participants were nearly half a second slower when information was presented upward vertically (5.0 s) compared to downward (4.56 s). This cost in the upward direction slightly increased at the furthest visual angle, suggesting an overall cost of VAS relative to the direction information is presented.
The analysis comparing Experiments 2 and 3 shows a cost to response time when information was displaced vertically compared to laterally for the focused attention task but not for the integration task. However, participants were 6.4 percentage points more accurate when information was displaced vertically compared to laterally for the more difficult integration task, again a directional asymmetry presumably related to reduced acuity loss on the vertical than on the horizontal axis (Abrams et al., 2012). During both tasks, participants made a large number of head movements at the furthest visual angles, which may have offset possible performance costs. This is particularly true for the integration task. People made more head movements when information was presented vertically compared to laterally, but the vertical direction had the greatest impact on head movements at the larger visual angle.
Addressing Issues of Power
Hypothesis 1 sought to examine whether there would be a decrease in performance for both task types as visual angle increases (H1a) and whether this will reflect a nonlinearity between the eye and head field depicted in Figure 1 (H1b). Collectively, the above set of experiments generally failed to find the predicted effects discussed in the Introduction. One possible reason for our lack of findings may have resulted from underpowered experiments. Taking this into account, we extracted the relevant effect sizes from the literature presented in Figures 2 and 3 (Houtmans & Sanders, 1984; Martin-Emerson & Wickens, 1992; Murata et al., 2018; Murata & Kohno, 2018) to compute an overall effect size for the impact of visual angle on performance (i.e., collapsing across response time and error). To find a large effect of lateral visual angle separation, a minimum sample size of 4 participants results in 80% power to find an effect of Cohen’s f = 1.24 (α = .05, for a repeated-measures within-factors design). However, we are also interested in how the effect of visual angle varies as a function of task type and in the vertical direction. A minimum sample size of 24 participants results in 80% power to find a medium effect of Cohen’s f = .25 (α = .05, for a repeated-measures within-factors design). Thus, although the experiments were not designed to detect small effect sizes, there was sufficient power to detect effects of greater practical importance in this domain.
Based on head movement data from Experiment 1, it seems as though the eye field extends further than initially expected given the few head movements made at 40° of visual angle compared to the number of head movements made at 50 of visual angle in Experiment 2. Such a null effect is not entirely surprising in light of prior research (Figures 2 and 3) because of the large variability of the strength of those effects, particularly within the range of lower visual angles.
GENERAL DISCUSSION
The current set of experiments examined the concept of information access effort, as expressed in visual angle of separation (VAS) between two information sources. The effects of VAS on performance and IAE were predicted to be modulated by task, as expressed by the proximity compatibility principle (Schons & Wickens, 1993; Wickens & Carswell, 1995), and by the invocation of head movements, distinguished between the eye field and the head field (Houtmans & Sanders, 1984). Our interest was also to examine if the pattern of effects observed on a flat panel display (Experiment 1) would generalize to an HMD (Experiments 2 and 3), and how vertical displacement differed from lateral displacement.
For Hypothesis 1, we predicted that, independent of task type, we would observe an increased cost to performance with greater separation (H1a) and that this increase would follow a nonlinear accelerating form (see Figure 1) as separation increased into the head field (H1b). This is because neck rotation was assumed to impose a greater cost to response time, or accuracy if the rotation was insufficient to bring the second stimulus into foveal vision due to the tendency to reduce effort. We found little evidence supporting H1a. Only two of the 12 visual trends show an increase in either response time or accuracy with increasing visual angle, and only two with a statistically significant effect of visual angle (p < .05). Correspondingly, only three of the response time and error performance curves showed the clear “accelerating” visual trend of performance loss at higher visual angles (i.e., a discontinuity), thus generally failing to distinguish between eye and head field as the latter region is entered.
However, the offsetting contributions of head movements are one plausible explanation for the lack of support for the predicted effects of VAS on performance. Across all experiments, there was an increasing prevalence of head movements as visual angle increased. In Experiment 2, there was an acceleration in the number of head movements as the visual angle increased. Experiment 3 imposed only two angles, which is not sufficient to conduct a statistical test to examine a second-order component. It is important to consider that in only one case (i.e., the focused attention task in Experiment 1) did the added head movements still result in a cost to response time, and in only one case (the focused attention task in Experiment 1) did the compensation appear to be insufficient to preserve accuracy at the farthest visual angle. Thus, both eye and head movements were of minimal physical effort.
The difference in head movements between Experiments 1 and 2 suggests that the boundary between the eye field and head field may be at a greater visual angle than expected. In Experiment 1, fewer head movements were made at the largest visual angle likely because participants could maintain accuracy using low effort eye movements instead of more effortful head movements. A recent study by Poole and colleagues (2023) found a cost to response time with quick glances up to approximately 32–40° of visual angle. At around 50°, head movements were required to bring information into foveal vision because extreme eye movements were no longer sufficient to maintain accuracy.
Illustration of When IAE Costs Were Greater for the Integration Than the Focused Attention Task, Indicated by a “+”

In Table 2, a “+” signals an experiment in which both tasks were performed, and the pattern of the interaction was consistent with greater growth of IAE cost for integration than for focused attention. A “-” indicates that there was no interaction. Only two of six possible interactions of response time and error performance measures yielded significance in the expected direction, where there was a greater cost of visual angle for the integration than the focused attention task. There was an absence of the predicted effect of the proximity compatibility principle. We attribute this absence to be a consequence of the fact that the greater visual angles used here simply did not increase VAS and hence IAE sufficiently to cause greater resource competition with the more effort-demanding integration task. As discussed in the previous section, head movements provided sufficient low-cost compensation to offset the greater effort requirements of information integration at the higher visual angles, particularly in Experiments 2 and 3.
The prior experimental basis for hypothesis 3, addressing the direction of visual angle displacement, was not strong. Prior literature illustrated a weak effect that vertical displacement of 16° disrupted performance more than lateral displacement (Abrams et al., 2012; Wickens et al., 2005), and the finding that greater muscular activity occurs with vertical displacement (Kim et al., 2010). However, in Experiment 3, we observed more vertical than lateral head movements across both tasks. This difference in directional motion preference was plausibly associated with the focused attention task which showed an increased response time. Also, the increase in head movements at the wider visual angle was much greater for the vertical than for the lateral displacement. Both of these head movement increases in the vertical axis may be associated with visual acuity declining more rapidly in the vertical direction (Abrams et al., 2012; Wickens et al., 2016). Our participants here, as elsewhere, appear to have entirely compensated for this diminished resolution along the vertical axis by increasing their frequency of head rotations to bring information into foveal vision.
Comparing the results from the flat panel desktop display to an HMD display, the most prominent similarity is that for neither platform did performance suffer much with increasing VAS, even out to the farthest visual angle. Head movements were slightly elevated with an HMD (7.5 for the HMD vs. 2.1 with the flat panel) at the separation level most comparable between the two platforms (32°): a finding that signals that an HMD used here does not impose performance penalties on head rotation. The greater number of head movements associated with the widest HMD angles is the necessary consequence of the second stimulus being out of the initial forward FOV; but the fact that performance was not penalized at this widest separation speaks favorably to the ease of such movements with an HMD, when this feature of “glanceable AR” is employed (Lu et al., 2020). Such findings have important practical human factors implications regarding where to present information on an HMD that does not occlude the forward field of view and also does not impose excessive IAE costs.
Finally, comparing the generally null results of VAS observed here with the trends of prior literature depicted in the ensemble plots of Figures 2 and 3, we note that for response time (Figure 2), the only substantial increases appear with separations above about 45°, levels generally beyond those employed in the current study. For accuracy, the only substantial loss seen in Figure 3 (blue line) within the range used here was that observed by Lu et al. (2020), and their wider angle was such that, with an HMD, the stimulus was out of the initial forward view of an HMD.
While the current study outcomes do not align with the IAE predictions, it is important to note that this only highlights the complexities underlying the relationship between visual angle and spatial separation. Recent findings with a wide-angle desktop display (Poole et al., 2023; also see Draschkow et al., 2021) found the expected trend of increased response time with increasing separation between 32 and 64 degrees of visual angle. There was also an increase in head movements as spatial separation increased. Based on this and our findings, we can plausibly infer that spatial separation negatively impacts performance beyond 50°, the maximum visual angle used in the present work. The point at which head movements are helpful and become hurtful to performance depends on a critical boundary where head movements seemingly become more effortful. This is a very important human factors issue, particularly in environments where such movements incur additional penalties, such as the pilot of a rotating aircraft where any such movements can trigger vestibular illusions; or the wearer of a heavy helmet incurring added muscular fatigue.
LIMITATIONS AND FUTURE DIRECTIONS
The present set of experiments is not without limitations. We used an observational measure of head movements. Future work should use head-tracking sensors to ensure a direct measurement of head movements. In addition, eye-tracking data should be gathered to assess whether people relied on peripheral vision versus eye scanning to foveate the stimuli, and to assess how long people dwelled on information located at greater VAS. Lastly, we tested alphanumeric stimuli while previous studies tested spatial stimuli, which might partially explain the difference in the overall performance trends.
In future work, it will be important to extend the VAS range considerably, particularly with an HMD, which can position information within 360° around the user. The current study also does not examine the role of VAS when information displayed on an HMD is one at a different depth relative to the far domain, especially given issues of convergence and accommodation when using HMDs. We anticipate that these added sources of muscular effort will amplify VAS effects.
CONCLUSIONS
In conclusion, this research has illuminated the surprisingly low time and effort costs of head movements to mitigate accuracy costs of peripheral vision at wide visual angles. These findings speak favorably to the use of glanceable AR, as well as provide guidelines when information is presented within the head field, in either HMD or large screen display applications.
Footnotes
Acknowledgments
This research was supported by the Department of Defense (DoD), specifically the Office of Naval Research under grant numbers N00014-21-1-2949 and N00014-21-1-2580. Correspondence concerning this manuscript should be addressed to Amelia C. Warden, Department of Psychology, Colorado State University, Fort Collins, CO 80523. Contact:
KEY POINTS
The current set of experiments addresses gaps in prior research by directly looking at the impact of lateral and vertical separations that span the eye and head fields for a computation integration task and a numeric focused attention task. In addition, we expand these findings from a 2D flat panel display to an augmented reality HMD, which can present information 360° around the user. We also examine the difference in effects of visual angle separation between the two task types that would be predicted by the proximity compatibility principle. While the expected performance costs predicted by the IAE function failed to replicate, the results revealed that head movements could have been responsible for mitigating any costs to performance, suggesting that both eye scanning and head movements were less effortful than expected. The results have implications for design guidelines when presenting information within the head field with either large desktop displays or HMDs where information can be located 360° around the user as in the concept of glanceable AR. The ease of head movements with an HMD speaks favorably to how information is presented and accessed when using such devices.