
Abstract
Objective:
Given increasing numbers of compulsory admissions, it is important to assess patient risk profiles and identify factors that are appropriate for intervention.
Methods:
A sample of 116 patients who were compulsorily admitted was studied. Socio-demographic and clinical characteristics were recorded. Patients were interviewed twice using the Verona Service Satisfaction Scale and the Birchwood Insight Scale. Changes in insight and satisfaction during 2 years were linked to the incidence of involuntary re-admissions in the next three follow-up years.
Results:
A higher mean score for patient satisfaction was found (mean=3.77, standard deviation (SD)=0.56; p⩽.001) in the second interview than in the baseline interview (mean=3.26, SD=0.65). There was also an improvement in insight (in the second interview: mean=7.22, SD=2.86 and in the baseline interview: mean=6.34, SD=3.18; p=.027). There was an inverse correlation between increasing satisfaction (in years 1–2) and the incidence of involuntary admission in years 3–5 (odds ratio (OR)=0.445, 95% confidence interval (CI)=0.252–0.793; p=.006). This association proved to be dependent on a history of involuntary admission.
Conclusion:
Increasing patient satisfaction in the first 2 years was associated with a lower risk of compulsory re-admission in the subsequent follow-up period, but this association proved to be dependent on a history of involuntary admissions in these first two follow-up years. Increase in insight during the same period did not show any effect whatsoever.
Keywords
Introduction and aims
Involuntary admissions to inpatient psychiatric facilities are seen throughout the world, and they have a major impact on psychiatric patients and their caregivers. Evidence about the positive effects and the negative side effects of far-reaching interventions such as involuntary admissions is gradually accruing, but the evidence base is still rather limited. The results of a recent multi-centre 1-year follow-up study in the United Kingdom using several measures for functioning, social outcomes and subjective quality of life suggest that the clinical and social benefits patients experience subsequent to involuntary admission are, on average, rather limited (Priebe et al., 2011). It is clear that involuntary admissions result in negative experiences for the patients and a reduction in patient autonomy. It is, therefore, important to look for opportunities to reduce the number of involuntary admissions by identifying risk factors that are appropriate for intervention.
After a period of 15 years during which numbers of involuntary admissions in the Netherlands and several other European countries increase, the Amsterdam Study of Acute Psychiatry (ASAP) was conducted between 2004 and 2008 (De Stefano & Ducci, 2008; Mulder et al., 2006; Nijs & Vandenberghe, 2008; van der Post et al., 2008). The ASAP and other studies have now identified several variables that are associated with the incidence of involuntary admissions independently of potential confounders such as age, gender and diagnostic category: living alone, previous involuntary admission and low level of satisfaction with treatment (Aberg-Wistedt, Cressell, Lidberg, Liljenberg, & Osby, 1995; Becker et al., 1997; Priebe et al., 2011; van der Post, Mulder, et al., 2012; van der Post et al., 2014; van der Post, Visch, et al., 2012; Webber & Huxley, 2004).
Although we know that there is a clinical improvement in most involuntary patients at the end of their admission, most involuntary patients are still negative about their compulsory admission (Katsakou & Priebe, 2006; Priebe et al., 2009). From UK and Dutch studies, we know that involuntary status during admission is a predictor of lower levels of treatment satisfaction (Greenwood, Key, Burns, Bristow, & Sedgwick, 1999; van der Post et al., 2014). Furthermore, a lack of insight may be a risk factor for relapse and possibly for compulsory admission also. In the cross-sectional ASAP study of 1,907 emergency psychiatric consultations, a lack of insight was clearly correlated with the decision to admit patients involuntarily after the emergency consultation (van der Post et al., 2009). However, how variations in insight act as a predictor of future compulsory admission is still not clear: the results of earlier studies are indecisive. An 18-month follow-up study of a group of patients in the United Kingdom with a first episode of non-affective psychosis found a significant association between a low level of insight (measured with the Birchwood Insight Scale) and the number of relapses and re-admissions during 6-month follow-up (Drake et al., 2007). The authors’ assumption is that patients with a lack of insight do not recognise their complaints and are less likely to seek help earlier in relapse which result in compulsory readmissions. However, this study did not look at the legal status of the re-admissions. A more recent study found no significant associations between insight and the risk of involuntary admission during a 2-year follow-up in a mixed group of crisis patients, only 40% of whom had a non-affective psychosis (van der Post et al., 2014).
To explain why insight lacks predictive value for the risk of involuntary admissions, it may be hypothesised that insight increases during psychiatric treatment after involuntary admission. Patients with impaired insight at baseline may undergo a change in their negative attitude towards their illness and towards psychiatric treatment and, therefore, cooperate better with their doctors. This will probably reduce their risk of involuntary admission. This may be why low levels of insight at baseline do not predict outcome.
The present ASAP 5-year follow-up study looks at how insight and patient satisfaction develop during treatment following compulsory admission. We study the relationship between the changes in these patient perspectives and the incidence of involuntary re-admission.
Aim
This study addresses four questions:
Do levels of insight and patient satisfaction increase during the 2 years of follow-up treatment after an involuntary admission?
Are changes of insight and patient satisfaction during follow-up associated with baseline socio-demographic and clinical characteristics?
Are changes of insight and patient satisfaction during follow-up correlated with the use of mental health services during this period?
Do patients who reach higher levels of insight and/or patient satisfaction during follow-up years 1 and 2 have a lower risk of involuntary re-admission in follow-up years 3–5?
Methods
Study design and setting
We conducted an observational prospective study with a 5-year follow-up that consisted of a 2-year period followed by a period of 3 years. The study was part of a cohort study covering all consecutive patients receiving emergency consultations from the Psychiatric Emergency Service Amsterdam (PESA) between 15 September 2004 and 15 September 2006 (van der Post et al., 2008).
PESA is the main decision-making body in the area of involuntary emergency admissions in Amsterdam (743,000 inhabitants). It provides a 24-hour psychiatric emergency service, 7 days a week. Patients are referred by (family) doctors, police and mental health-care workers.
People who come into contact with the police are first screened at the police station by a community mental health nurse from the City Health Service. Patients in need of immediate psychiatric consultation are brought by the police to the PESA’s psychiatric emergency room. If patients are referred to the PESA by primary health-care providers such as family doctors or doctors from accident and emergency department (A&E) units at general hospitals, they are often seen in their homes or at the referring A&E unit. In general, consultations are conducted on working days between 9 a.m. and 10 p.m. by a team of psychiatric residents, community mental health nurses and a psychiatrist. Psychiatrists play an active role during consultations, either as supervisors or by seeing patients themselves. At other times, residents work together with the nurse during the consultations, with psychiatrists providing telephone backup.
Criteria for inclusion
We intended to select a group of 125 participants from all the patients who had at least one consultation with PESA (in the study period) which resulted in an involuntary admission. These admissions took place either directly after the emergency consultation or between the consultation and the patient’s first interview. For pragmatic reasons, we selected only patients with a fixed abode in Amsterdam and with a sufficient command of Dutch. We excluded people living elsewhere in the Netherlands or abroad and people with no known place of residence.
Measures
The data collected at baseline (the emergency consultation) were age, gender, ethnic background, domestic situation and the Diagnostic and Statistical Manual of Mental Disorders (4th ed., text rev.; DSM-IV-TR) axis I diagnostic category. We used three main DSM categories: schizophrenia and other psychotic disorders (psychotic disorder), mood disorder and other or no disorders (American Psychiatric Association, 2000). The last group includes drug- and alcohol-related disorders as the main axis I diagnostic category, a wide variety of other diagnostic categories and also psychosocial problems without any DSM axis I disorder categorised. Any history of involuntary admissions, as recorded in the Amsterdam Mental Health Care Database (2006), was also noted.
During the two interviews (the first at inclusion and the second after 2 years), patient attitudes towards their complaints and illness were assessed with an 8-item self-report insight questionnaire developed and validated by Birchwood et al. The questionnaire has three subscales: re-labelling symptoms, awareness of illness and need for treatment. The cut-off between low and high insight is between 8 and 9 for the total score (van der Post, Mulder, et al., 2012a).
In order to determine patients’ opinions about previous mental health care, we used the European version of the Verona Service Satisfaction Scale (VSSS-EU), a self-report questionnaire developed by the international Epsilon Study group (van der Post et al., 2009, 2014).The 49 items in the VSSS-EU cover seven (out of eight) dimensions (subscales): Overall Satisfaction (3 items), Professionals’ Skills and Behaviour (10 items), Information (3 items), Efficacy (8 items), Types of Intervention (18 items) and Involvement of Relatives (5 Items). We could not study the access dimension (two items), which includes the costs of treatment. The items have been described in detail elsewhere (van der Post, Visch, et al., 2012b). The satisfaction ratings were obtained using a 5-point Likert scale. According to the VSSS-EU manual, the cut-off point between dissatisfied and satisfied is above the middle score, mixed.
The Index for total Consumption of Services (ICS) was used to obtain a cumulative measure of the amount of service use for each patient (Lavik, 1983). Total consumption during follow-up was calculated using the following principles: one outpatient consultation – one point, 1 day in day care service – two points and 1 day in inpatient service – three points (Lavik, 1983). For the outcome measure, we counted the number of involuntary admissions in a 2-year follow-up period after inclusion and again in the 3 years after the second interview, as recorded in the Amsterdam Mental Health Care Database (2006).
Data analysis
To check for selective inclusion, the patient characteristics of the study sample (N = 116) at baseline were compared with the characteristics of the group of eligible patients who were not included in the follow-up study (N = 483) using χ2 tests and independent samples t-tests (Table 1).
Baseline characteristics for involuntarily admitted patients included and not included in the study sample.
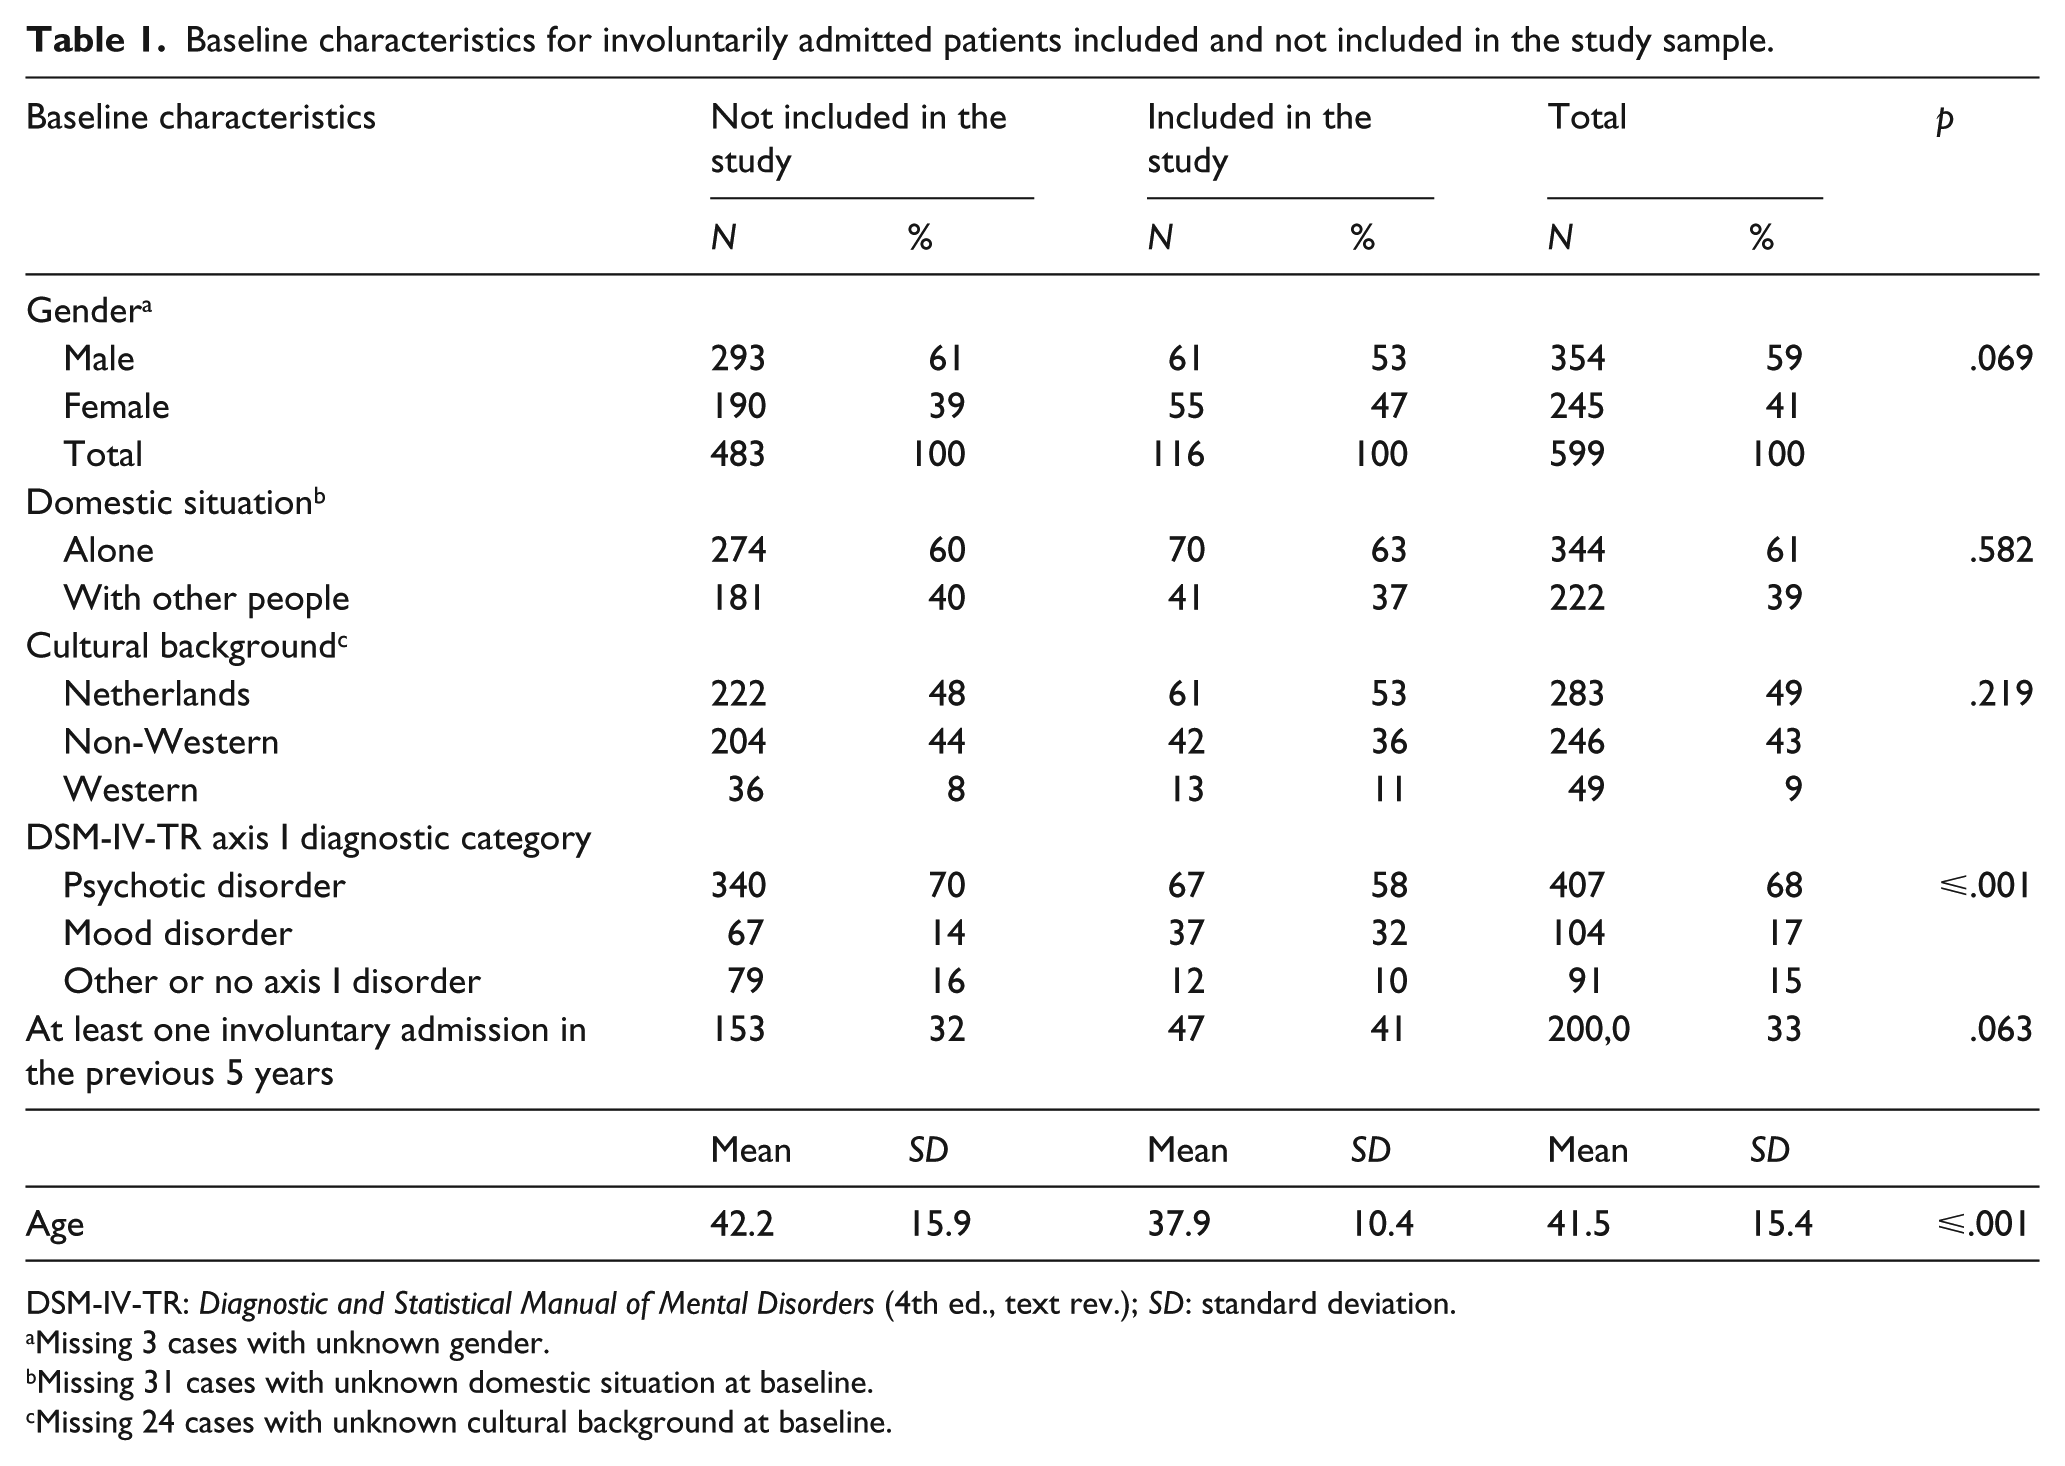
DSM-IV-TR: Diagnostic and Statistical Manual of Mental Disorders (4th ed., text rev.); SD: standard deviation.
Missing 3 cases with unknown gender.
Missing 31 cases with unknown domestic situation at baseline.
Missing 24 cases with unknown cultural background at baseline.
To check whether levels of insight and patient satisfaction increased during follow-up, paired samples t-tests were conducted to compare total scores for the first and second interviews for both patient satisfaction (VSSS-EU) and insight (Birchwood Insight Scale).
Pre-treatment or post-treatment effect sizes were then calculated by dividing the difference between the Birchwood and VSSS-EU total scores for each individual patient by the pooled standard deviation for the mean pre-treatment scores. Using Cohen’s (1988) d , a cut-off was established at an effect size of .5 (in other words, a ‘medium’ effect). Clients whose Birchwood or VSSS-EU total scores increased by >0.5 were classified as ‘improved’, clients with a difference in the scores of ⩽0.5 and >−0.5 were considered to be ‘not changed’ and clients whose scores decreased by ⩽0.5 were classified as ‘deteriorated’.
A bivariate analysis was conducted with Pearson’s chi-square test or Fisher’s exact test to examine differences in socio-demographic factors, clinical presentation and history of admissions or re-admissions in the previous 5 years between the two patient groups: improved or not improved (for both questionnaires; Table 2).
Baseline characteristics, diagnostic category, treatment history in terms of insight and patient satisfaction during 2 years of FU (N=92). a
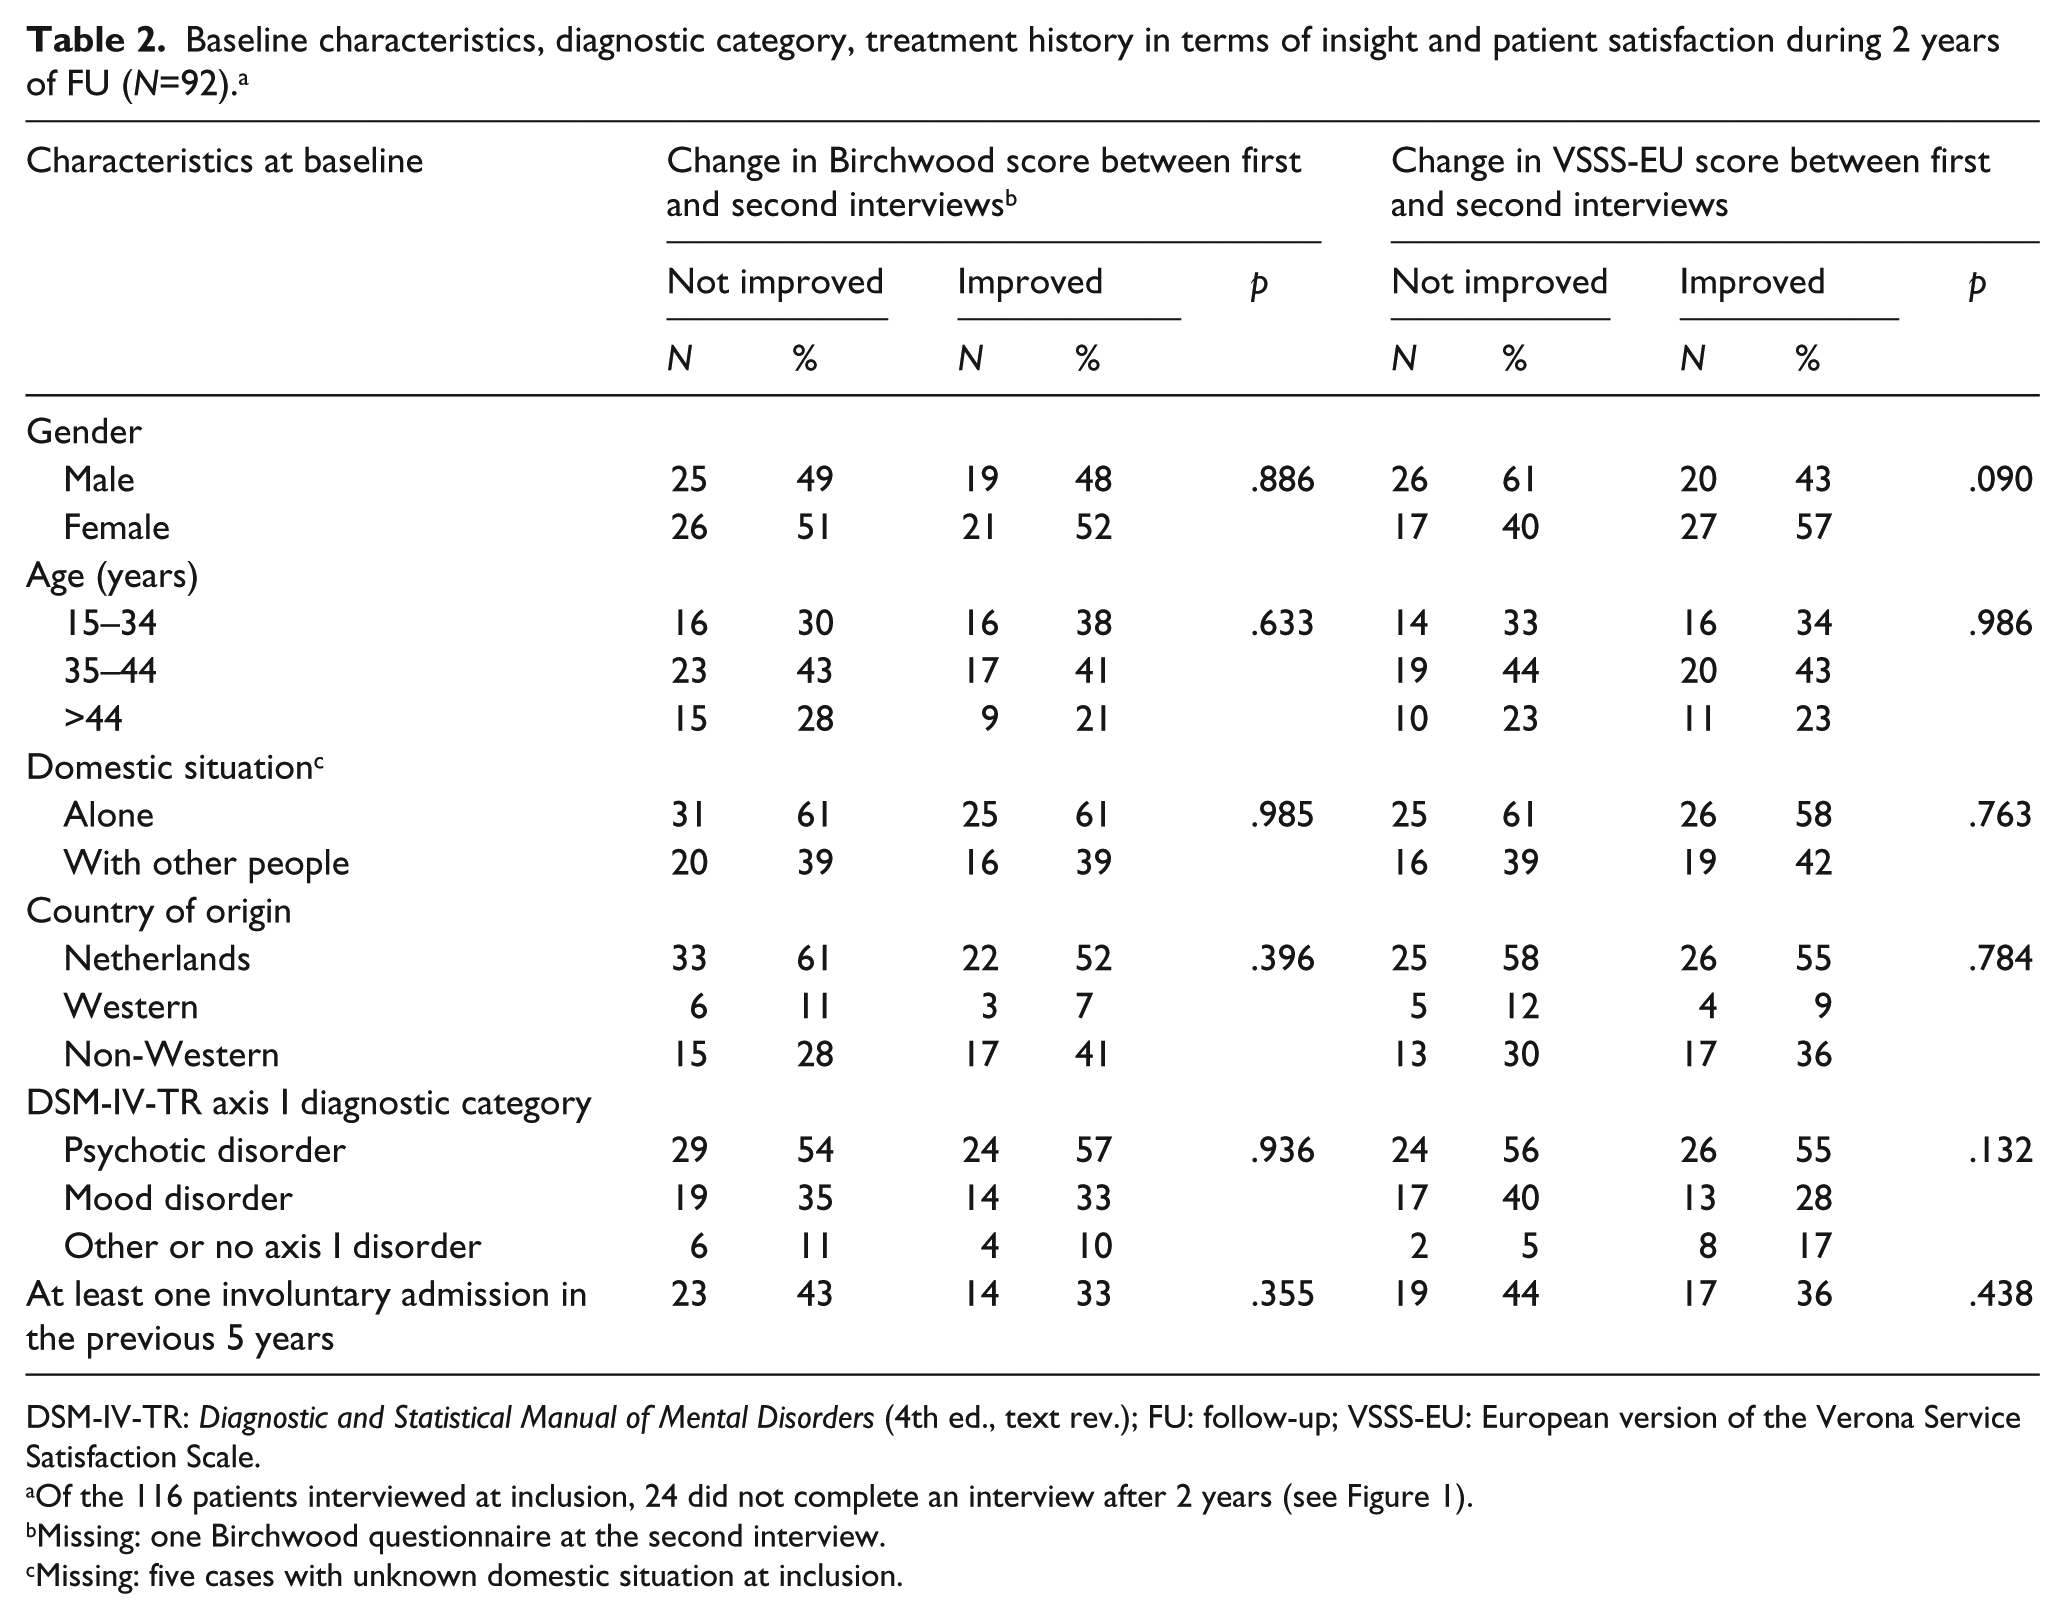
DSM-IV-TR: Diagnostic and Statistical Manual of Mental Disorders (4th ed., text rev.); FU: follow-up; VSSS-EU: European version of the Verona Service Satisfaction Scale.
Of the 116 patients interviewed at inclusion, 24 did not complete an interview after 2 years (see Figure 1).
Missing: one Birchwood questionnaire at the second interview.
Missing: five cases with unknown domestic situation at inclusion.
To determine whether any improvements in the level of insight and patient satisfaction in the first two follow-up years were correlated with mental health-care consumption in the same period, we analysed the correlation between level of insight (Birchwood Insight Scale), patient satisfaction (VSSS-EU) and total health-care consumption (ICS score) between the first and second interviews using Pearson’s correlation test (Table 3).
Correlations between ICS score, number of involuntary admissions in years 1 and 2 and change in insight and patient satisfaction between first and second interviews. a
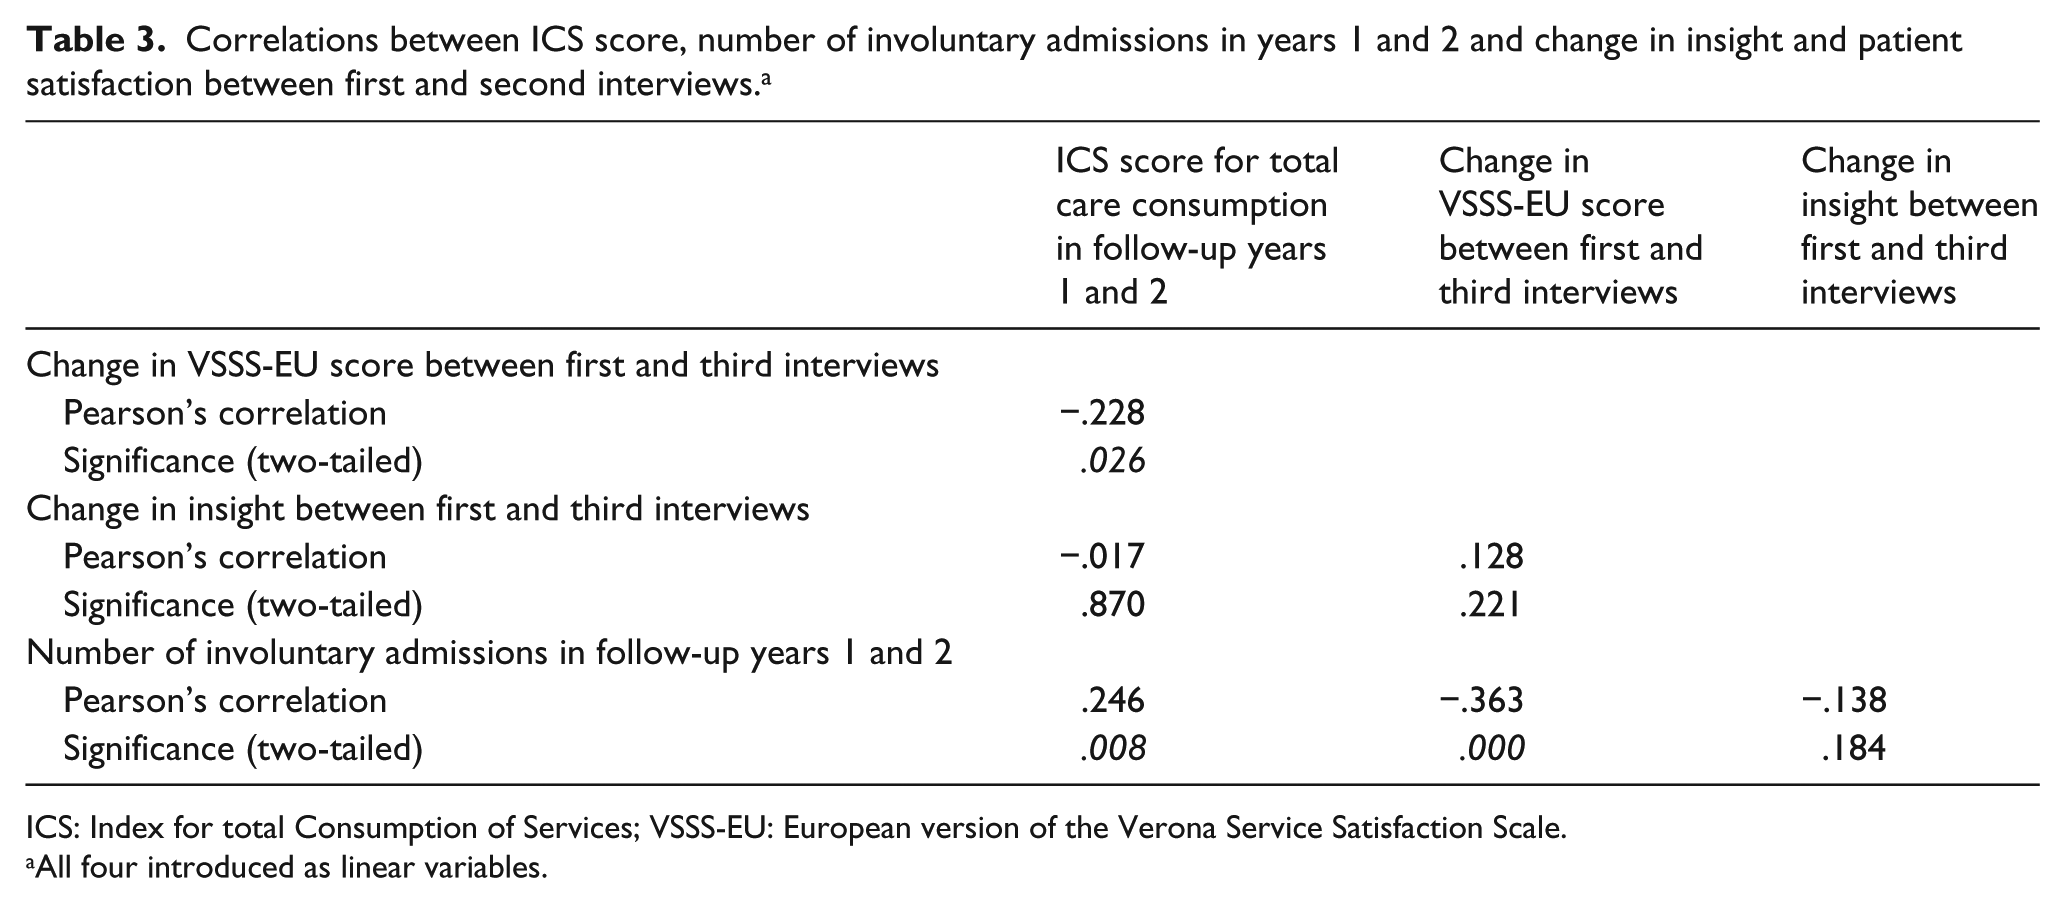
ICS: Index for total Consumption of Services; VSSS-EU: European version of the Verona Service Satisfaction Scale.
All four introduced as linear variables.
Our next step was to conduct a bivariate analysis with Pearson’s chi-square test and independent samples t-tests to examine differences in socio-demographic factors, treatment history in the first two follow-up years, total care consumption in these 2 years, changes in insight (Birchwood Insight Scale) and patient satisfaction (VSSS-EU) between the first and second interviews in patients who underwent at least one involuntary admission in follow-up years 3–5 and patients who did not (Table 4).
Socio-demographic characteristics at the second interview, care consumption in years 1–2 and changes in patient perspectives during the first 2 years, grouped according to involuntary admissions in years 3–5 of FU (N=112). a

SD: standard deviation; FU: follow-up; ANOVA: analysis of variance; ICS: Index for total Consumption of Services.
Missing: 4 patients (of 116) with unknown care consumption in follow-up years 3–5.
Missing: 12 cases with unknown domestic situation at the second interview.
Fisher’s exact test.
ANOVA; of the 116 patients interviewed at inclusion, 24 were not interviewed after 2 years (see Figure 1).
Finally, we used stepwise logistic regression (more specifically, the ENTER method) to establish a prediction model for the incidence of civil detention in follow-up years 3–5. We calculated the odds ratios (ORs, with a 95% confidence interval (CI) of 95%) for the incidence of civil detention in this follow-up period with the variables in Table 4 being adopted as potential predictors (Table 5).
Prediction of incidence of involuntary admission in follow-up years 3–5; stepwise multivariate logistic regression (N=92). a
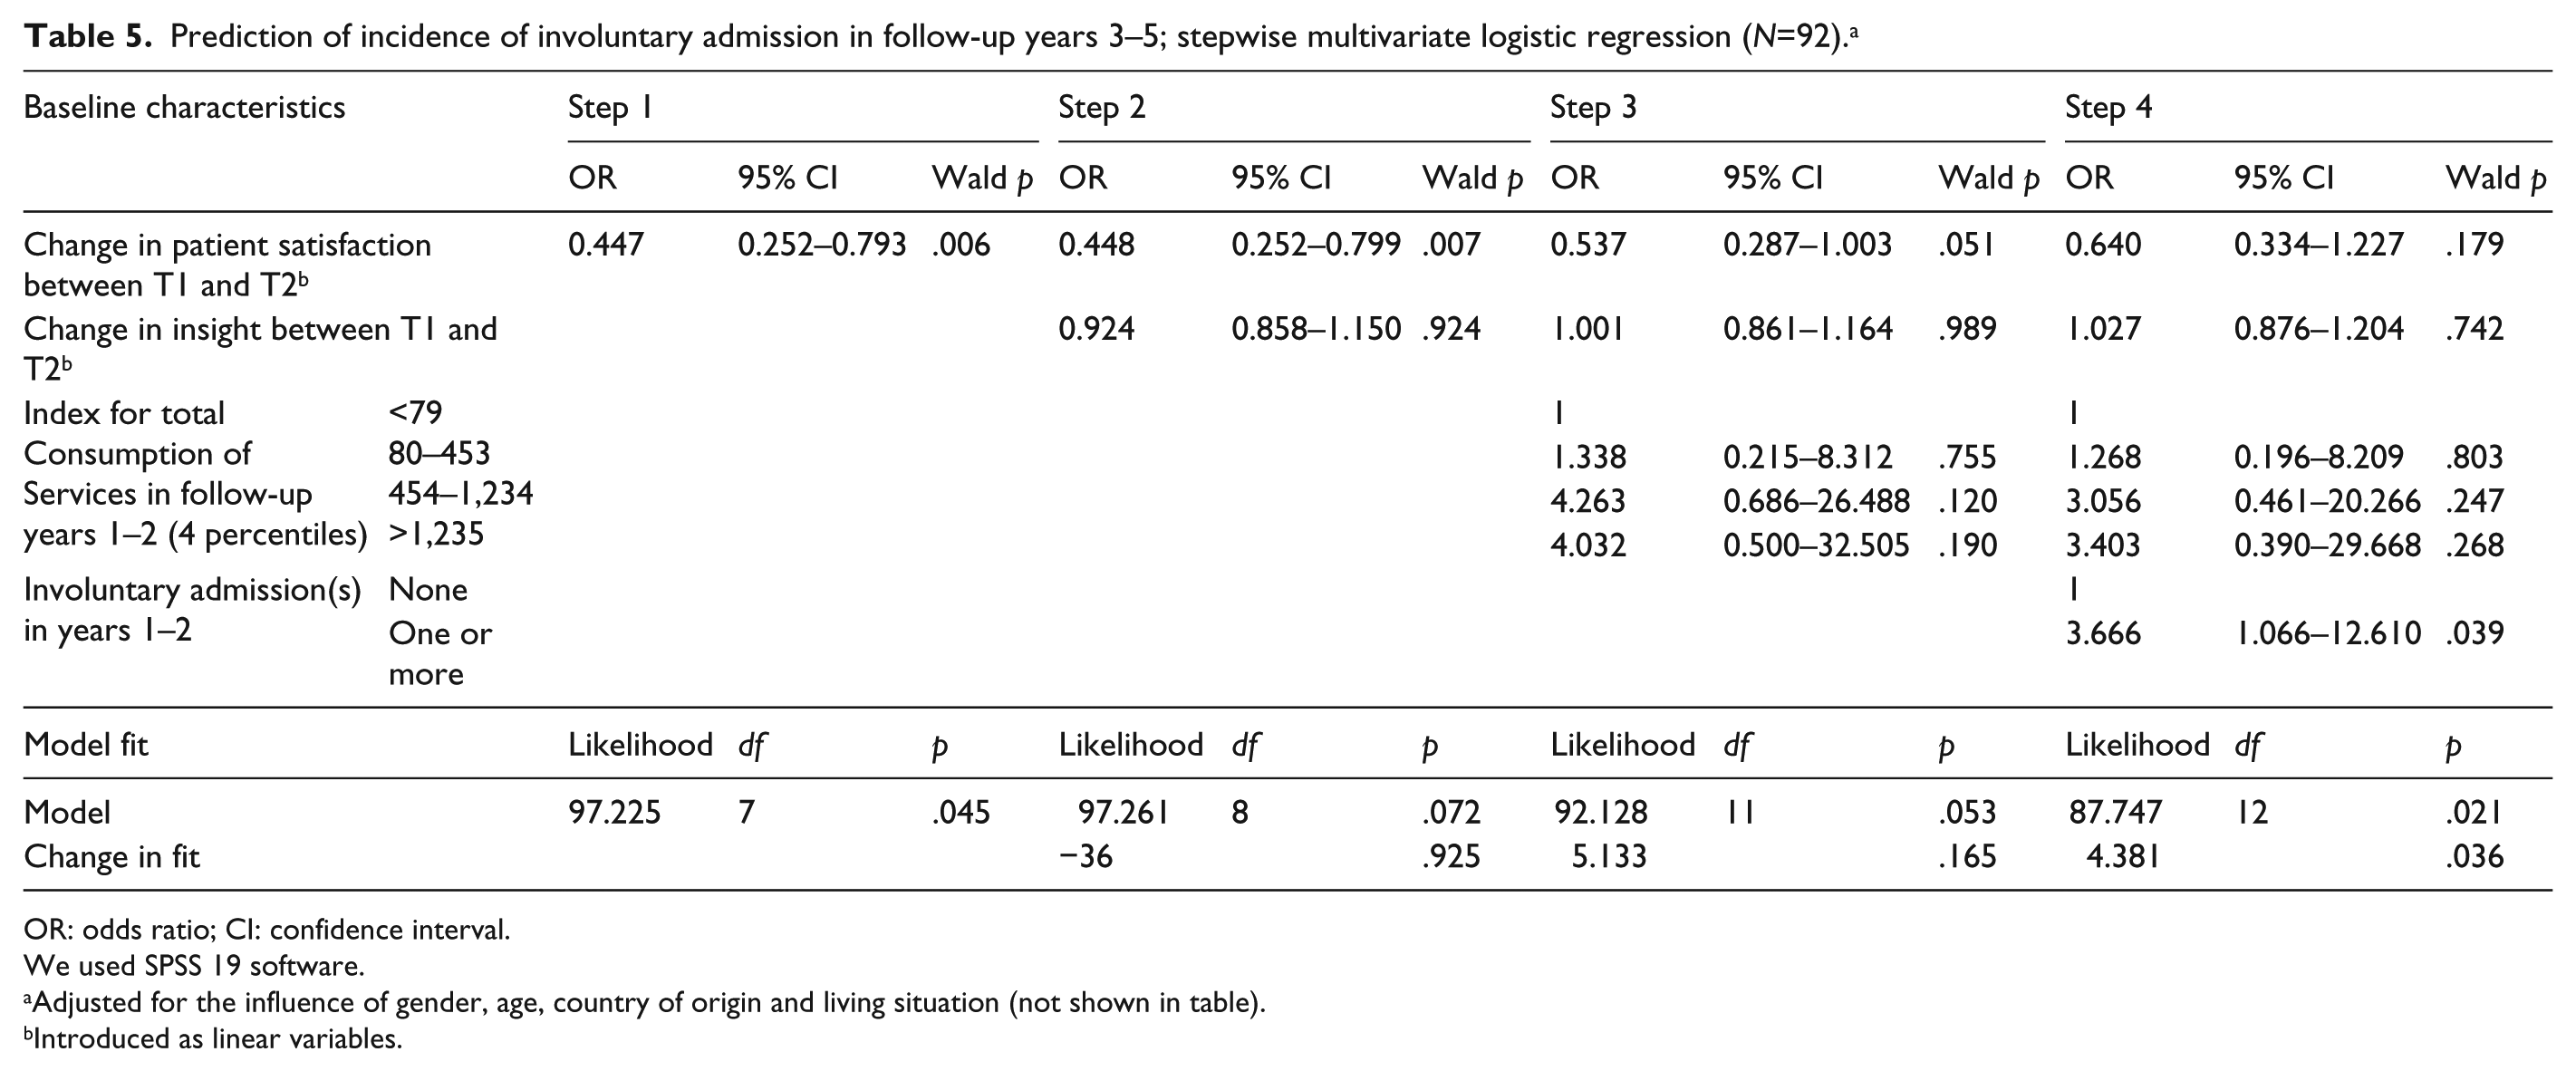
OR: odds ratio; CI: confidence interval.
We used SPSS 19 software.
Adjusted for the influence of gender, age, country of origin and living situation (not shown in table).
Introduced as linear variables.
Informed consent procedure and data security
Subjects eligible for the study cohort received a letter with the request to participate in the study. In the follow-up to this request, patients were contacted by a research assistant either by telephone, in writing or in person at their place of residence. Patients then received information verbally as well as in writing before they were asked to give written informed consent. The data about patient history and prior service use were gathered through anonymous pairing using the Amsterdam Mental Health Care Database (2006). The whole procedure was endorsed by the Medical Ethics Committee for Mental Health Care Institutions. Confidential information and participant names were subject to medical confidentiality rules and processed in accordance with the code of conduct for medical research developed by the Federation of Biomedical Scientific Societies.
Results
Composition of the study cohort and dropout
During the recruitment period, 602 eligible patients were identified. The research team was able to approach 424 patients in this total sample for informed consent to participate in the study.
We failed to contact 112 patients (26%) despite repeated attempts in phone calls or home visits; 99 (23%) refused to participate; 64 (15%) were too ill, either psychiatrically or physically, to give informed consent; 24 (6%) could not give informed consent because of language problems; 6 (1%) patients did not give informed consent for various other reasons, including 3 patients who died before we could contact them. This left a study cohort of 116 patients (Figure 1).

Flowchart Involuntary admitted patients included in research sample.
Representativeness testing and selection bias
The study sample of 116 patients was compared with the 483 eligible patients who were not included in the follow-up study. The patients we interviewed were significantly (p ⩽ .001) younger than the excluded patients: 37.8 (standard deviation (SD) = 10.4) and 42.2 (SD = 15.9), respectively. They were significantly (p ⩽ .001) less often classified as psychotic (58% and 70%, respectively) and diagnosed with a mood disorder more often than the excluded group (32% and 14%, respectively). There were no significant differences between the two groups in terms of gender, domestic situation, country of origin and history of previous involuntary admission.
Did levels of insight and patient satisfaction increase during the 2 years of follow-up?
Paired samples t-testing showed a significantly higher mean score for patient satisfaction at the second interview (mean = 3.77, SD = 0.56; p ⩽ .001) than at the first interview (mean = 3.26, SD = 0.65). Furthermore, a significant higher level of insight was found (on the Birchwood Scale) at the second interview (mean = 7.22, SD = 2.86) than at the first interview (mean = 6.34, SD = 3.18; p = .027; not shown in table).
Differences in socio-demographic and clinical characteristics at baseline between patients who showed an increase in patient satisfaction or level of insight during the 2 years of follow-up and patients who did not
Bivariate analyses identified no statistically significant differences for socio-demographic factors, clinical presentation or history of admissions or re-admissions in the previous 5 years between patients whose scores for level of insight and satisfaction increased between the first and second interviews and patients whose scores did not increase (Table 2).
Does an improvement in the level of insight and patient satisfaction correlate with total health-care consumption and the incidence of involuntary readmission in the first two follow-up years?
After 2 years, 92 patients were interviewed. During this observation period, 27 (29%) underwent at least one involuntary admission, with a range of 1–3 re-admissions. The mean number of involuntary re-admissions was 0.39 (SD = 0.68; not shown in table).
A significant positive correlation was found between the number of involuntary admissions and total care consumption in the 2 years of follow-up (all continuous variables; Pearson’s correlation = .246, p = .008). No significant correlations were found between a change in insight and these treatment parameters (Table 3).
There was a significant negative correlation between changes in the patient satisfaction score (VSSS-EU) and the total health-care consumption score (ICS) during the 2 years of follow-up (Pearson’s correlation = −.228, p = .026). A significant negative correlation was found between changes in patient satisfaction and the number of involuntary admissions in the 2 years of follow-up (Pearson’s correlation = −.363, p ⩽ .001; Table 3). Of the 65 patients who did not undergo any involuntary admission during this period, 45 (69%) had an increased satisfaction score. Of the 27 patients (29%) who underwent at least one involuntary admission, 15 (55%) had an increased satisfaction score (p = .02; not shown in table).
Differences between socio-demographic and clinical characteristics at the second interview and changes in the level of insight and patient satisfaction in follow-up years 1–2 by incidence of involuntary admission in follow-up years 3–5
Patients who underwent involuntary re-admission in the first two follow-up years also had a significantly higher percentage of re-admissions (50%) in follow-up years 3–5 than patients who did not undergo an involuntary re-admission in the first 2 years (22%, p = .002). Patients with one or more involuntary admissions in follow-up years 3–5 had a significant lower mean score for the change in patient satisfaction (mean = 0.36, SD = 0.69) than patients who were not re-admitted during this period (mean = 0.84, SD = 0.92; p = .026). A difference of this kind was not found in the mean score for change in insight (p = .998).
Do patients with improved insight and patient satisfaction have a lower risk of involuntary admission in follow-up years 3–5?
All variables in Table 4 were adopted as potential predictors for the risk of involuntary admission in follow-up years 3–5 and were introduced in the multivariate stepwise logistic regression analysis using the ENTER method (Table 5). In the first step, the socio-demographic characteristics and the changes in patient satisfaction were introduced in the analysis. There was a significant reverse correlation between the change in satisfaction and the incidence of involuntary admission in follow-up years 3–5 (OR = 0.445, 95% CI = 0.252–0.793; Wald p = .006). There was no significant correlation between the change in insight, which was introduced in the second step, and the outcome measure (OR = 0.924, 95% CI = 0.858–1.150; Wald p = .924). There was also no significant correlation between the ICS score, which was introduced in the third step, and the outcome measure (Wald p ⩾ .05 for all values). Finally, the history of involuntary admissions in follow-up years 1–2 was introduced, and it was found to be significantly correlated with the outcome (OR = 3.666, 95% CI = 1.066–12.601; Wald p = .039), while the association with the change in satisfaction was no longer found to be significant after this final step (OR = 0.640, 95% CI = 0.334–1.227; Wald p = .179; Table 5).
Discussion
Summary of findings
This study was unique, to our knowledge, in its prospective design and long follow-up period and in measuring changes in patients’ views about their illnesses and changes in their satisfaction with psychiatric treatment after involuntary admission. The four main findings emerged from this study. First, an increase in insight and patient satisfaction scores (during treatment) between the first and second interviews was found. Second, an increase in patient satisfaction proved to be reversely correlated with the level of mental health-care consumption and the incidence of involuntary re-admission in the same period. Third, increasing patient satisfaction in the first two follow-up years was significantly associated with a lower risk of compulsory re-admission in the subsequent follow-up period, but this association proved to be dependent on a history of involuntary admissions in the first two follow-up years. A history of involuntary admissions proved to be the only independent predictor of involuntary re-admission.
Findings in the context of the literature
Our finding that the Birchwood Insight Scale lacks predictive value for the risk of involuntary re-admission confirms the earlier findings in our ASAP study (van der Post et al., 2014). The fact that Drake et al. (2007) found a significant association between a low level of insight (measured with the same questionnaire) and the number of re-admissions in a follow-up period of 6–18 months is not inconsistent with our findings since that study did not address the legal aspects of the admissions.
The negative correlation between increasing patient satisfaction and the incidence of involuntary admissions in the same observation period is in line with the finding that involuntary admissions can predict lower levels of patient satisfaction (Greenwood et al., 1999; Katsakou & Priebe, 2006; van der Post et al., 2014). Low patient satisfaction and involuntary admissions are clearly correlated: involuntary admission may predict low satisfaction and vice versa.
Furthermore, the identification of a history of involuntary admissions as a predictor of re-admission in earlier ASAP studies was confirmed for this specific sample of high-risk patients. Living alone, which previous studies have identified as an independent predictor, was not found to be linked to the risk of involuntary re-admissions for this sample (Becker et al., 1997; van der Post, Mulder, et al., 2012). It would seem to be the case that, in this specific group of high-risk patients, two-thirds of whom live alone, living situation does not make any difference.
Clinical implications and conclusions
At first sight, the significant improvement in insight and patient satisfaction during treatment after involuntary admission would seem to be a positive finding. However, this positive development in patient thinking about their illness and their treatment was found to have only a limited effect on the outcome. Neither the scores as such nor the improvement in insight over time appears to reduce the risk of the dangerous relapses that make involuntary admission necessary. As for the relationship between improved satisfaction and the risk of new involuntary admissions, the conclusion is more ambiguous. Improved satisfaction in itself was not found to be an independent predictor of a lower risk of involuntary re-admission. The improvement in patient satisfaction over time is correlated with the incidence of involuntary admissions during the observation period. Although this co-variance proved to be far from absolute – some patients showed improved satisfaction unless they underwent an involuntary admission during the observation period – the reverse correlation between patient satisfaction and the incidence of involuntary admissions was confirmed by our data. In the end, a history of involuntary admission proved to be the only observed variable that was an independent predictor of involuntary re-admissions for this sample of high-risk patients.
The ultimate aim of the ASAP programme is to identify patient-related and care-related factors that can be tackled through changes in treatment programmes in order to reduce the number of involuntary admissions. The findings of this quantitative study do not give us much to go on in terms of reducing the number of involuntary admissions for high-risk patients. The next step for the ASAP research programme should, therefore, be to develop a qualitative in-depth study of the specific risk factors for a small group of high-risk patients with serious and persistent mental illnesses.
Limitations
This study suffered from a few limitations. First, psychotic cases were significantly under-represented in the sample. We may, therefore, have missed cases that may have had a high risk of involuntary re-admission during follow-up. Because of under-representation, it is difficult to generalise our results to the whole population. However, we cannot be sure in which way exactly the under-representation of high-risk patients could affect our final results and conclusions. The complexity of the topic and the difficulties in studying specific issues call for cautious conclusions.
Second, we did not assess the psychiatric diagnosis during the second interview. It was not, therefore, possible to use the baseline characteristics in the second follow-up period to examine the possible differences in psychiatric diagnosis between the first and second interviews in psychiatric patients who underwent at least one civil detention in follow-up years 3–5 and psychiatric patients who did not. Furthermore, it was not possible to compare the psychiatric diagnoses in terms of the baseline characteristics in the first follow-up period and the baseline characteristics in the second follow-up period.
Footnotes
Acknowledgements
The authors wish to thank the patients who took part in the study and also the participating psychiatric clinicians from the Psychiatric Emergency Service Amsterdam. K.S. and L.F.M.v.d.P. conducted the statistical analyses and wrote this article. L.F.M.v.d.P. developed the ASAP’s research programme design and was the principal investigator. J.P. supervised the statistical analyses. J.J.M.D. led the project, participated in the design and revised this article. All co-authors read this article and made comments.
Declaration of Conflicting Interests
Dr Dekker reports receiving research grants from Eli Lilly that were not related to this specific study. The other authors report no competing interests.
Funding
The author(s) disclosed receipt of the following financial support for the research, authorship, and/or publication of this article: This work was financially supported by ARKIN Mental Health Care, Amsterdam, the Netherlands, and by a grant from the Foundation for Support VCVGZ, Arnhem, the Netherlands.