



Abstract
Liberal ideology promotes equality whereas conservative ideology justifies inequality. Four studies examined whether the liberal–conservative continuum moderates the relation between inequality and subjective well-being (SWB). All four studies found a significant moderator effect such that higher inequality was related to greater SWB in conservative countries. In liberal countries, the corresponding relation was mostly reversed but did not reach significance. Studies 2 and 3 also showed that the moderator effect of liberalism was itself moderated by socioeconomic status (SES)—it was stronger among lower SES individuals. These two studies also found that the moderator effects of both liberalism and SES were partially or fully mediated by financial satisfaction. The current findings explain why previous research on the relation between income inequality and SWB produced inconsistent results.
Over the last 40 years, epidemiological research showed strong links between income inequality and a myriad of social ills (for reviews, see Pickett & Wilkinson, 2015; Wilkinson & Pickett, 2009). Pickett and Wilkinson (2015) asserted that although inequality is more damaging to the poor, 90% to 95% of the population would benefit from greater equality. They attributed the ill effects of inequality to low social cohesiveness and social divisiveness.
As noted by Cheung (2018), however, when it comes to the relation between economic inequality and subjective well-being (SWB), the findings are mixed (see Schneider, 2016, for a review, and Ngamaba, Panagioti, & Armitage, 2017, for a meta-analysis). Some studies showed the predicted negative relation (e.g., Verme, 2011), but others showed no relation (e.g., Berg & Veenhoven, 2010) or even a positive relation (e.g., Cheung, 2016). One possible explanation of the inconsistent results is that the relation between inequality and SWB is moderated by a third variable. The rationale for the existence of a moderator is also reinforced by the fact that alongside the literature on the aversive effects of inequality, there is diametrically opposed literature on the benefits of hierarchy. To begin with, social scientists noted that hierarchical structures are a common feature of both groups and individuals (Halevy, Chou, & Galinsky, 2011; Sidanius & Pratto, 1999). This prevalence gave rise to functional models of hierarchy, which suggest that hierarchies make several positive contributions to the group, including the reduction of conflicts and the increase in coordination, which, in turn, can improve performance (Halevy et al., 2011; Halevy, Chou, Galinsky, & Murnighan, 2012; Magee & Galinsky, 2008). In light of these functions, it is not surprising that people appear to have a predisposition to form and maintain hierarchical systems (Lane, 1959; Sidanius & Pratto, 1999), and to have a positive view toward them. For example, Friesen, Kay, Eibach, and Galinsky (2014) found that people saw hierarchies as more structured, orderly, and efficient; equality, however, was rated as more fair and natural.
It thus appears that the view of inequality as the source of all evil is replaced with a formulation more akin to a tug of war between two forms of social structure. As Friesen et al. (2014) put it, “It seems that the drive toward egalitarianism is often thwarted by basic and countervailing psychological needs” (p. 590); presumably, those will include the needs for order, stability, and predictability. Several models have been proposed to account for the origin of the acceptance, if not promotion, of hierarchical social structures. For example, social dominance theory (Sidanius & Pratto, 1999) described a number of hierarchy-attenuating and hierarchy-enhancing ideologies that can be used in the effort to establish group-based equality or hierarchy. Duckitt (2001) proposed a dual system model where political ideology can originate from either a competitive-dominance drive (based on the view that the world is a competitive jungle) or a threat-driven control motivation (based on the view that the world is dangerous and threatening). These two motives are associated with cultural or world views of, respectively, (a) economic conservatism versus egalitarianism, and (b) social conservatism versus autonomy and freedom. The emergence of social democracy in this model depends on the existence of both world views at their anti-conservative ends, that is, when egalitarianism is combined with freedom.
The existence of cultural ideologies that favor hierarchical arrangements versus ideologies that promote egalitarianism and personal freedom might be the reason why inequality is not consistently related to SWB. Research on cultural fit (e.g., O’Reilly, Chatman, & Caldwell, 1991) indicates that culture shapes people’s conception of what reality should look like, what to expect, and what is right and wrong. In a similar vein, we would expect people to feel better when economic reality is consistent with cultural tenets. It follows that the relation between inequality and SWB might be moderated by whether the culture opposes or condones inequality. Following a meta-analytic review by Jost, Glaser, Kruglanski, and Sulloway (2003), we propose that this moderator is the continuum running from liberalism to conservatism.
As a political worldview, liberalism espouses freedom (e.g., freedom of the press, freedom of religion) and equality (e.g., equal civil rights, equal rights to property, abolition of hereditary privileges), the two cultural views that according to Duckitt (2001) must be present in order for social democracy to emerge. Lack of freedom indicates that some groups have less rights than others, and economic inequality implies disparities in entitlements and wealth—all anathema to liberal ideology (Giddens, 1998; Jost et al., 2003). Political conservatism, on the contrary, promotes traditional institutions, hierarchy, and authority. Social and economic inequalities are promoted as they represent to conservatives the natural and more traditional order of things. As put forward by Jost et al. (2003), “The core ideology of conservatism stresses resistance to change and justification of inequality . . . ” (p. 339).
The Current Investigation
We predicted that differences among societies along the liberalism–conservatism continuum would moderate the relation between economic inequality and SWB. Note that both liberalism and economic inequality are measured at the aggregate (national), not individual level. Note also that the prediction of a moderator effect (i.e., the prediction of Inequality × Liberalism interaction) can take a strong or a weak form. The strong prediction is that we will find a complete crossover interaction, for example, a relation between lower inequality and greater SWB in liberal countries and a relation between higher inequality and greater SWB in conservative countries. The weak prediction is that only one of these two relations will materialize. Both predictions were examined in four studies, using aggregate data in Studies 1 and 4 and individual data in Studies 2 and 3. Studies 2 and 3 also examined the roles of socioeconomic status (SES) and financial satisfaction as, respectively, a potential moderator and a potential mediator in our model. The rationale for including these two variables in the model will be presented in the introduction to Study 2.
We need to note differences between the present studies and two previous investigations on similar topics. Onraet, Van Hiel, and Cornelis (2013) showed a relation between national threat (a composite of inflation, unemployment, gross domestic product [GDP], homicide rate, and life expectancy) and right-wing attitudes. More recently, Onraet, Assche, Roets, Haesevoets, and Van Hiel (2017) found that the relation between national threat (measured in the same way as in the previous study) and well-being was moderated by individual liberal–conservative attitudes such that right-wing or conservative attitudes were related to well-being in countries with high threat but not in countries with low threat. The Threat × Liberalism interaction that was obtained appears similarly to the Income Inequality × Liberalism interaction that we predict. However, a number of differences between the studies also exist.
First, the threat variable in the Onraet et al. (2017) study did not include income inequality and, as such, their results do not resolve the problem of inconsistent relation between income inequality and well-being. Second, our prediction concerns liberalism at the national, not individual level (the question of whether liberalism at the individual level operates as liberalism at the national level was addressed in Study 4; importantly, the inconsistent relations between inequality and SWB were also obtained at the aggregate, not individual, level). Third, Studies 2 and 3 examined two predictions that Onraet et al. (2017) did not address: the possible moderator effect of SES and the possible mediation role of financial satisfaction.
An even earlier study by Napier and Jost (2008; Study 3) examined self-reported happiness in the United States as a function of economic inequality and party affiliation (an index of liberalism). It was shown that happiness declined at higher inequality, but the decline was only significant for participants declaring themselves as Democrats. Two of the three differences between the Onraet et al. (2017) study and the current investigation also distinguish the latter from the Napier and Jost (2008) study. Specifically, we are testing liberalism at the national, not individual, level and, unlike Napier and Jost (2008), we are testing the roles of SES as a moderator and of financial satisfaction as a mediator of the predicted Income Inequality × Liberalism interaction. In addition, the present model entertains the possibility that higher inequality might be related to higher SWB in conservative countries; the corresponding relation was null in Napier and Jost (2008, Study 3).
Study 1
The purpose of Study 1 was to examine how income inequality and liberalism, both measured at the national level, predict SWB, controlling for other national characteristics (e.g., GDP per capita) that potentially impact SWB. Measures for these variables were compiled from different sources as detailed below.
Sample
The necessary data were available for 88 countries. Assuming that the size of the moderator effect of liberalism (Gini × Liberalism interaction) is medium (r = .30), the statistical power is .82.
Measures
Liberalism
Searching for a liberalism measure, we considered Hofstede, Hofstede, and Minkov (2010)’s six cultural dimensions (https://www.hofstede-insights.com). These dimensions were meant to represent how countries cope with major issues that every society faces. The scoring of different countries on these values was based on surveys, which were initially conducted in 1967-1973 and then repeated in the 1990s and 2000s.
One of the six values, power distance, appeared relevant to liberalism because it reflects the extent to which people accept (or object to) power inequality. According to Duckitt (2001), Hofstede et al.’s (2010) power distance corresponds to the economic conservatism (vs. egalitarianism) element in his dual system model. The second element in Duckitt’s (2001) model—social conservatism (vs. freedom)—corresponds to another Hofstede’s value—collectivism (vs. individualism) as well as to Braithwaite’s (1994) value dimension of national strength and order. The elevation of the collective over the individual (Hofstede et al.’s, 2010, collectivism value) and the emphasis on protecting the sovereignty of the nation (Braithwaite, 1994, national strength value), likely represent national ideology, an interpretation that is consistent with the link of social conservatism with the view that the world is a dangerous place in Duckitt’s (2001) model.
As social democracy (liberalism in our model) incorporates both egalitarianism and freedom in Duckitt’s (2001) model, it ought to incorporate their equivalents, low power distance and high individualism, in Hofstede et al.’s (2010) system. Furthermore, Duckitt (2001) theorized that these two elements are associated, which is an issue that can be examined empirically. Accordingly, we obtained the six Hofstede’s values for the countries in our sample and examined their structure via a principal axis factoring analysis followed by oblimin rotation. Three factors emerged (eigenvalues > 1). Power distance and individualism loaded more than .78 on the first factor, accounting for 32% of the variance (lower power distance correlated .60 with higher individualism); cross loadings by other values on this factor, and by power distance and individualism on other factors, were less than .32. On the basis of these results, we combined power distance with individualism (after reversing scores for the former) to create a liberalism composite such that high scores indicated higher liberalism.
Income inequality
Income inequality was measured by the Gini index of family income; the index can range from 0 to 1 (higher values indicate higher inequality). Gini values for 2005-2009 were obtained from the World Bank website (http://databank.worldbank.org) and averaged across the years.
SWB
SWB was a composite of two measures—life satisfaction and positive affect— administered to a representative sample in each country as part of a survey by the Gallup World Poll, conducted in 2005-2009. Life satisfaction was measured with Cantril’s (1965) 11-step ladder, ranging from 0 to 10, with higher steps representing greater satisfaction for respondents. Positive emotion was measured by asking participants whether they smiled/laughed and whether they experienced enjoyment (1 = yes, 2 = no) during the previous day. After reversing the individual scores for these two questions and combining them, these averages and life satisfaction were standardized and combined into a SWB composite (α = .77); higher scores indicated greater SWB.
Control variables: GDP
GDP per capita was collected from the CIA World Factbook (https://www.cia.gov/library/publications/the-world-factbook/). The values were in U.S. dollars. They were log transformed due to skewness.
Life quality
This was a composite, comprising six variables that were used by Zuckerman, Li, and Hall (2016) in research on gender differences in self-esteem. The first variable, education, was itself a composite of three measures obtained from the World Bank (databank.worldbank.org), and reflecting various education accomplishments (e.g., literacy rates). The remaining five variables were obtained from the World Fact Book and included infant mortality (number of deaths/1,000 live births), percentage of population in urban areas, life expectancy, number of physicians/1,000 population, and percentage of population below poverty. Infant mortality, life expectancy, and poverty were log transformed due to skewness. The six variables were standardized and combined (infant mortality and poverty were first reverse scored; α = .87).
Government services
We obtained two indices of government services from the World Fact Book, health expenditures and educational expenditures, both calculated as percentage of GDP. They were standardized and combined into a single composite.
Religiosity
Relevant data were collected by the Gallup World Poll (2005-2009) and published in Diener, Tay, and Myers (2011, Table 4). For each country, Diener et al. (2011) presented the percentage of respondents who answered yes to the question: “Is religion an important part of your life.”
Results and Discussion
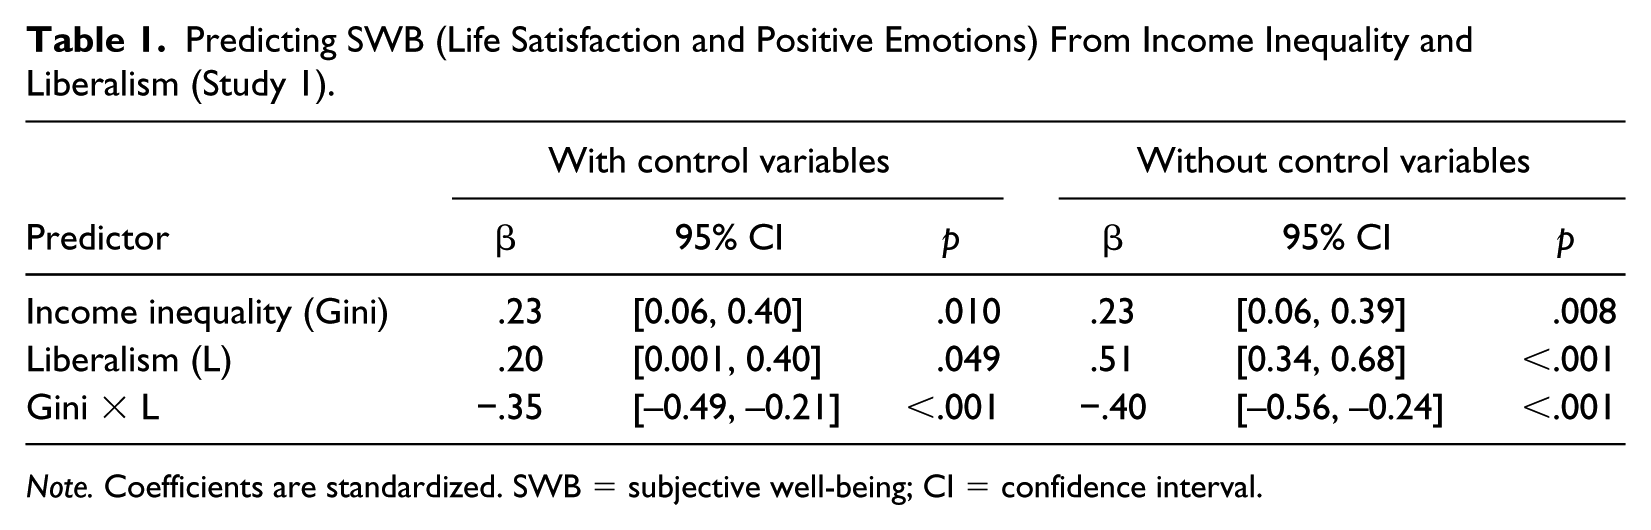
Correlations among all the variables are presented in Section A (Table A1) in Supplementary Materials. The SWB scores were examined in hierarchical regression analyses with countries as units of analysis. The four control variables, Gini, and liberalism were entered as predictors in Step 1; the Gini × Liberalism was entered in Step 2. The main results are displayed in the left part of Table 1. The analysis was repeated but this time without control variables and the results are shown in the right part in Table 1.
Predicting SWB (Life Satisfaction and Positive Emotions) From Income Inequality and Liberalism (Study 1).
Note. Coefficients are standardized. SWB = subjective well-being; CI = confidence interval.
Results for analyses with control variable showed that higher Gini (higher inequality) predicted greater SWB (p = .01) as did higher liberalism (p = .049). More importantly, we found a significant Gini × Liberalism interaction, β = −.35, t = −5.05, p < .001, and this moderator effect was significant also in an analysis without the control variables. Figure 1 presents SWB scores for high (+1 SD) and low (–1 SD) Gini and liberalism levels. Simple slopes analyses showed that at low liberalism, higher inequality was associated with greater SWB (β = .62, t = 5.87, p < .001). At high liberalism, the association between inequality and SWB was reversed but not significant, β = −.16, p = .21.
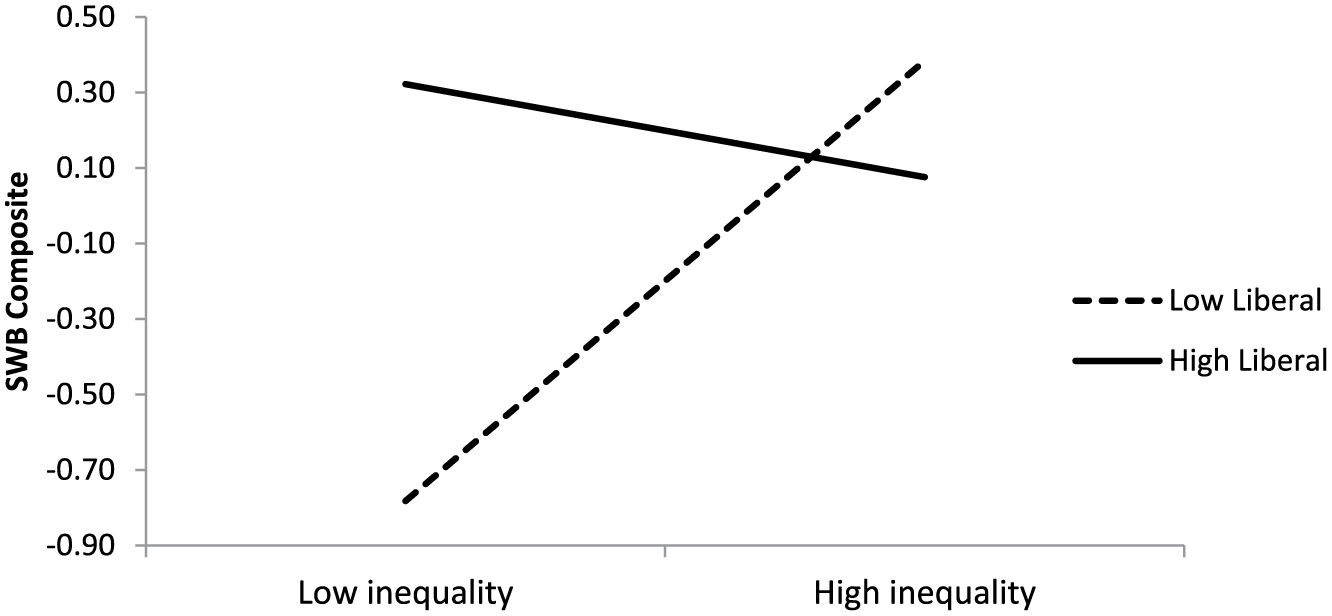
Predicting SWB from income inequality and liberalism (Study 1).
Repeating the simple slopes analyses, but now comparing high to low liberalism, showed that at low inequality, greater liberalism was associated with greater SWB, β = .59, t = 4.86, p < .001. At high inequality, the differences between high and low liberalism was reversed but the effect was not significant, β = −19, t = −1.46, p < .15.
The results showed that liberalism significantly moderated the relation between income inequality and SWB, but only the weak prediction of the model was supported. Specifically, at low liberalism, higher inequality was related to greater SWB but the corresponding relation at high liberalism was not significant. In Study 2, we planned to replicate these results with individual data.
Study 2
The data for Study 2 were obtained from the most recent World Value Survey (WVS), Wave 6. In addition to replicating Study 1, we also examined whether the moderator effect of liberalism will be moderated by SES and mediated by financial satisfaction.
The impetus for adding SES to the model came from system justification theory (Jost et al., 2003), which proposed that low SES individuals are more likely to support the system as a way of resolving the dissonance between their disadvantaged position and their willingness to acquiesce to their standing. Although there is support for this prediction (Jost et al., 2003), a recent large scale investigation by Brandt (2013) did not find the connection between lower status and justification. However, adding culture to the system justification model allows an understanding of how the process of dissonance reduction may work. It is possible, we thought, that low SES people are more likely to acquiesce to their low status in conservative countries because inequality fits the cultural norm. In other words, a conservative culture prevents potential opposition to inequality, channeling the low SES person into accepting their position and feeling good about it—reactions that reaffirm the cultural norm. If so, the moderator effect of culture will be even stronger for low SES people. It is worth noting that Brandt (2013) actually examined whether income inequality alone moderates the extent to which low SES groups legitimize the system and found either null or contradictory results. However, Brandt (2013) did not examine whether the cultural context also plays a role, an issue that is the focus of the current investigation.
We also tested whether the moderator effect of culture (the Gini x Liberalism interaction) is mediated by financial satisfaction. We assume that a person’s first reaction to income inequality is satisfaction or dissatisfaction with their own income relative to that of others. We expected that the more the culture justifies or promotes the level of income inequality in a given society, the more people will be satisfied with their own financial situation. Financial satisfaction, in turn, is a strong predictor of SWB (Ng & Diener, 2014). We therefore predicted that financial satisfaction would mediate the moderator effect of culture on SWB. Such mediation would also provide further support for our theoretical model.
Sample
WVS Wave 6 was administered to over 90,000 participants, age 18 or older, in 60 countries. Either full probability or a combination of probability and stratified methods were used to choose representative samples. Data for the necessary variables (SWB, Gini, liberalism, SES, financial satisfaction, and control variables at both country and individual levels) were available for 55,074 participants from 36 countries (51.0% female; average age was 43.04, SD = 16.84). 1 For analyses involving individual data, the power for this study (and the next, targeting Wave 5 of the WVS) was sufficient.
Measures
Liberalism and Gini
As in Study 1, the liberalism measure was a composite of Hofstede et al.’s (2010) power distance and individualism. Gini values were obtained from the World Bank for the years in which WVS Wave 6 was conducted and then averaged across these years.
SWB
As in study 1, SWB was measured by questions about life satisfaction and positive emotion (happiness). Life satisfaction was measured in the WVS with a 10-point scale: “All things considered, how satisfied are you with your life as a whole these days? 1 = completely satisfied, 10 = completely dissatisfied.” Happiness was measured with a 4-point scale: “Taking all things together would you say you are: 1 = very happy, 4 = not at all happy.” The two scales were reverse scored, standardized, and combined into a SWB composite (α = .63).
SES
SES was a composite made of questions about education, family income, and social class. Education was rated on a scale from 1 (no formal education) to 9 (university level education with degree). Family income was measured on a step scale that ranged from 1 (lower step) to 10 (tenth step). Social class was measured on a scale from 1 (lower class) to 5 (upper class). The three items were standardized and combined into a single SES composite (α = .61).
Financial satisfaction
Participants in the WVS rated on a 10-point scale how satisfied they were with the financial situation of their households (1 = completely satisfied, 10 = completely dissatisfied).
Control variables: Country level
Control variables at the country level were identical to those employed in Study 1 and were taken from the same sources. They included log transformed GDP per capita, quality of life, government services, and religiosity.
Control variables: Individual level
The WVS included a number of demographic variables that served as control variables. Those included gender, age, relationship status (rated as single or in a stable relationship), number of children (coded from 0 for no children to 3 for three or more), and religiosity. Religiosity was measured with three questions: “How important is religion in your life”? 1 = very important, 4 = not at all important; “Apart from weddings and funerals, how often do you attend religious services these days”? 1 = more than once a week, 7 = never, practically never; and “How often do you pray”? 1 = several times a day, 8 = never, practically never. Responses to the three questions were reverse scored, standardized, and combined into a religiosity composite (α = .81).
Results and Discussion
Main analyses
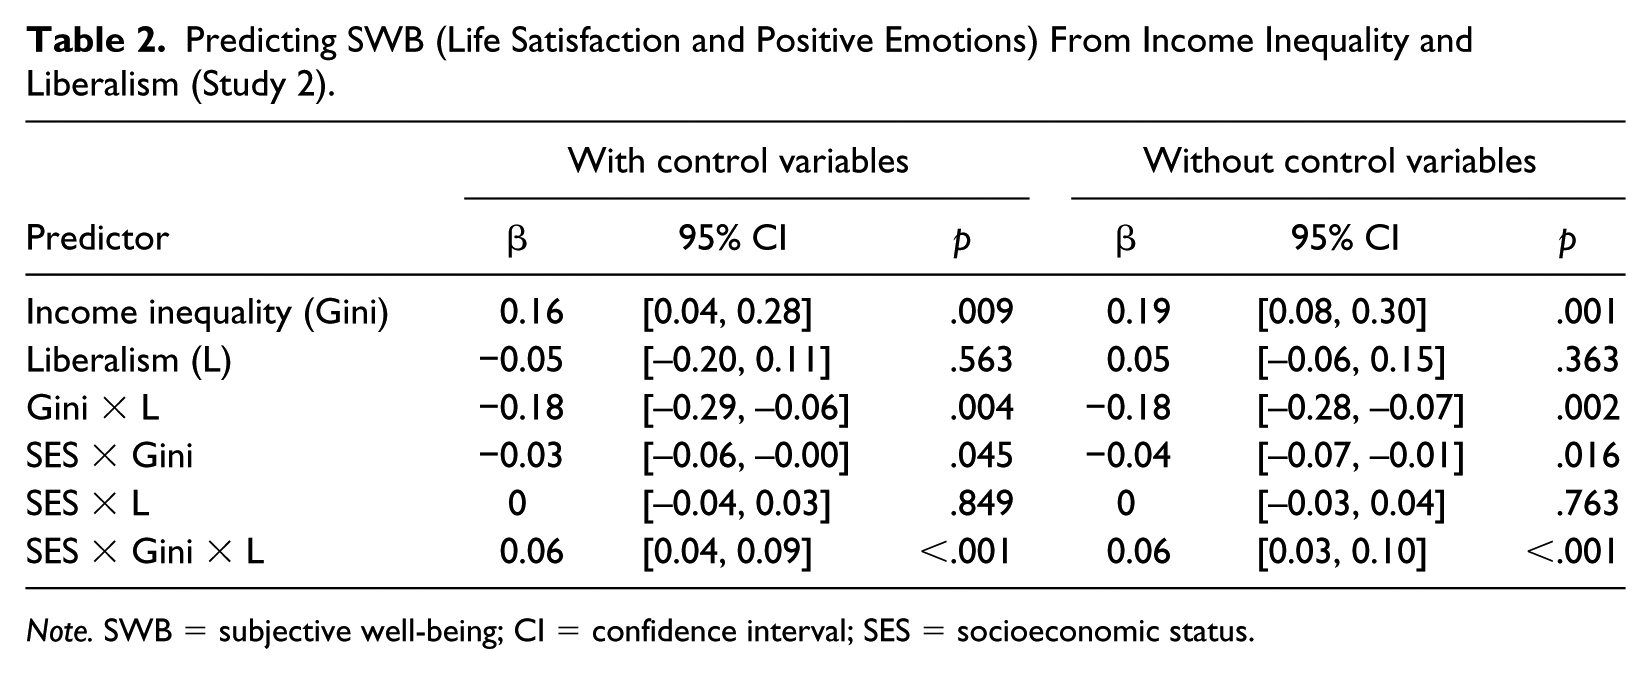
We conducted a two-level fixed and random effects regression model analysis to account for the nonindependent nature of the data with individuals nested in countries, and using restricted maximum likelihood estimation: within-country variables at Level 1 and between-country variables at Level 2. Fully unconditional model showed that 85.5% of variance in SWB was within-country (i.e., Level 1), and 14.5% of variance was between-country (i.e., Level 2). Level 1 variables included all the individual control variables plus SES and financial satisfaction. Each of these variables was centered at each country’s mean and all the effects were specified as random effects (for both intercepts and slopes). Level 2 variables included all the country control variable plus Gini and liberalism. Each of these variables was centered at the grand mean. All Level 1 and Level 2 data were standardized to obtain estimates that represent standardized coefficients. The model was run twice, once with control variables (see left part of Table 2) and again but without control variables (right part of Table 2). Correlation coefficients among all the country level variables and average SWB are presented in Section A (Table A2) in Supplementary Materials.
Predicting SWB (Life Satisfaction and Positive Emotions) From Income Inequality and Liberalism (Study 2).
Note. SWB = subjective well-being; CI = confidence interval; SES = socioeconomic status.
To test whether liberalism moderated the relation between Gini and SWB, we added to the model a Gini × Liberalism interaction term (see top part of Table 2). At the country level, the results (with control variables) showed that higher Gini predicted greater SWB (p = .009); liberalism was not related to SWB (p = .56). The effect of Gini was moderated by liberalism (β = −.18, t = −3.16, p = .004; see Figure 2). A similar moderator effect was obtained in the analysis without control variables.

Predicting SWB from income inequality and liberalism (Study 2).
Simple slopes analyses of the SWB composite, centering liberalism at low (–1 SD) and high (+1 SD) levels, showed that higher inequality (higher Gini) was related to greater SWB at low liberalism (β = .34, t = 4.21, p < .001); at high liberalism, the relation between Gini and SWB was not significant, p = .89. Additional simple slopes analyses, centering Gini at high and low levels, showed that greater liberalism was related to lower SWB at higher inequality (β = −.22, t = −2.24, p = .033); the relation reversed but was not significant at lower inequality (β = .13, t = 1.42, p = .17).
To test whether the Gini × Liberalism was moderated by SES, a Gini × Liberalism × SES and the relevant two-way interaction terms were added (see bottom part of Table 2). The results of this model (with control variables) showed a significant relation between the three-way interaction and SWB (β = .06, t = 4.67, p < .001; see Figure 3). A similar three-way interaction was obtained in the analysis without control variables. Simple slopes analyses, centering SES at −1 SD and +1 SD, showed that the Gini × Liberalism was significant at both high SES (β = −.12, t = −2.29, p = .029) and low SES (β = −.25, t = −4.32, p < .001), but the effect size was larger at low SES (see Section B in Supplementary Materials for additional simple slopes analyses).
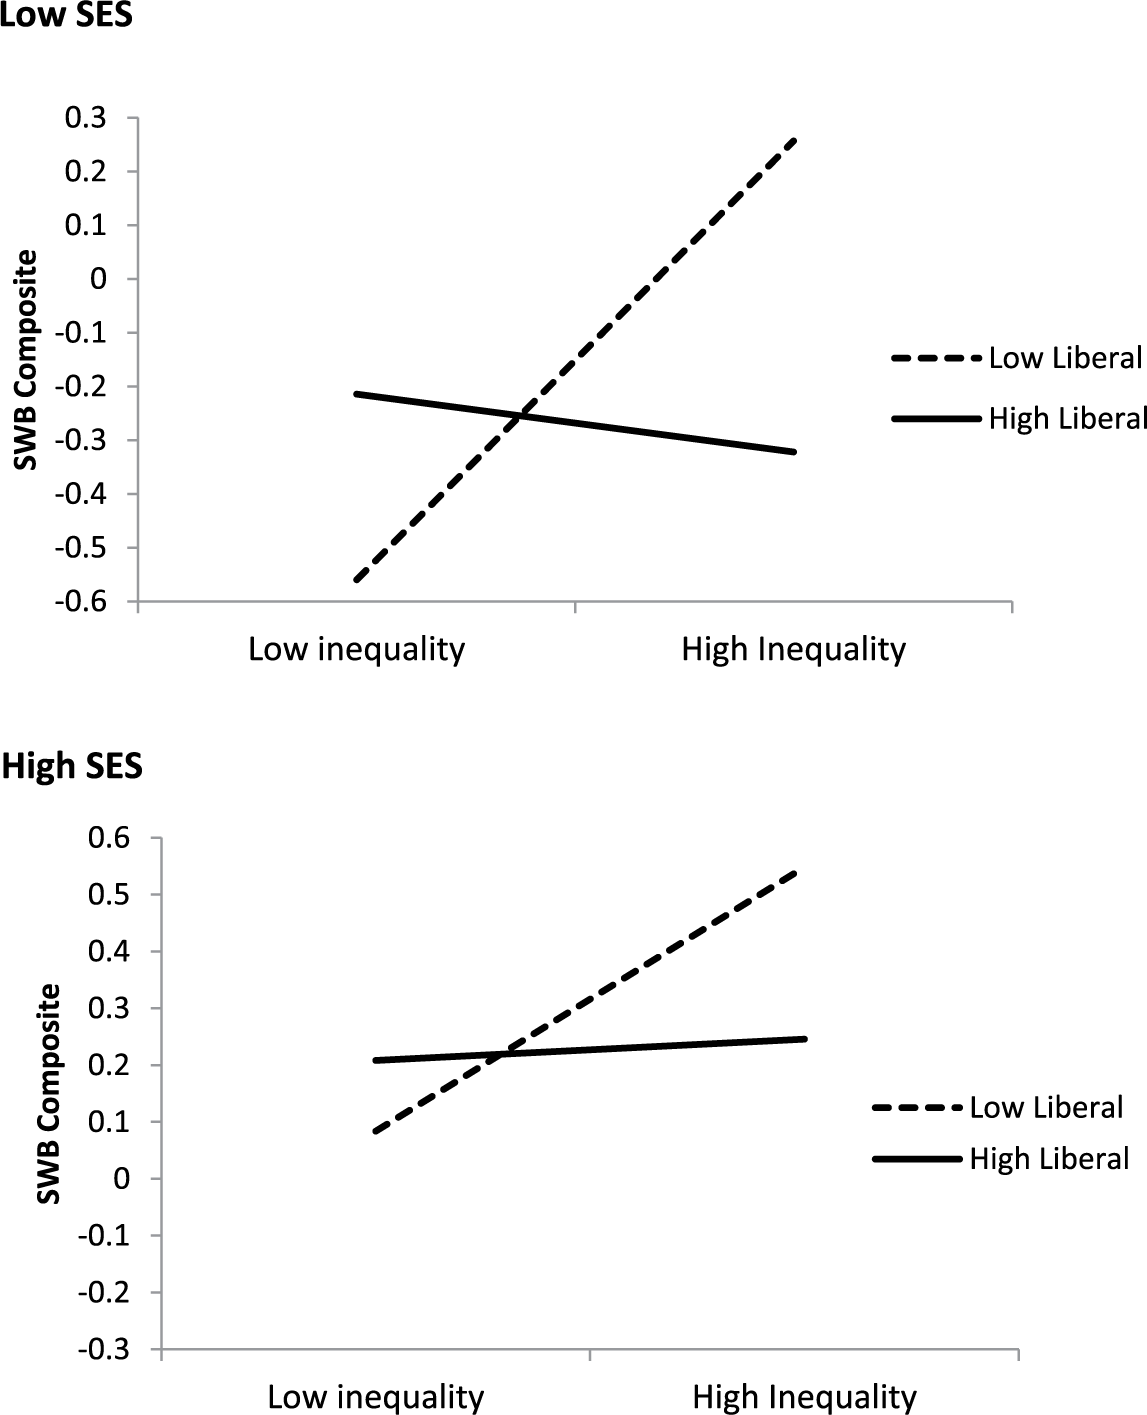
Predicting SWB from income inequality, liberalism, and SES (Study 2).
Mediation
Controlling for Gini, liberalism, all the country- and individual-level control variables, Gini × Liberalism was associated with financial satisfaction, β = −.08, t = −2.24, p = .033. Controlling for the same variables and the Gini × Liberalism interaction, financial satisfaction was associated with SWB, β = .32, t = 5.31, p < .001. Controlling for financial satisfaction reduced the direct association between Gini × Liberalism and SWB from β = −.18 to β = −.09, but it remained significant, p = .05 (see top half of Figure 4). Testing a mediation model with RMediation (Tofighi & MacKinnon, 2011) showed that the indirect effect estimate was significant, –0.03 (SE = 0.013), 95% CI [–.056, –.003]. Thus, there is support for the notion that financial satisfaction partially mediated the effect of Gini × Liberalism on SWB.
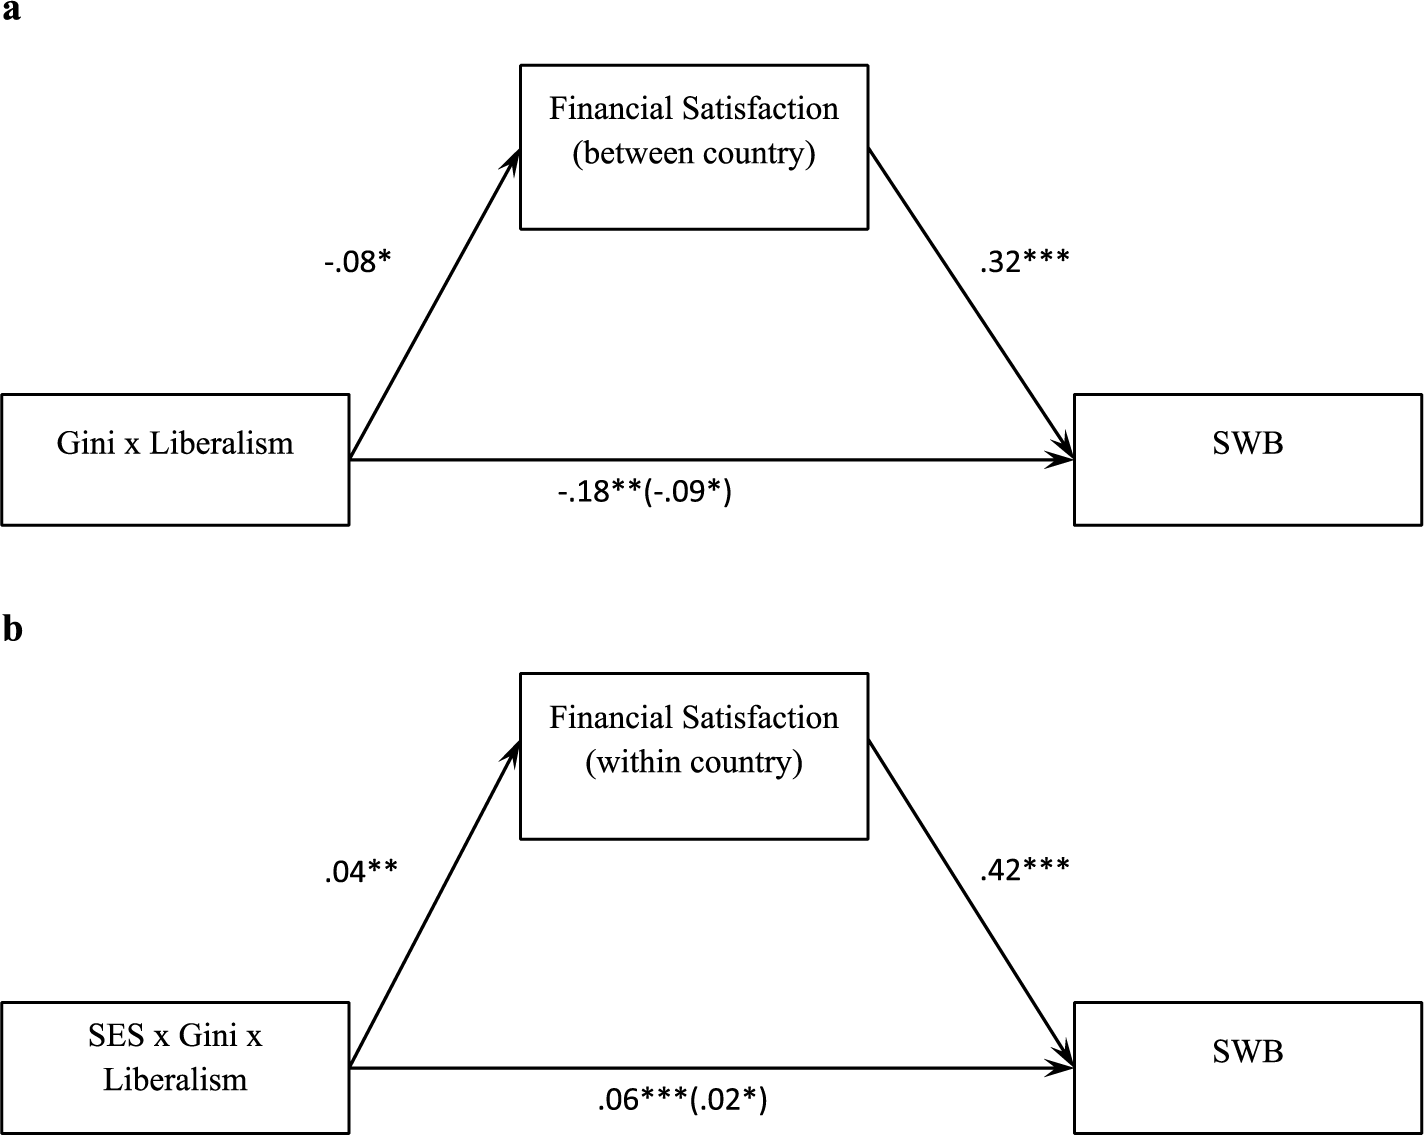
Mediation by financial satisfaction of the relation between (a) Gini × Liberalism and SWB and (b) between Gini × Liberalism × SES and SWB; coefficients in parentheses were obtained after controlling for financial satisfaction (Study 2).
We showed above that the moderator effect of liberalism was itself moderated by SES. As the rationale for why financial satisfaction should mediates the Gini × Liberalism effect on SWB also applies to the Gini × Liberalism × SES effect on SWB, we examined whether financial satisfaction also mediated the three-way interaction. Controlling for all lower level effects and the control variables at country and individual levels, Gini × Liberalism × SES predicted financial satisfaction (β = .04, t = 3.02, p = .005), and controlling for the same variables and the three-way interaction, financial satisfaction predicted SWB, β = .42, t = 18.02, p < .001. Controlling for financial satisfaction, the direct effect of Gini × Liberalism × SES on SWB dropped from β = .06 to β = .02, but it remained significant (see bottom half of Figure 4). Using, RMediation (Tofighi & MacKinnon, 2011), we found that the indirect effect was significant, β = .018 (SE = 0.006), 95% CI [.006, .030]. Thus, there is support for the notion that financial satisfaction partially mediated the effect of Gini × Liberalism × SES on SWB.
Overall, Study 2 replicated the moderator effect of liberalism that was found in Study 1. As before, the simple slopes analyses supported the weak prediction such that higher inequality was associated with better SWB at low liberalism; at high liberalism, the association was reversed but was not significant. We also found that the moderator effect of liberalism was itself moderated by SES such that the Gini × Liberalism interaction was more pronounced at low SES. In addition, the moderator effects of both liberalism and SES were partially mediated by financial satisfaction. We sought to replicate these results in Study 3.
Study 3
Sample
Data from Wave 5 of the WVS were available for 58,018 participants from 42 countries (52.6% female; average age was 41.85, SD = 16.72). Of the 42 countries, 25 were included in Study 2 and 17 were new.
Measures
Main variables
Liberalism and Gini were obtained from the same sources that were used in Study 2. SWB and SES were composites (αs = .67 and .68, respectively) based on the same WVS items used in Study 2, and financial satisfaction was also measured in the same way as in the earlier study.
Control variables: Country level
Control variables were again log transformed GDP per capita, quality of life, government services, and religiosity. GDP was taken from the same source as in Study 2 but now for the years in which WVS Wave 5 was administered. The remaining control variables were identical to those employed in Study 2 as the years in which they were collected remained appropriate for Wave 5.
Control variables: Individual level
Control variables at the individual level from Wave 5 of the WVS were the same as in Study 2 except for religiosity. Religiosity in Wave 5 was rated on a single 4-point scale: “How important is religion in your life? 1 = very important, 4 = not at all important.” Answers were reverse scored.
Results and Discussion
Main analyses
The data were analyzed with the same procedures and models that were used in Study 2. As before, all models were run twice, once with control variables (see left part of Table 3), and another time without them (see right part of Table 3). We reported correlation coefficients among all the country level variables and average SWB in Section A (Table A3) in Supplementary Materials. At the country level, adjusting for all control variables, higher Gini predicted greater SWB (p < .001) whereas liberalism was not related to SWB (p = .89). The Gini × Liberalism interaction was significant (β = −.15, t = −3.12, p = .004; see Figure 5). A similar interaction was obtained in the analysis without control variables.
Predicting SWB (Life Satisfaction and Positive Emotions) From Income Inequality and Liberalism (Study 3).

Note. SWB = subjective well-being; CI = confidence interval; SES = socioeconomic status.

Predicting SWB from income inequality and liberalism (Study 3).
Simple slopes analyses of the SWB composite, centering liberalism at low (–1 SD) and high (+1 SD) levels, showed that higher inequality (higher Gini) was related to greater SWB at low liberalism (β = .34, t = 5.37, p < .001); inequality was not related to SWB at high liberalism (p = .49). Additional simple slopes analyses, centering Gini at high and low levels, showed that greater liberalism was marginally related to better SWB at low inequality (β = .16, t = 1.94, p = .060); at high inequality, the corresponding relation reversed but was not significant (β = −.14, t = −1.63, p = .112).
To test whether the Gini × Liberalism is moderated by SES, we added to the models the Gini × Liberalism × SES and the relevant two-way interactions (see bottom part in Table 3). Adjusting for all the control variables, the relation between the three-way interaction and SWB was significant, β = .05, t = 3.09, p = .004; see Figure 6; a similar result was obtained in the analysis without the control variable. Simple slopes analyses, centering SES at +1 SD and −1 SD, showed that the Gini × Liberalism was significant at both high SES (β = −.13, t = −3.00, p = .005) and low SES (β = −.22, t = −3.95, p < .001), but the effect size was larger at low SES (see Section C in Supplementary Materials for additional simple slopes analyses).

Predicting SWB from income inequality, liberalism, and SES (Study 3).
Mediation
Using the same procedures as those in Study 2, we found a marginally significant relation between Gini × Liberalism and financial satisfaction (β = −.09, t = −1.97, p = .053), and a significant relation between financial satisfaction and SWB, β = .28, t = 8.23, p < .001 (see top half of Figure 7). The indirect effect was significant, –0.026 (SE = 0.014), 95% CI [–0.054, –.001]. Next, we also found that the paths from Gini × Liberalism × SES to financial satisfaction (β = .06, t = −4.14, p < .001), and from financial satisfaction to SWB (β = .39, t = 23.20, p < .001) were significant (see bottom part of Figure 7), as was the indirect effect, 0.024 (SE = 0.006), 95% CI [.013, .036]. Controlling for financial satisfaction, the direct effect of Gini × Liberalism on SWB dropped from β = −.15 to β = −.07, but it remained significant; the direct effect of Gini × Liberalism × SES on SWB dropped from β = .05 to β = .01 and was no longer significant.

Mediation by financial satisfaction of the relation between (a) Gini × Liberalism and SWB and (b) between Gini × Liberalism × SES and SWB; coefficients in parentheses were obtained after controlling for financial satisfaction (Study 3).
Using different populations and a somewhat different sample of countries (17 or 40% of the 42 countries included in the current analyses were not included in Study 2), the results of Study 3 replicated those of Study 2, including the moderator effects of both liberalism and SES, and the two mediations. In addition, in both studies as well as in Study 1, greater income inequality was related to better SWB at low liberalism; at high liberalism, the relation between income inequality and SWB was not significant.
Study 4
Although the first three studies produced consistent results, they were all based on the same measure of liberalism. Confidence in the robustness of our model will increase if we are able to obtain the same moderator effect with a credible measure of liberalism different from the one based on Hofstede et al.’s (2010) dimensions. Study 4 was designed with this goal in mind.
In searching for a liberalism measure, we identified three topics that elicit more favorable attitudes from liberals than from conservatives, and are also included in the WVS: homosexuality (see, for example, Haidt & Hersh, 2001; Sherkat, Powell-Williams, Maddox, & de Vries, 2011), abortion (e.g., Hess & Rueb, 2005; Strickler & Danigelis, 2002), and divorce (http://news.gallup.com/poll/192,404/issues.aspx). As respondents to all six waves of the WVS rated whether each of these three was justifiable, it was possible to test our model with a liberalism measure comprising these ratings. Accordingly, we proceeded to conduct two studies. Study 4a examined whether a social issues measure that included the same questions that appeared in the WVS concerning the three topics is related to party affiliation (Democratic vs. Republican) in the United States. Study 4b examined whether this social issues measure correlates with the liberalism measure we used in Studies 1 to 3 (Hofstede et al.’s, 2010, power distance plus individualism), and whether it moderates the relation between Gini and SWB as the Hofstede-based measure did.
Because of space limitation, Study 4a is in Section D in Supplementary Materials. A brief summary of the finding is that, using a sample of 901 people, and controlling for demographic variables, the social issues composite was .45 correlated with party affiliation. Respondents identifying themselves as Democrats or leaning Democrats were more likely to justify the three behaviors than their Republican counterparts.
In Study 4b, we examined whether the social issues measure of liberalism moderates the relation between income inequality and SWB. We also replicated the moderator effect of Hofstede et al.’s (2010) power distance plus individualism measure.
Sample
A social issues index, measuring attitudes toward homosexuality, abortion, and divorce, is only indirectly related to the question of inequality. It was important, therefore, to maximize statistical power of testing the moderator effect with this measure. We, therefore, used data from all six waves of the WVS, yielding a total of 72 countries for which we had the necessary information. For the size of the moderator effect obtained in Study 1, which also used world countries (partial r = .49), the power in the present study was .99. As the WVS does not employ the same countries in each wave, there were only minimal longitudinal data: Of the 72 countries, 29 were surveyed once, 22 were surveyed twice, 13 were surveyed three times, and eight were surveyed four or more times. In addition, country variables like Gini or SWB were not expected to move much across years. Our emphasis, therefore, was on the concurrent aspects of the multilevel regression analysis with waves nested within countries.
Measures
Main variables
Liberalism values were based on the composite comprising answers to the three social issues in each wave (αs ranged from .71 to .82). We also tested the moderation effect with a liberalism measure comprising Hofstede et al.’s (2010) power distance plus individualism (the measure used in Studies 1-3). Gini values were collected from the same source as in Studies 1 to 3 for the years associated with each wave, and then averaged across these years for each wave. SWB scores were the same as those in Studies 2 and 3 (αs range from .58 to .67 across six waves).
Control variables
As in previous studies, results were adjusted for log transformed GDP per capita, quality of life, government services, and religiosity. GDP values were obtained from the World Bank (databank.worldbank.org/) for the years associated with each wave and then averaged across these years for each wave. Quality of life was composed of the same variables as in Studies 1 to 3 except that the source of the information was the World Bank. In addition, the education component of quality of life, which previously was based on three education attainment variables, was now a composite of education attainment and literacy rate (intercorrelations ranged from .74 to .93). All other components were identical to those used in the previous studies. Quality of life scores were averaged across the years within each wave (αs across waves ranged from .91 to .93). Government services were a composite of the same variables as in Studies 1 to 3 but were now obtained from the World Bank. Like quality of life, these scores were averaged across the years within each wave. Religiosity scores were those used in Studies 1 and 2 for Waves 6 and 5, respectively; for prior waves, they were composites based on three items similar to those used in Wave 6 (αs ranged from .65 to .78); all the scores were standardized.
Results and Discussion
We conducted a two-level fixed and random effects regression model analysis to account for the nonindependent nature of the data with waves nested in countries, and using restricted maximum likelihood estimation. Fully unconditional model showed that 27.8% of variance in SWB was within-country (i.e., between waves; Level 1); 76.2% of variance was between-country (i.e., Level 2). Level 1 variables included waves, and shifts above and below country means for Gini, liberalism, GDP, quality of life, government services, and religiosity. Level 2 variables included averages of all the country control variable plus averages of Gini and liberalism. Each of these variables was centered at the grand mean. All Level 1 and Level 2 data were standardized such that the analyses estimated the standardized coefficients. The model was run with the social issues scale as the liberalism measure and, again, with Hofstede et al.’s (2010) power distance plus individualism as the liberalism measure. As in previous studies, we present results for analyses with and without control variables (see Supplementary Materials section A [Table A4] for correlation coefficients among all the country level variables and average SWB).
Starting with analyses using the social issues scale as the liberalism measure, and as anticipated, the within-country analysis at Level 1 (i.e., shifts above and below the mean) yielded only a single significant result: Shifts upward and downward by GDP were accompanied by corresponding shifts in SWB, β = 1.51, t = 2.85, p = .005. Shifts in other variables did not predict shifts in SWB (ps > .09). Results from analyses at Level 2 (see upper part of Table 4; left part with control variables, right part without control variables) showed that higher Gini was related to greater SWB (p = .001); liberalism was unrelated to SWB (p > .50) but did moderate the relation between Gini and SWB (β = −.30, t = −2.13, p = .037; see Figure 8). Simple slopes analyses showed that at low liberalism, higher inequality (higher Gini) was associated with greater SWB (β = .61, t = 3.77, p < .001); at high liberalism, inequality was not associated with SWB, β = .02, p = .92.
Predicting SWB (Life Satisfaction and Positive Emotions) From Income Inequality and Liberalism (Study 4).

Note. SWB = subjective well-being; CI = confidence interval.
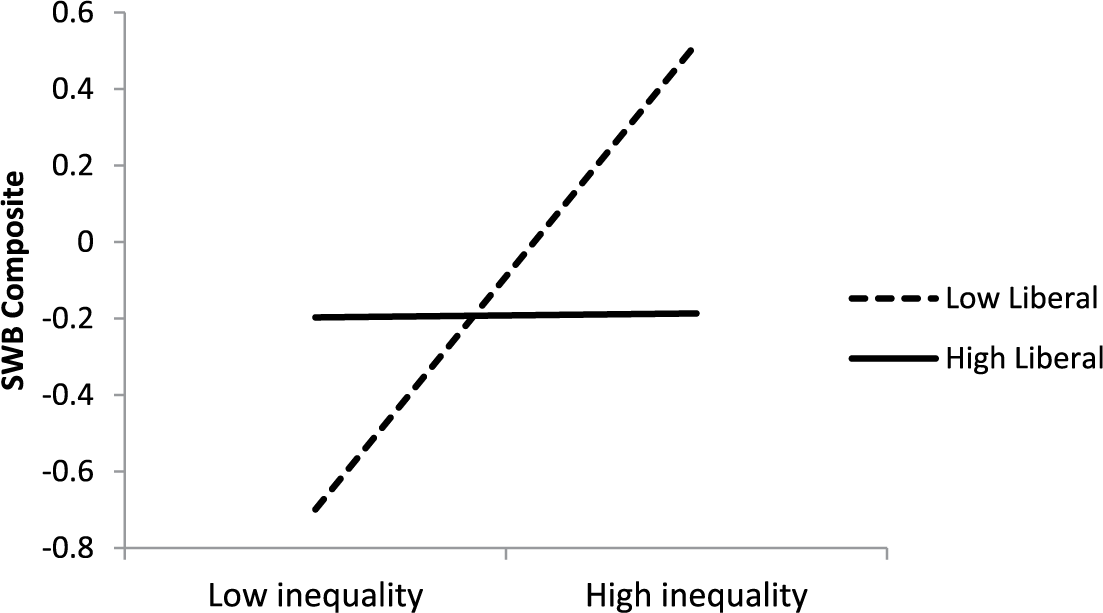
Predicting SWB from income inequality and liberalism (social issues scale; Study 4).
Running the same model with Hofstede et al.’s (2010) power distance plus individualism as the liberalism measure (see bottom part of Table 4) replicated the usual Gini × Liberalism interaction, β = −.36, t = −4.39, p < .001. The correlation between liberalism as the social issues measure and liberalism as Hofstede et al.’s (2010) power distance plus individualism was .67.
Thus, testing the Gini × Liberalism interaction with a new liberalism measure showed that it produced a moderator effect similar to the one obtained with the Hofstede-based measure. In addition, the new liberalism measure was related to both party affiliation in the United States and to the Hofstede-based measure.
The focus throughout this article was the effects of liberalism at the country level. However, using the data from Study 4, we also tested the effects of liberalism at the individual level. There was no support for the notion that liberalism (at the individual level) moderates the relation between inequality and SWB (a more detailed account is in Section E in Supplementary Materials).
General Discussion
Across several populations and two different measures of liberalism, the results showed that the liberal–conservative continuum moderated the relation between Gini and SWB. The simple slope analyses supported the weak prediction of our model—greater income inequality was related to greater SWB in conservative countries; in liberal countries, the relation was often reversed but did not reach significance. We believe that this pattern is limited to the specific variables we tested (income inequality, SWB) and the comparisons we made (among world countries). In other words, conservatism might be high enough in world countries to produce a positive relation between income inequality and SWB. Liberalism, in contrast, might not be high enough to produce the opposite relation. The pattern might be different if we study different aggregates (e.g., states in the United States as opposed to world countries), other types of inequality (e.g., gender inequality, racial inequality), or other reactions to inequality besides SWB.
It is important to emphasize that the theoretical model that we tested concerns the liberal–conservative continuum at the aggregate (i.e., country) level. In other words, we found that individuals respond to the level of income inequality (Gini) in their country according to the level of liberalism in that country (but not necessarily according to how liberals they themselves are). The moderator in Studies 1 to 4 combined Hofstede et al.’s (2010) equivalents of Duckitt’s (2001) economic and social conservatism. An alternative moderator in Study 4—a composite of attitudes toward three social issues—was correlated with party affiliation in the United States and with the moderator in Studies 1 to 3. The consistency in results across Studies 1 to 4 provides confidence in the robustness of our model.
Studies 2 and 3 also showed that the moderation effect of culture was stronger for lower SES people. As noted earlier, while it is easy to see why low SES individuals in liberal countries feel better under equality, it is more difficult to explain why this same group feels better under inequality in conservative countries. The account we proposed was based on Jost et al.’s (2003) use of dissonance reduction to explain why low SES people justify the system. Using the framework of our model, we suggest that conservative cultures endorse hierarchical structures and as such push low SES people to acquiesce to their status, a prerequisite for dissonance reduction, which then result in higher SWB.
As noted earlier, we combined Hofstede et al.’s (2010) power distance with individualism into a single liberalism measure. This was possible because, at the country level, power distance (representing Duckitt’s, 2001, economic conservatism vs. egalitarianism dimension) was highly related to individualism (representing Duckitt’s, autonomy/freedom vs. social conservatism dimension). Indeed, when we repeated the moderator analyses with only one of Hofstede’s values, all effects were significant. For Gini × Liberalism, ps < .01 for power distance and ps < .025 for individualism; for Gini × Liberalism × SES, ps < .01 for both power distance and individualism. At the country level, these data make it difficult to distinguish between Duckitt’s (2001) economic and social cultural perspectives.
Studies 2 and 3 also showed that the moderator effects of both liberalism and SES were mediated in part or fully by financial satisfaction. The former mediation suggests that culture moderates how people feel about financial inequality in terms of their own finances, which then translates to how people feel generally (SWB). The latter mediation suggests that the stronger moderator effect among low SES individuals (in conservative countries) reflects dissonance reduction that drives poorer people to endorse (i.e., be satisfied with) their lower financial status, which then translates to how they feel generally (SWB).
These results emphasize the crucial role of culture as a moderator of how people react to a given reality (Suh & Oishi, 2002). Without consideration of the moderating effect of culture, the results of all four studies suggest that higher income inequality is related to greater SWB (see Tables 1 to 4), a finding that contradicts the general conclusion of past epidemiological research (Pickett & Wilkinson, 2015). Once culture is added as a moderator, the relation between inequality and SWB becomes more intelligible. However, we should consider two sets of findings that appear to challenge this conclusion.
Oishi and Kesbir (2015) found that economic growth does not produce happiness when associated with greater inequality. These findings imply a relation between inequality and less happiness that is not qualified by liberalism. However, when countries develop economically, they usually become more liberal (Robinson, 2006). In our data, GDP per capita was correlated .67 with Hofstede-based measure of liberalism (Study 1), and .68 with the cultural issues measure of liberalism (Study 4). If economic growth is associated with greater liberalism, the finding that growth accompanied by inequality is not associated with happiness does not conflict with the present results.
Other research (Cheung, 2018; Hajdu & Hajdu, 2014) has shown that greater income redistribution among countries is related to greater SWB. We should note that redistribution is not identical to Gini. Indeed, Cheung (2018; Study 2) found unexpectedly that the beneficial effect of redistribution was greater for countries higher in power distance (i.e., more conservative) whereas Studies 1 to 4 showed that in conservative countries, higher inequality was actually related to greater SWB. One possible explanation for the redistribution effect is that it allows the government to provide more services and induce higher quality of life. As these constructs were measured in the current studies, it was of interest to correlate them with the redistribution figures provided by Hajdu and Hajdu (2014) and Cheung (2018). In the Hajdu and Hajdu (2014) study, the correlations of redistribution with government services and life quality were .52 and .47, respectively; in the Cheung (2018) study, the correlations were .54 and .67, respectively. Both government services and quality of life were controlled for in Studies 1 to 4. The implication is that redistribution effects cannot account for the present findings.
It should be noted that one component of our Hofstede et al.’s (2010) liberalism measure, individualism–collectivism, has been used by other investigator as a predictor or moderator of SWB. For example, Jasielska, Stolarski, and Bilewicz (2018) reported a negative relation between collectivism and happiness that disappeared when in-group favoritism and prejudice toward outgroups were controlled for. According to these authors, these features of collectivism reduce social capital, which is strongly related to SWB; these features are also consistent with the parallel we drew between Hofstede et al.’s (2010) collectivism and nationalism. Smith et al. (2018) found that relative deprivation at the individual level predicted lower life satisfaction and that the relation was stronger in more individualistic countries. These authors proposed that Hofstede et al.’s (2010) individualism links self-worth with individual agency, thus worsening the negative implications of relative deprivation. The present study is an addition to this expanding literature. A summary and integration of all these results is a worthy task for future researchers.
Finally, although our results are correlational, disallowing claims for causality, they raise some troubling questions. We found that in conservative cultures, inequality is related to greater well-being, particularly for low SES participants—the very people that incur more losses from inequality. This pattern is disconcerting because it implies that people are acting against their own interests. If the poor in conservative cultures report greater SWB under higher inequality, they are not likely to oppose the political system. This case is reversed, however, in more liberal cultures, which tend to oppose inequality. Although a discussion about how to fight inequality is beyond our scope, our findings do suggest that the challenge to inequality must be directed at the cultural context of the system. The results also suggest that the people who are most likely to raise the challenge may not come from that segment of the population who bears the brunt of inequality.
Supplemental Material
Li_Supplemental_material – Supplemental material for Culture Moderates the Relation Between Income Inequality and Subjective Well-Being
Supplemental material, Li_Supplemental_material for Culture Moderates the Relation Between Income Inequality and Subjective Well-Being by Chen Li, Miron Zuckerman and Ed Diener in Journal of Cross-Cultural Psychology
Footnotes
Declaration of Conflicting Interests
The author(s) declared no potential conflicts of interest with respect to the research, authorship, and/or publication of this article.
Funding
The author(s) received no financial support for the research, authorship, and/or publication of this article.

Supplemental Material
Supplemental material for this article is available online.
Notes
References
Supplementary Material
Please find the following supplemental material available below.
For Open Access articles published under a Creative Commons License, all supplemental material carries the same license as the article it is associated with.
For non-Open Access articles published, all supplemental material carries a non-exclusive license, and permission requests for re-use of supplemental material or any part of supplemental material shall be sent directly to the copyright owner as specified in the copyright notice associated with the article.
