



Abstract
We use comprehensive data on student teaching placements from 14 teacher education programs (TEPs) in Washington State to explore the sorting of teacher candidates to the teachers who supervise their student teaching (“cooperating teachers”) and the schools in which student teaching occurs. We find that, all else equal, teachers with more experience, higher degree levels, and higher value added in math are more likely to serve as cooperating teachers, as are schools with lower levels of historical teacher turnover but with more open positions the following year. We also find that teacher candidates are more likely to be placed with cooperating teachers of the same gender and race/ethnicity, and are more likely to work with cooperating teachers and in schools with administrators who graduated from the candidate’s TEP.
Keywords
Introduction
Student teaching is the capstone of a teacher candidate’s preparation experience. The apprenticeships that candidates have with inservice teachers who supervise their student teaching (the “cooperating teachers” [CTs]) are hailed by teacher education programs (TEPs), as well as student teachers themselves, as providing foundational preservice teacher education experiences. For instance, in a recent review of student teaching’s contribution to teacher development, Anderson and Stillman (2013) note that “policymakers and practitioners alike increasingly tout clinical experiences as a key component—even ‘the most important’ component of—pre-service teacher preparation.” Ganser (2002) further states that the CTs “influence the career trajectory of beginning teachers for years to come” (p. 380).
Despite the perceived import of student teaching apprenticeships, there is relatively little systematic information about how matches are made between teacher candidates, internship schools, and CTs. State-level policy makers can (and sometimes do) play a role in influencing student teaching assignments as, in some cases, state laws mandate aspects of field placements, such as the diversity of the school in which student teaching occurs or the qualifications of the CT. But as is documented in Greenberg, Pomerance, and Walsh (2011) few states have specific guidelines regulating the schools in which student teaching can occur or the teachers who are eligible to supervise student teaching. For example, as of 2011, only 20% of states required that a CT hold a minimum level of professional experience or demonstrate mentoring skills.
Given the perceived centrality of student teaching to the teacher education experience, it is surprising to note that a large body of research suggests insufficient attention is paid to the specific schools and CTs that host student teachers. 1 Clark et al. (2013), for instance, stress the importance of CTs for teacher candidate development, but also that it is “widely acknowledged that the current practices for ensuring that CTs are professionally prepared for their work are inadequate and fail to address some of the most basic issues associated with their supervisory work” (p. 164). 2 This view is buttressed by a 2010 survey of school principals in which 54% reported that they were unaware that the TEPs they worked with had criteria for the selection of CTs (Greenberg et al., 2011).
In this article, we provide the first large-scale empirical analysis of the sorting of student teachers to specific CTs using a unique database of student teachers from 14 of the 21 TEPs that place student teachers in Washington State public schools. In recent years, these TEPs represent about 80% of the in-state teacher production in Washington. We connect these student teachers to administrative data on K-12 students and teachers in public schools in Washington to better understand the school- and teacher-level factors predicting where teacher candidates’ internships take place and which teachers supervise them (i.e., which teachers serve as their CTs). This is important because, as we describe in section “Background and Theoretical Framework,” there is evidence connecting characteristics of internship schools and CTs to the later effectiveness of those teacher candidates who become teachers.
We find that, all else equal, teachers with advanced degrees are more likely to host student teachers, as are schools with lower levels of historical teacher turnover but with more open positions the following year. 3 We also document considerable homophilies between student teachers and CTs: Student teachers are more likely to be placed with CTs of the same gender and race/ethnicity, and are more likely to work with CTs who graduated from the student teacher’s TEP and in schools with principals who graduated from the candidate’s TEP. These latter findings are strongly suggestive of the role of social networks in student teaching placements (Maier & Youngs, 2009), the importance of which is borne out in a companion qualitative analysis (St. John, Goldhaber, Krieg, & Theobald, 2018) that illustrates the importance of alumni networks in TEPs’ recruitment of CTs and student teaching schools. 4
There is also a concern about the diversity of the teacher workforce (e.g., Goldhaber, Theobald & Tien, 2019; Hansen & Quintero, 2017) and suggestions that mentorship may play a role in the retention of teachers of color (e.g., Bireda & Chait, 2011). Earlier research suggests that candidates of color are less likely to end up in the teacher workforce than White teacher candidates (Goldhaber, Krieg, & Theobald, 2014), and it is no great leap, therefore, to imagine that this could be related to the placement of teacher candidates of color into apprenticeships. We explore these possibilities by estimating models separately for underrepresented minority (URM, defined as American Indian, Black, or Hispanic) and non-URM teacher candidates and find that the network effects discussed above are all stronger for White candidates than for URM candidates with the exception of placement with CTs of the same race/ethnicity, which suggests that same-race placements are a high priority for URM candidates or the TEPs that place them.
Finally, we explore three different measures of CT quality—teacher experience, value added, and licensure test scores—and find that teacher experience and math value added are each positively related to the likelihood of serving as a CT, whereas reading value added and licensure tests are not statistically significant predictors. We also see some positive sorting of teacher candidates to CTs, as candidates with higher licensure test scores also tend to be placed with CTs with higher licensure test scores, all else equal. This nonrandom sorting of more-qualified teacher candidates to more-qualified CTs has implications for future research about student teaching that we discuss in the conclusion.
In the next section of this article, we proceed by discussing the importance of student teaching. In section “Data and Summary Statistics,” we discuss our data set, and section “Analytic Approach” presents our analytical approach. In section “Results,” we present our findings and then offer concluding remarks in the final section.
Background and Theoretical Framework
This study is motivated by two observations about the existing research base on student teaching placements. First, literature suggests that characteristics of the CTs and schools in which student teaching occurs are predictive of the effectiveness and retention of student teachers who end up employed as teachers (e.g., Goldhaber, Krieg, & Theobald, 2017, 2018a; Ronfeldt, 2012, 2015; Ronfeldt, Brockman, & Campbell, 2018). As we do not clearly understand how student teaching placements are made in the first place, it is difficult to quantify the probable magnitude and direction of any biases that exist in assessing relationships between student teaching placements and later teacher outcomes. Second, despite emerging qualitative evidence suggesting that student teacher placements are largely a function of personal connections and social networks between TEPs, districts, schools, and teachers (e.g., Maier & Youngs, 2009; St. John et al., 2018), there is currently no quantitative, statewide analysis of the factors that appear to predict individual student teacher placements.
A growing literature demonstrates the potential importance of student teaching schools and CTs, although it is important to stress upfront that this research is observational in nature and thus may simply reflect correlations rather than the causal effects of student teaching placements on later outcomes. At the school level, Ronfeldt (2012) finds that teachers who student taught in schools with relatively low rates of nonretirement attrition (or a higher “stay ratio”) are more effective and have higher retention rates. 5 In follow-up work, Ronfeldt (2015) collected more detailed data about internship schools and finds that the level of teacher collaboration in these schools (and, to a lesser extent, the amount of teacher turnover in the school) is also predictive of later teacher effectiveness.
Prior work with six TEPs in Washington—all of which are also part of the current study—finds that early career teachers tend to be more effective when the student demographics of their student teaching schools are similar to the demographics of the schools in which they are ultimately employed (Goldhaber et al., 2017). This suggests that student teachers develop teaching skills specific to particular types of students (e.g., economically disadvantaged) that benefit them in their future classrooms. This work also replicated Ronfeldt’s findings that student teaching in a low turnover environment is predictive of lower rates of teacher attrition.
There is less evidence on the extent to which the skill set of CTs influences teacher candidates. However, it is no great leap to think that teacher candidates would benefit from working with more able CTs. 6 Numerous qualitative studies (Clarke, Triggs, & Nielsen, 2014; Ganser, 2002; Graham, 2006; Hoffman et al., 2015; Zeichner, 2009) document the myriad roles CTs play in the development of teacher candidates: They provide concrete examples of classroom preparation, instructional leadership, and student engagement and help induct teacher candidates into school practices and processes. Experimental evidence on the assignment of teacher candidates into different apprenticeships (Ronfeldt, Goldhaber, et al., 2018) shows that the assignment to higher quality apprenticeships has a positive and causal impact on the perceptions of teacher candidates about the instructional skills of the CTs and the quality and quantity of coaching they receive.
Two recent studies explicitly connect the effectiveness of CTs to the later effectiveness of the student teachers they host. Ronfeldt, Brockman, and Campbell (2018) find that CTs with higher observational ratings and value added have teacher candidates who also receive better observational performance ratings and have higher value added when they later become teachers. Goldhaber, Krieg, and Theobald (2018b) come to a similar conclusion using the same data on student teacher placements used in this analysis—that is, that student teachers whose CT is more effective (as measured by value added) tend to be more effective once they enter the workforce—and also show that these relationships “fade out” as candidates persist in the teacher workforce.
However, a drawback of these studies is that if more effective student teaching occurs with more effective CTs, then the relationship between CT effectiveness and future student teacher effectiveness could simply reflect the sorting of student teachers to CTs rather than the causal effect of being mentored by a more effective teacher. This broad criticism can be applied to the vast majority of the literature on student teaching described above and underscores the importance of understanding more about the factors that predict which student teachers are placed with which CTs and schools.
This study builds most closely on prior work from Washington (Krieg, Theobald, & Goldhaber, 2016) that finds that the majority of teacher candidate placements (roughly 60%) occur in school districts that are within 50 miles of the TEP in which they are enrolled, whereas slightly more than half of student teaching placements are within 50 miles of the high school the candidate attended. This echoes earlier findings about the “draw of home” in the teacher labor market in general (Boyd, Lankford, Loeb, & Wyckoff, 2005; Reininger, 2012), as well as practical constraints on student teaching placements (e.g., the ability of TEPs to supervise student teaching placements). Although this prior work focused on student teacher placements at the district level, this article leverages a substantially larger data set to explore the sorting of student teachers to specific schools and CTs.
A companion qualitative analysis to this article (St. John et al., 2018) provides further motivation and a conceptual framework for this quantitative study. St. John et al. (2018) analyzed data from interviews with the individuals who facilitate student teacher placements in eight TEPs, two districts, and six schools in Washington (the setting of this study) within the cultural-historical activity theory (CHAT) conceptual framework. 7 This analysis highlighted that student teacher placements are the product of shared goals such as improving teacher quality and identifying potential future teachers, and following prior work by Maier and Youngs (2009) also documented the important role of social networks in placements and how they can advantage some TEPs, districts, and schools in this process.
This prior work motivates the consideration of four different groups of predictors of student teaching placements in this analysis, all described in the next section. First, because of the clear interest expressed by both TEPs and school systems in placing student teachers with effective CTs, we consider the observable characteristics of potential CTs as one group of predictors. Second, TEPs frequently cited school settings as an important factor in student teaching placements, so we consider observable characteristics of potential placement schools as another set of predictor variables. Third, many TEPs and school systems argued for the importance of placing candidates with a CT with whom there is a good “fit,” so we consider as a third set of predictors the observable similarities between candidates and potential CTs. Finally, as discussed above, this prior analysis highlights the importance of social networks in the student teaching placement process, so we also create measures (described in the next section) of whether each potential CT and placement school is within a candidate’s social network and consider these measures as the last set of predictors.
Data and Summary Statistics
Data Sources
The data we utilize combine student teaching data from institutions participating in the Teacher Education Learning Collaborative (TELC) with K-12 administrative data provided by Washington State’s Office of the Superintendent of Public Instruction (OSPI). The TELC data include information from 14 of the state’s 21 college and university-based TEPs and provide information about teacher candidates themselves (e.g., race/ethnicity and gender) as well as data about when student teaching occurred, the schools in which teacher candidates completed their student teaching, and the CTs that supervised their internships. 8
Although many of the institutions in TELC provided student teaching data going back to the mid-2000s and, in one case, to the late 1990s, we focus on student teaching data from 2009-2010 to 2014-2015 because nearly all TEPs provided complete data about their teacher candidates over this time period (although two TEPs provided data for only 3 of the 6 years). Figure 1 shows the number of student teacher observations by year for each TELC participant. 9 In total, the TELC data we utilize include information on 8,077 teacher candidates, although in some models not all of these observations are utilized due to missing observations of required variables. 10
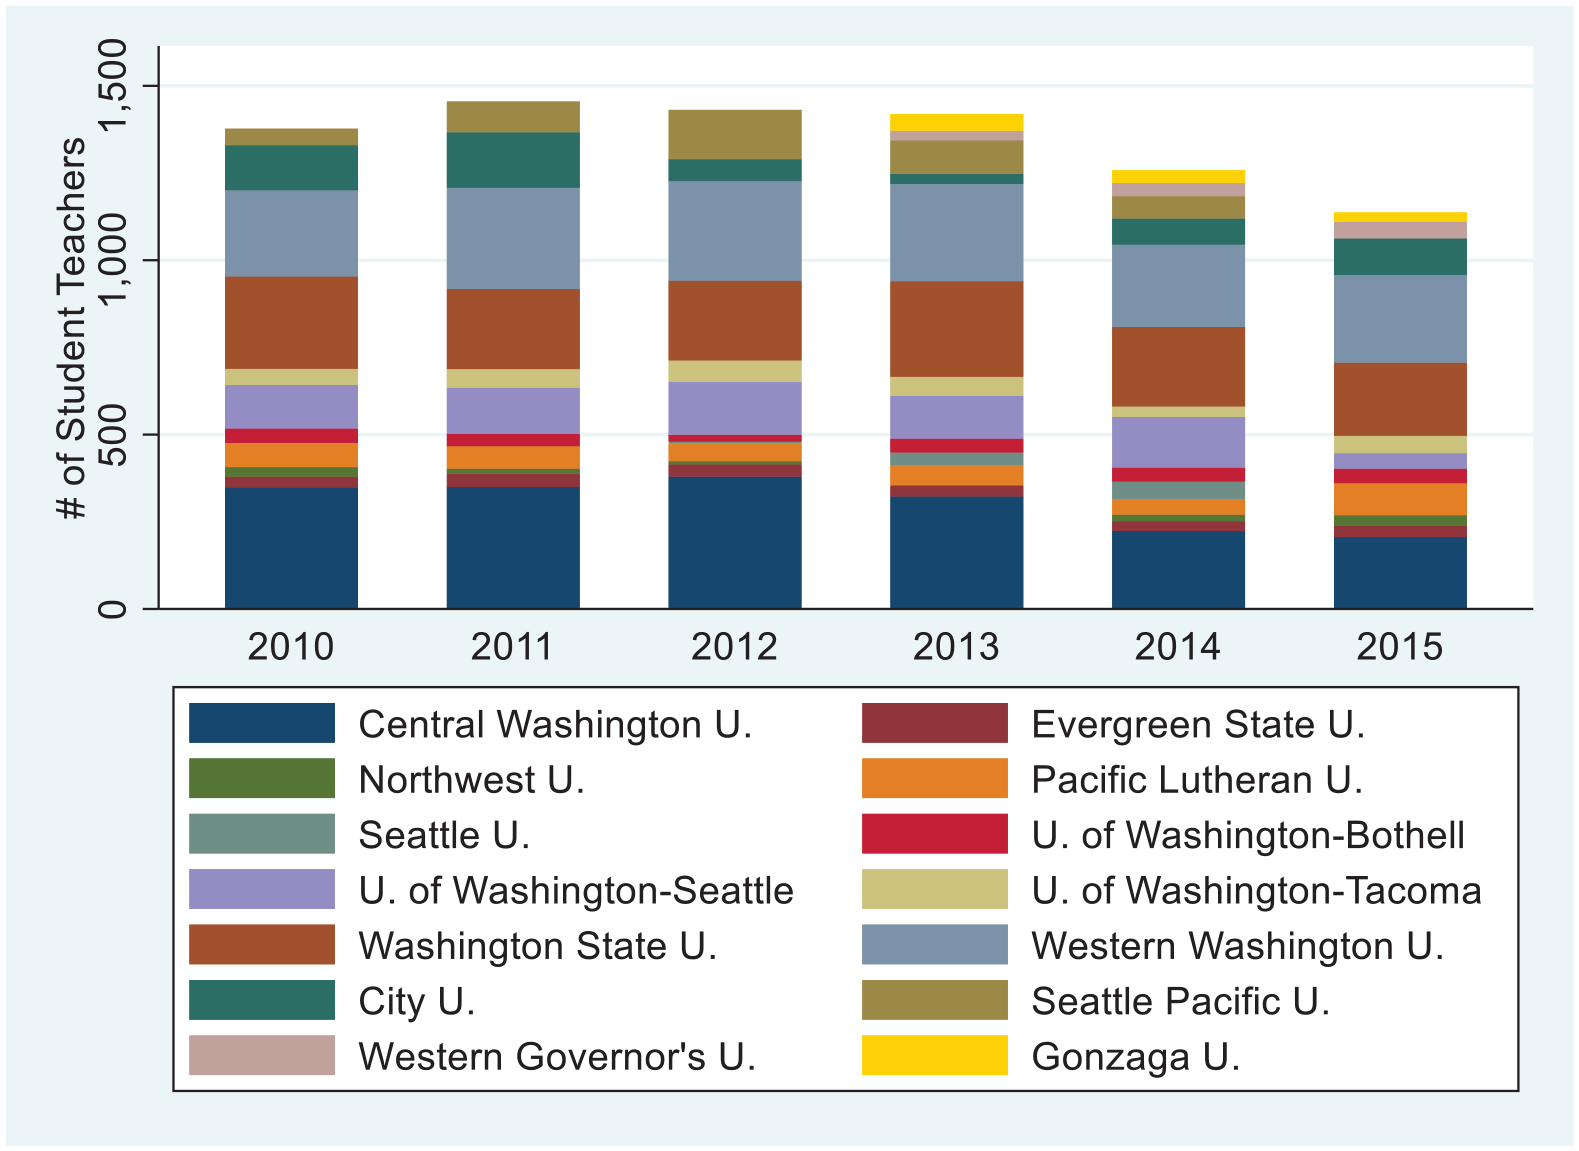
Distribution of student teaching placements by year and TEP.
Importantly, this data set can be further linked to a number of additional variables about these students, CTs, and schools. For instance, these data contain licensure exam scores (Washington Educator Skills Tests–Basic [WEST-B]) in three areas: math, reading, and writing. We standardize these exams to have mean zero and standard deviation of 1 across all test-takers in Washington between 2010 and 2015. These scores are observed for 78% of student teachers and 18% of CTs in our data. 11 In addition, the student-level data from OSPI include annual standardized test scores and demographic/program participation data for all K-12 students in the state. The OSPI personnel data include information on teachers’ years of teaching experience, degree level (e.g., bachelor’s or master’s), grade taught, race/ethnicity, endorsement area, and gender. 12 The school data include aggregated student demographics, geographic information, and school closure information.
Description of Explanatory Variables
We use the student-level data to estimate value-added models (VAMs) of teacher effectiveness for teachers in tested grades and subjects. Specifically, for math and reading teachers in Grades 4 to 8 (i.e., grades in which current and prior standardized test scores are available), we estimate the following VAM estimated separately for both math and reading:

where Yijstq is the state test score for each student i with teacher j in subject s (math or reading) at school q in year t, normalized within grade and year;
One possible confounding influence in estimating VAMs is the presence of a student teacher (e.g., Goldhaber et al., 2018a). For instance, a student teacher might make a CT more effective and raise their estimated value added. If this were the case, then when we incorporate the value-added estimates from Equation 1 to understand which CTs host a student teacher, we would erroneously find that high value-added CTs were more likely to supervise student teachers. To avoid this, we estimate teacher value added using Equation 1 applied only to years when CTs did not host a TELC student teacher. We then incorporate these value-added estimates into some of our analytical models described in the next section.
We further supplement this data set with two additional school-level measures that have been shown to be important in prior work on student teaching. First, the personnel data allow us to observe teacher mobility between schools, districts, and out of the Washington public school workforce, so we use this information to calculate the “stay ratio” for each school in the state. As noted above, the stay ratio is a measure that has been found to be predictive of later teacher effectiveness and retention (Goldhaber et al., 2017; Ronfeldt, 2012, 2015) and has been shown to be correlated with other measures of school culture (Ronfeldt, 2012). We calculate the school stay ratio as the proportion of nonretirement-age teachers who stay in the school the following year, averaged over the current year and four previous years. 14 Schools with higher stay ratios tend to have more teachers who stay in the school from year to year, which serves as a proxy for positive school culture.
We also use the personnel data to calculate the number of “openings” that a school will have in the following year, which we define as the number of new teachers (i.e., with no prior teaching experience) employed in the school year after student teaching occurs. In prior work in Washington (Goldhaber et al., 2017), we showed that student teachers are more likely to enter the workforce if they student teach in a school with more openings the following year, so we consider this variable to investigate whether TEPs may be more likely to place student teachers in schools that will be hiring teachers the following year. 15
Data Restrictions
An important issue is that although we observe the majority of student teaching placements in the state, we do not observe all of them because student teaching information from seven of the 21 TEPs that place student teachers in Washington is not included in this data set. To explore this issue further, we plot the percentage of new, in-state teachers in each district in Washington between 2010 and 2015 who graduated from one of the institutions included in this study in Figure 2. The dots in Figure 2 represent the 21 TEPs in the state—yellow (light grey in print version) dots represent TEPs that are participating in the study, whereas red (dark grey in print version) dots represent TEPs that are not—and the sizes of the dots are scaled to reflect the average number of new teaching credentials issued by each TEP between 2010 and 2015.
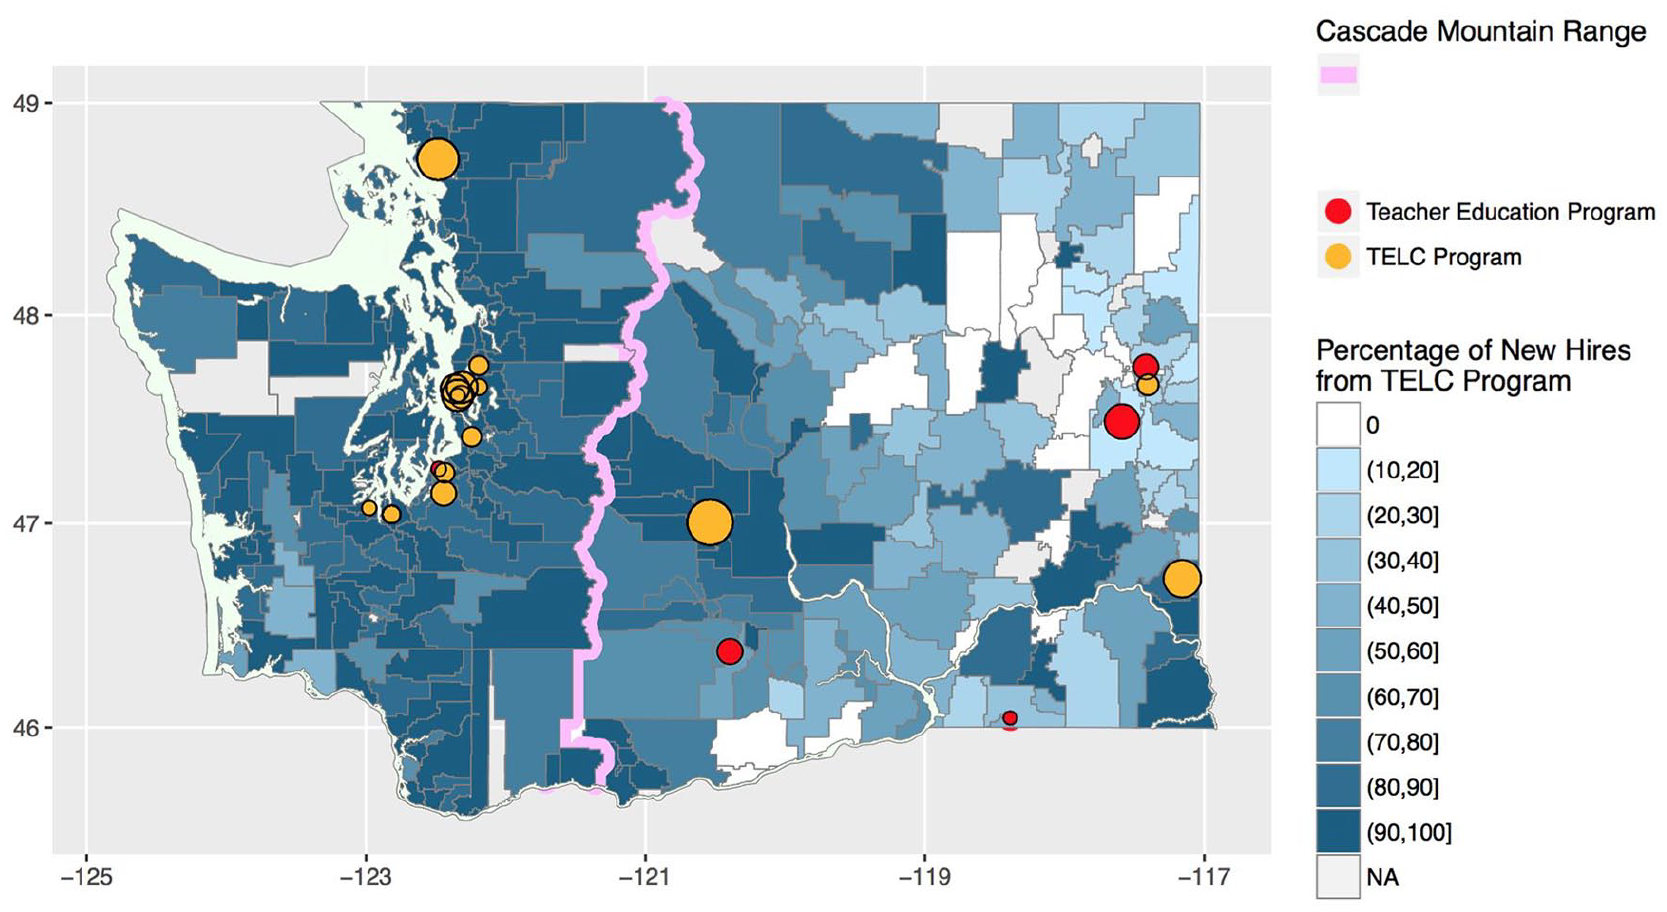
Percentage of newly hired in-state teachers from participating TEPs, between 2010 and 2015.
Overall, the TELC data include programs that supplied more than 81% of the new teachers prepared in Washington State between 2010 and 2015. 16 However, there are notable geographical gaps in terms of the new teacher supply by TELC institutions, largely driven by the fact that the three largest TEPs not participating in the study are all in the eastern half of the state. In particular, TELC institutions provide only about 55% of new teachers from in-state institutions in districts east of the Cascade Mountains (indicated by the pink line through Figure 2), and there are a number of generally rural districts in eastern Washington where TELC institutions supply less than 10% of new teachers credentialed from in-state institutions (noted by the lighter shading in Figure 2). 17 The flip side of course is that, for the rest of the state, these institutions provide the vast majority of new teachers credentialed from in-state institutions; for instance, TELC institutions provide more than 90% of the new teachers who were prepared by in-state institutions in districts located west of the Cascade Mountains.
Because of the limitations described above, we focus the analysis in this article on student teaching placements in districts west of the Cascade Mountains. Our motivation for this is that the analytic models described in the next section rely on the assumption that we have complete knowledge about which CTs hosted student teachers. Specifically, the models predicting whether CTs and schools host a student teacher assume that if a CT or school did not host a student teacher in our data set, they did not host a student teacher at all. Given that TELC programs provide overwhelming majority of new in-state teachers to districts west of the Cascades, we believe our data set also includes the vast majority of student teaching placements in those districts during the years we consider (although this assumption is not testable without data from programs not participating in TELC). As a means of checking the sensitivity of this assumption, we also present results from a model where we include all CTs in the state, including those in districts east of the Cascade Mountains.
A second restriction to our data set arises because the State of Washington prohibits teachers with less than 3 years of experience from hosting a student teacher. Although excluding these potential CTs from our data seems appropriate, it turns out that 2.4% of student teachers served with a CT that had less than 3 years of experience. We handle this in two ways: We first construct our preferred set of CTs that excludes those with less than 3 years of experience. We then estimate models without this exclusion and add a binary explanatory variable that identifies CTs with less than 3 years of experience.
Using our preferred data set of non-novice teachers attending a TEP west of the Cascades, Figure 3 plots the variation across districts in terms of the percentage of teachers who host a student teacher from a TELC institution between 2010 and 2015. Although 3.1% of all teachers host a TELC student teacher in these years, there are a number of districts (even west of the Cascades) that do not host any student teachers, while a few districts (highlighted in the legend of Figure 3) have at least 7% of their teacher workforce hosting a student teacher from a TELC institution in any given year. A comparison of Figure 3 to the geographic distribution of TEPs in the state (shown in Figure 2) further illustrates the importance of geography in student teaching placements, as the districts in which a large percentage of teachers host a student teacher tend to be the districts near large TEPs, whereas the districts that host no student teachers tend not to have any TEPs nearby.
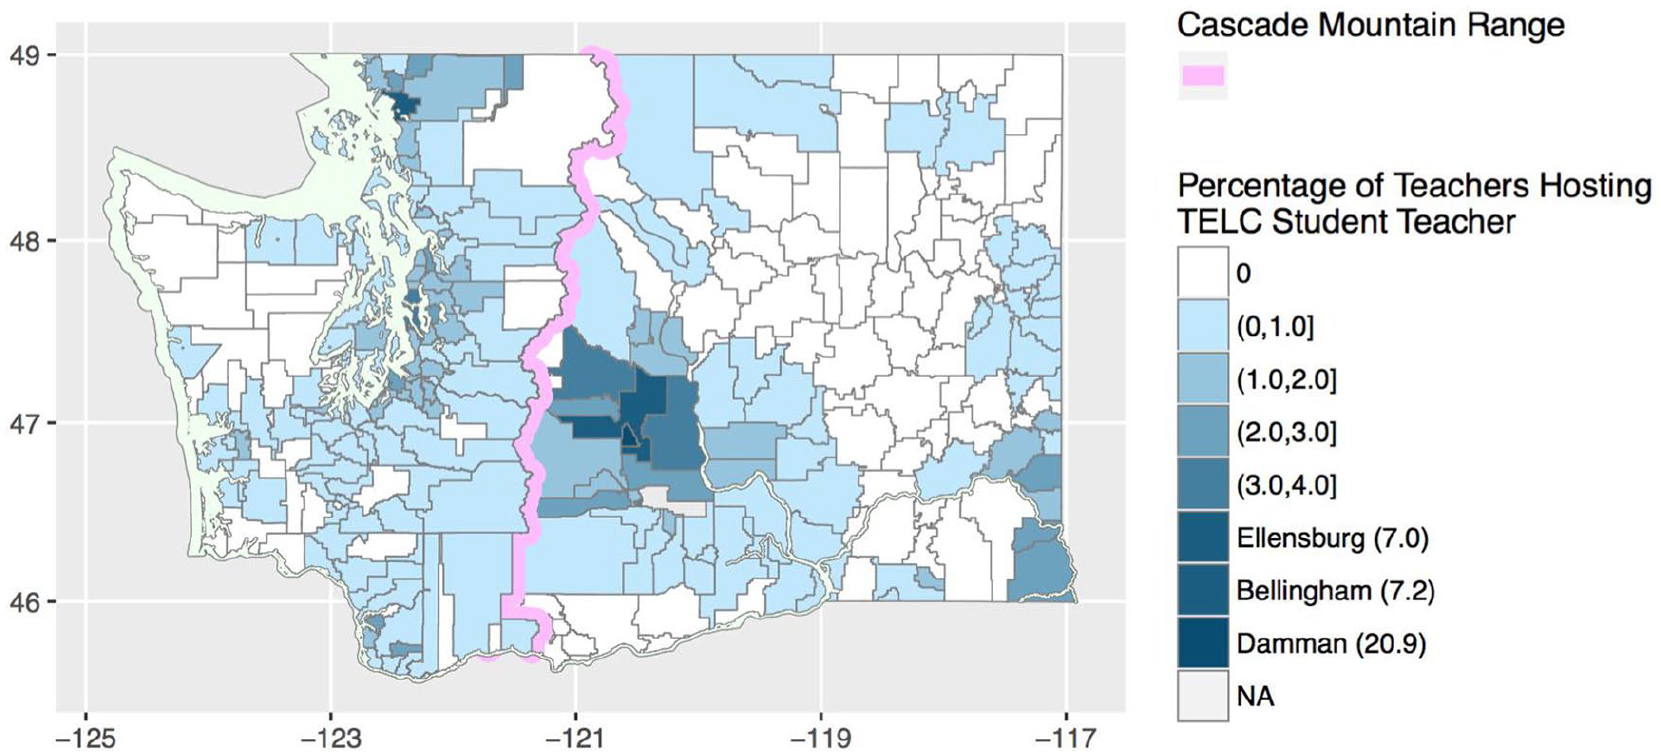
Percentage of teachers hosting a student teacher from a participating TEP, between 2010 and 2015.
Summary Statistics
Before describing our analytic models in the next section, we present summary statistics of the key variables of interest in Table 1. These summary statistics are intended to provide unconditional comparisons between teachers and schools that did and did not host student teachers, before transitioning to the conditional estimates described in the rest of the article. Among potential CTs, teachers who actually trained student teachers were more likely to hold a master’s degree, were more likely to teach in buildings with more URM students, and more likely to teach in buildings that had more openings in the following year. Among potential CTs with a value-added estimate, teachers who served as a CT had higher value added in math (by about 0.03 standard deviations of student performance) and ELA (by about 0.02 standard deviations of student performance) than teachers who did not serve as a CT. Although there are other differences in the summary statistics between teachers who supervised a student teacher and those who did not, perhaps the most important takeaway from Table 4 is how many characteristics do not differ, on average, between CTs and other teachers. For instance, there are no significant differences in terms of experience, gender, race/ethnicity, and licensure test scores between CTs and non-CTs. We use the analytical models described in the next section to explore whether these simple comparisons of means obscure underlying differences between CTs and non-CTs.
Summary Statistics of Student Teaching Placements and Nonstudent Teaching Placements.
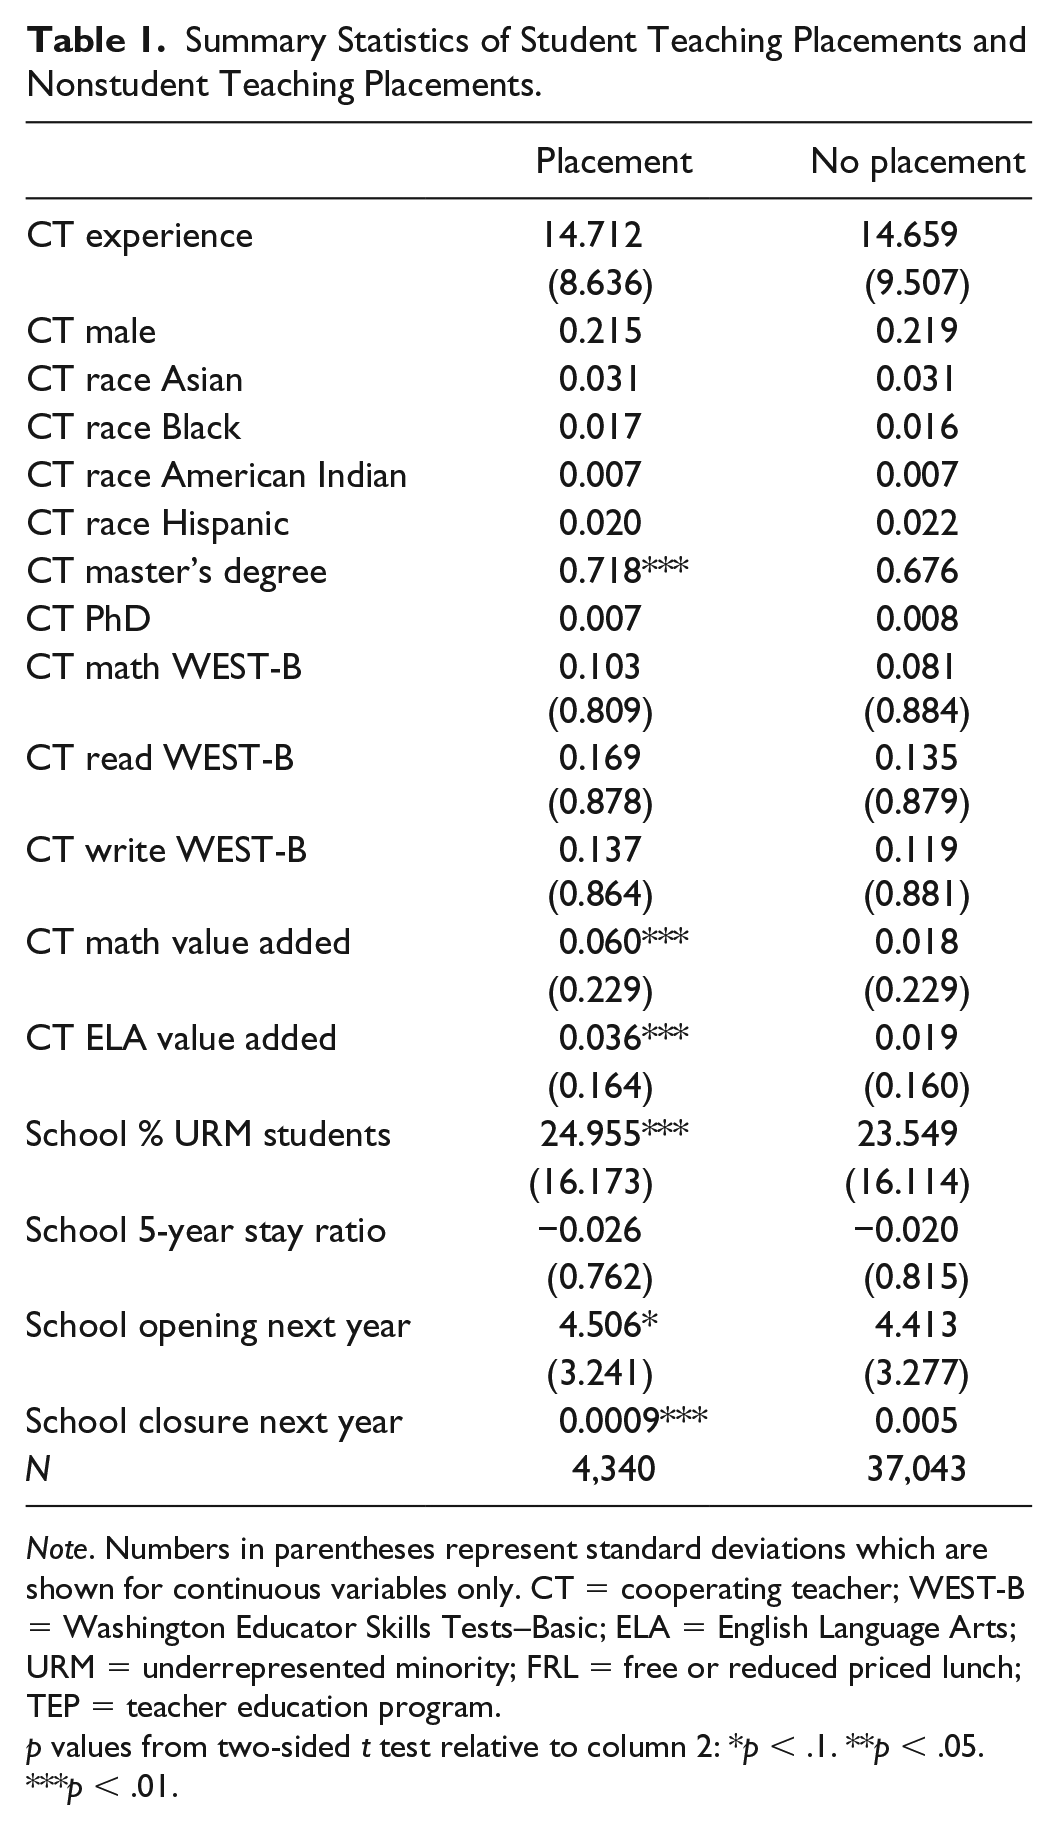
Note. Numbers in parentheses represent standard deviations which are shown for continuous variables only. CT = cooperating teacher; WEST-B = Washington Educator Skills Tests–Basic; ELA = English Language Arts; URM = underrepresented minority; FRL = free or reduced priced lunch; TEP = teacher education program.
p values from two-sided t test relative to column 2: *p < .1. **p < .05. ***p < .01.
Analytic Approach
To understand which school- and teacher-based factors predict where student teaching occurs, we follow Boyd et al. (2005) and Krieg et al. (2016) and estimate a series of conditional logit models predicting which teachers (i.e., potential CTs) host student teachers in our data set. Let Pij represent the probability that student teacher i student taught under the supervision of CT j. We model this probability using variants of the conditional logit equation:

where Zj represents CT j’s characteristics, including their years of teaching experience, gender, race/ethnicity, level of education (e.g., master’s degree), and endorsement area. Zj also includes characteristics of the teacher’s building: the stay ratio, the percentage of students who are URMs, the type of building (elementary, middle, high, or comprehensive school), the number of new teachers hired in the following year, and a binary identifying whether the building closed after the current year. The last two of these measures, the number of new teachers and the building closed identifier, are intended to measure strategic placement of student teachers into buildings which are (un)likely to need new teachers the year after student teaching occurs.
A downside endemic of all conditional logit models is that we are unable to introduce measures that are constant within a student teacher (such as individual student teacher characteristics or characteristics of the student teacher’s TEP) as stand-alone components of Xij because variables only associated with student teacher i will divide out of Equation 2. However, we can interact student teacher characteristics with components of Zj, so there is a unique observation per student teacher/teacher pair. For instance, Xij contains binary variables equal to 1 if student teachers share the same race/ethnicity, the same gender, and the same endorsement areas as potential CTs. We also include a binary variable if the student teacher and potential CT attended the same TEP. In addition, we identify the TEP attended by the school’s principal and include in Xij a binary variable equal to 1 if the principal and student teacher attended the same TEP. Given that Krieg et al. (2016) found that the distance between a TEP and potential student teaching location reduced the probability of training at that location, Xij also includes the log of distance (and its square) between the geographic centers of the teacher’s district and the district that houses the TEP campus that the candidate attended. 18
Estimating Equation 1 involves calculating the probability that each student teacher is trained by each potential CT. In 2015 alone, there were 54,080 certified teachers in Washington State and 1,172 TELC student teachers for a total of 63,381,760 potential matched pairs in that year. 19 The restrictions discussed in the previous section reduce these sample sizes substantially, and Panel A of Table 2 presents the resulting sample size for our preferred data set. Over the 6 years of TELC data, on average there are about 30,000 teachers on the west side of the state with three or more years of experience who supervise about 900 student teachers per year; an average rate of 3.1% of teachers serve as a CT for a TELC student teacher in any given year. Over the six observed years, there are 164 million student teacher/teacher pairs used in the conditional logit estimation. Because of these data restrictions, the appropriate interpretation of the conditional logit model used with our preferred data restrictions is that it estimates the probability of a non-novice teacher on the west side of the state hosting a student teacher trained at any TELC TEP in the state.
Number of Observations in Conditional Logit Models.
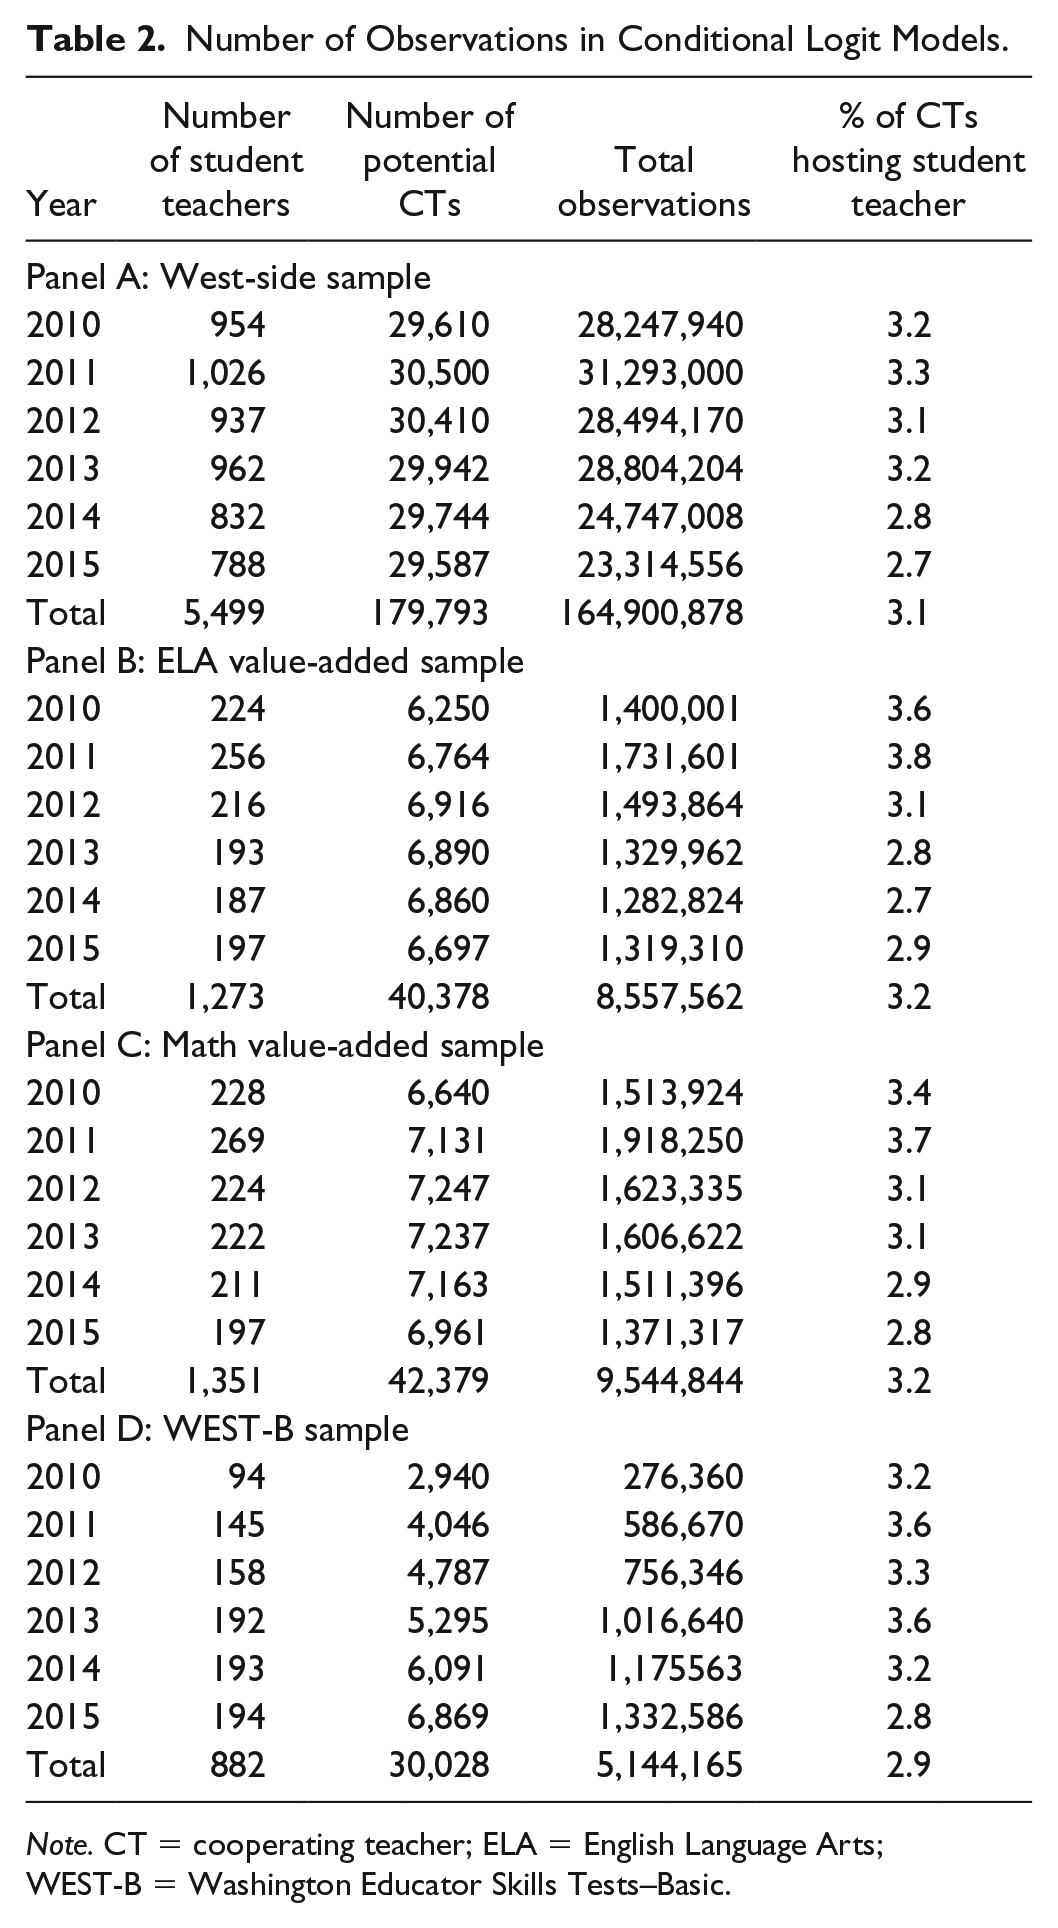
Note. CT = cooperating teacher; ELA = English Language Arts; WEST-B = Washington Educator Skills Tests–Basic.
A final set of data restrictions occurs in the versions of Equation 2 that utilize either teacher credential exam scores (WEST-B) or value-added scores. Both of these measures have many missing observations among both CTs and student teachers. For instance, value added is measured only for tested grades, and thus we do not observe value added for all CTs. The WEST-B was introduced as a requirement in 2002, and alternatives were introduced later, meaning that CTs who started prior to 2002 and student teachers who took the alternatives do not have measures of the WEST-B. As shown in Panels B, C, and D of Table 2, when these variables are included in Equation 2, there are many fewer observations used. The appropriate interpretation of these models is that they estimate the probability of a student teacher being placed among a CT with a valid measure of the WEST-B or value added, depending upon the model.
Results
Tables 3 and 4 present estimates from several specifications of the conditional logit model in Equation 2. All estimates in Tables 3 and 4 represent the marginal effects averaged across all observations. Positive coefficients signify an increase in the likelihood that a teacher supervises a student teacher, all else equal. While not reported in these tables, all models control for school type, 20 teacher endorsement areas, and an indicator of whether the teacher holds the same endorsement that the candidate will receive. The endorsement match variable is, not surprisingly, highly predictive of student teaching matches. In particular, an endorsement match between a teacher and student teacher increases the probability that the teacher hosts the student teacher by 29 percentage points. We discuss the remaining results in three subsections that focus on the following: our preferred specification of Equation 2 and extensions (section “Full Sample Specifications,” columns 1-3 of Table 3); our preferred specification of Equation 2 estimated separately for URM and non-URM candidates (section “Patterns by Candidate Race/Ethnicity,” columns 4-5 of Table 3); and specifications of Equation 2 that consider variables observed for only a sample of candidates and potential CTs in the data (section “Subsample Models,” Table 4).
Conditional Logit Marginal Effects Estimates of Hosting a Student Teacher.

Note. All models control for CT endorsement areas, school level, and an indicator of whether the CT holds the same endorsement that the candidate will receive. > and < represent statistical difference between URM and non-URM students at the 95% level. CT = cooperating teacher; URM = underrepresented minority; TEP = teacher education program; FRL = free or reduced priced lunch.
P values from two-sided t test: *p < .1. **p < .05. ***p < .01.
Conditional Logit Marginal Effects Estimates of Hosting a Student Teacher, Selected Coefficients.
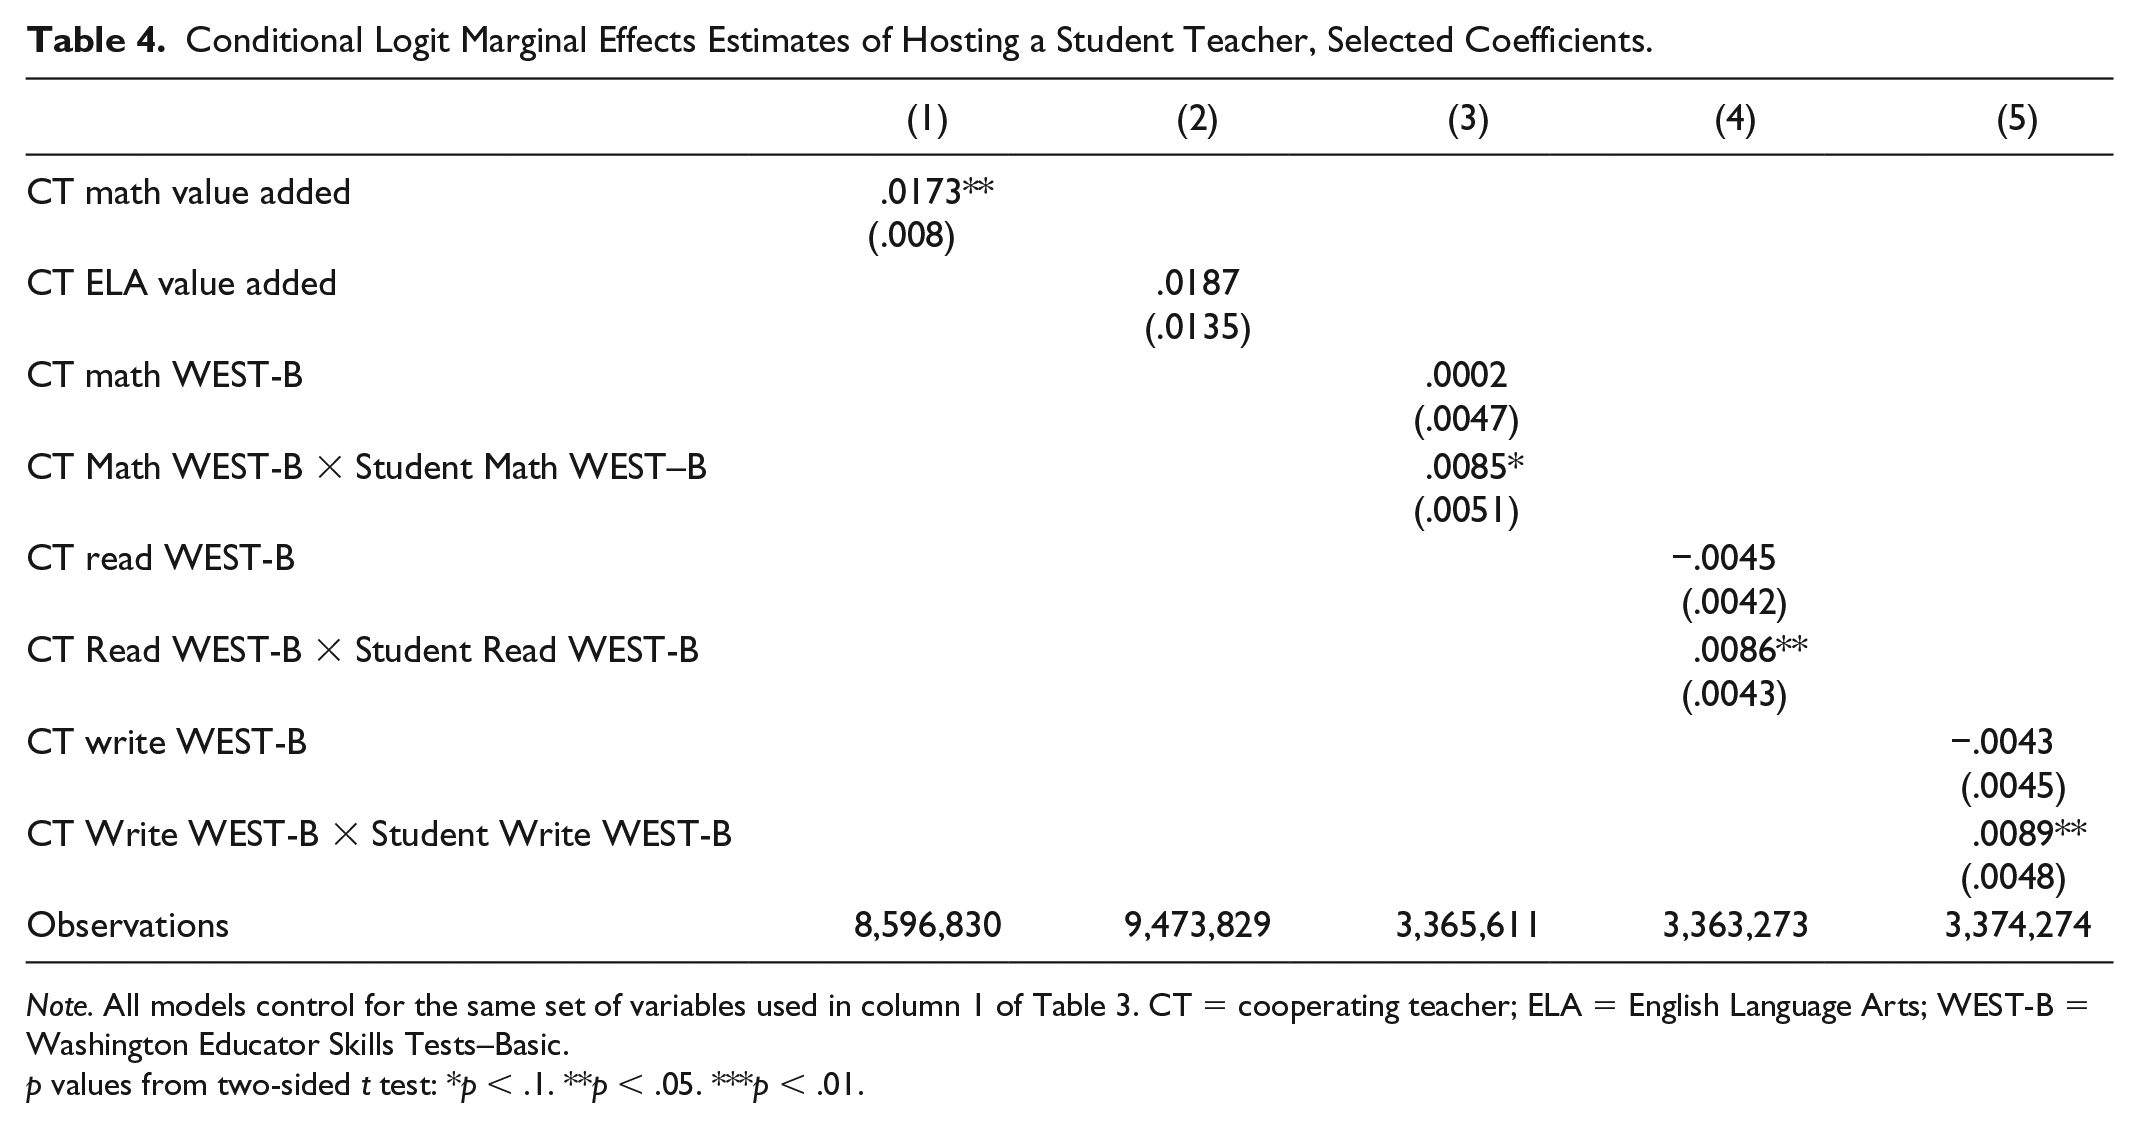
Note. All models control for the same set of variables used in column 1 of Table 3. CT = cooperating teacher; ELA = English Language Arts; WEST-B = Washington Educator Skills Tests–Basic.
p values from two-sided t test: *p < .1. **p < .05. ***p < .01.
Full Sample Specifications
We report estimates from our preferred specification of Equation 2—that is, estimated only for teachers with at least 3 years of teaching experience who are teaching in a district west of the Cascades—in column 1 of Table 3. To aid in interpretation of these estimates, consider the variable CT Experience which measures the years of teaching experience held by potential CTs. Holding all else constant, each additional year of teacher experience is expected to increase the probability of hosting a student teacher by 0.11 percentage points. To put this in perspective, over the period of our observations, on average 3.1% of potential CTs supervise student teachers. Thus, a 0.11 percentage point increase represents a 3.5% (=0.11/3.1) increase in the probability of supervising a student teacher. In other words, a CT with 10 additional years of experience is 35% more likely to host a student teacher.
An overall summary of the first column of Table 3 is that of strong homophilies; that is, shared characteristics between potential CTs and student teachers are quite predictive of placement in a CT’s classroom. For instance, student teachers are much more likely to be placed in a CT’s classroom when they share the same gender (a 4.64 percentage point increase), when they share the same race/ethnicity (a 2.98 percentage point increase), and when they attended the same TEP (a 4.74 percentage point increase). These represent very large relationships in percentage terms, as shared gender is associated with a 150% increase in the probability of a CT placement, attending the same TEP is associated with a 153% increase in this probability, and shared race/ethnicity is associated with a 96% increase in the probability of a CT placement.
The homophily findings are large enough to make the other teacher-level results seem small in comparison: Teachers with master’s degrees are about 2 percentage points (or 67%) more likely to host a student teacher than teachers with a bachelor’s degree, and none of the individual CT race/ethnicity categories are significant at conventional levels. Consistent with the existing literature (Krieg et al., 2016), the probability that a teacher hosts a student teacher also decreases substantially as the distance between the teacher’s district and the student teacher’s TEP increases. For instance, a teacher who is 20 miles away from the student’s TEP is about 7.6 percentage points less likely to supervise that student than a teacher who is 10 miles away from the TEP.
The specification in column 1 of Table 3 also contains some characteristics of the potential CTs’ schools, and in these we observe strong network effects. Teachers in schools in which the principal attended the same TEP as the student teacher are almost 2 percentage points more likely to host that student. Teachers at schools that are stable with respect to their teaching labor force (as measured by stay ratio) are also more likely to host student teachers, which is encouraging given the evidence in Ronfeldt (2012) linking the stay ratio of the internship school to future teaching effectiveness. Schools that have more job openings in the year after a student teacher placement (Openings) are also more likely to host student teachers—for each future opening in a building, each CT in that building increases their probability of hosting a student teacher by about eight hundredths of 1 percentage point. This suggests that placements may be strategic in the sense that they occur in schools in which there will be future job availability, perhaps an indication that principals who are aware of likely hiring needs may use student teaching as a recruitment or screening process for potential future employees. Importantly, the relationship between openings in the following year and the probability of hosting a student teacher is controlling for historical teacher turnover in the school (i.e., the stay ratio), so is distinct from overall levels of teacher turnover that a school tends to experience.
Given the State of Washington’s legal requirement that student teaching occurs in buildings that are dissimilar to candidates’ background, we expected the percentage of URM students in a school to positively predict the presence of student teachers, especially student teachers who are not URM themselves. However, the coefficient on percentage of a school’s students who are URM is not statistically different than zero. Furthermore, the interaction of a student teacher’s URM status with schools’ URM percentage is positive, indicating that URM teacher candidates are more, not less, likely to train in schools with high proportions of URM students than non-URM candidates. This need not indicate that TEPs are neglecting the State’s requirement as there are good reasons by TEPs that they may want to place candidates of color in schools with high proportions of URM students, not to mention that there may be other unobservable dimensions in which a candidate’s background may be dissimilar to their student teaching placement.
The second and third columns of Table 3 present models that check the sensitivity of these findings to the sample restrictions discussed earlier. Column 2 includes all possible CTs west of the Cascades, even those with less than 3 years of experience. To account for the Washington regulation that prevents CTs with less than 3 years of experience from supervising student teachers, we include a binary equal to 1 for all potential CTs with less than the requisite experience. Unsurprisingly, the coefficient on this variable is large and negative, suggesting that few inexperienced teachers serve as CTs. Importantly, the inclusion of these additional observations makes very little difference in the other estimated coefficients; the most significant change occurred on the coefficient associated with CT Same Race/Ethnicity, which grew in magnitude suggesting a stronger racial homophily among less experienced CTs and their student teachers.
The third column of Table 3 again restricts the data to teachers with less than 3 years of experience but adds all geographical regions in the State, including potential CTs east of the Cascades. The advantage of this sample is that it contains all legal possible supervising teachers within the State which helps cover the few student teachers who attend TEPs west of the Cascades and student taught east of the Cascades, as well as the TELC TEPs east of the Cascades who train their students locally. The disadvantage is that because we do not observe where seven TEPs place their student teachers and six of these are east of the Cascades, we increase the likelihood that we misidentify some CTs as not supervising a student teacher when they actually had. We thus present the third column of Table 3 as a check of our earlier findings and, because of our data limitations, do not consider them as our preferred estimates. With that said, the similarities between columns 1 and 3 are striking, with most coefficients being of similar magnitude and statistical significance. The largest differences between columns 1 and 3 of Table 3 are those that relate to distance between the student teacher’s TEP and their potential student teaching school and School % URM. Given that column 3 observes all possible teachers within the state, including those east of the Cascades where population density is much lower, it is not surprising to see the coefficients on distance change. Both the linear and squared terms on Distance are now negative, reinforcing the earlier findings that student teaching usually occurs close to a student’s TEP.
Patterns by Candidate Race/Ethnicity
The final two columns of Table 3 return to our preferred specification of non-novice CTs west of the Cascade but estimate the model separately for URM and non-URM teacher candidates. The purpose of this extension is to investigate whether patterns of student teaching placements for URM teacher candidates are different than for non-URM candidates. To facilitate this comparison, we include greater than/less than signs between columns 4 and 5 of Table 3 to represent statistically significant differences between the two groups’ estimated coefficients (and those that are not statistically significant are labeled with an equals sign). Although about half of these coefficients are statistically different between these groups, some of these differences are small in practical terms. For instance, the difference in the relationships between CT experience and placement probability is one hundredth of a percent between URM or non-URM students, and the Stay Ratio coefficient differs by two hundredths of a percent.
However, there are large, practical differences between the two groups as well. For instance, the coefficient on CT Black is large and negative for URM students and remains insignificant for non-URM students. This occurs simultaneously as the coefficient on CT Same Race/Ethnicity becomes very large for URM students and gets smaller (though still significant) for non-URM students. Taken together, this means that Hispanic and American Indian student teachers are very likely to be supervised by CTs of the same race/ethnicity, whereas Black student teachers, though still more likely to be supervised by Black CTs, are placed with a CT of the same race at a much lower rate than Hispanic and American Indian student teachers. The positive coefficient on CT Same Race/Ethnicity for non-URM students suggests that there is racial homophily among non-URM student teachers as well.
A second difference between URM and non-URM placements concerns the role of gender. The coefficient on Same Gender is very large for non-URM students, suggesting gender homophily among these students. However, URM students have a much smaller (and statistically insignificant) coefficient. This is possibly driven by the strong racial-match patterns for URM student teachers, particularly Hispanic and American Indian student teachers. If racial matching is highly important (either to candidates themselves or their TEPs) and there are few teachers of color with whom URM student teachers can be placed, then it may be more difficult to place URM student teachers with CTs with other preferred characteristics such as similar gender.
A third difference that occurs between URM and non-URM students—already captured by the interaction term between URM student teacher and School % URM in columns 1 to 3—is that the percentage of URM students in a building is positively connected with the presence of a URM student teacher but not with a non-URM student teacher. Thus, URM student teachers are more likely to serve internships at buildings with a high percentage of URM students and non-URM students are not; seemingly in opposition to Washington’s student teacher placement policy that “field experiences provide opportunity to work in communities with populations dissimilar to the background of the candidate” but again, we note that programs may place student teachers along other unobservable dimensions that differ from their background.
Subsample Models
We now turn our attention to the relationships between value added and licensure test scores on the WEST-B—only available for a subset of observations in the data—and the likelihood of hosting a student teacher, reported in Table 4. Because both value added and WEST-B are measured for only a subset of teachers and relatively few student teachers actually trained with one of these teachers, our interpretation of these results is conditional upon a student teacher being hosted by a CT with either a valid measure of value added or WEST-B score. All models in Table 4 contain the explanatory variables included in the first column of Table 3, and in general, the (unreported) coefficients on these included explanatory variables are similar to those discussed in Table 3.
The first two columns of Table 4 report the relationships between a CT’s math and ELA value added and the probability of hosting a student teacher. Although both coefficients are positive, only the math value-added coefficient is statistically significant at conventional levels. This coefficient indicates that CTs who raise student achievement 1 standard deviation more than the average math teacher are 1.73 percentage points more likely to host a student teacher. 21 In practical terms, given that a standard deviation of teacher effectiveness is 0.23 standard deviations of student performance, this implies that a 1 standard deviation increase in teacher effectiveness is correlated with a 0.4 percentage point (=1.73 × 0.23) increase in the probability of hosting a student teacher, or a 13% (=0.4/3.1) increase over the base likelihood of supervising a student teacher. This is encouraging, especially given recent evidence suggesting that more effective supervisors are predictive of a student teacher’s future effectiveness (Goldhaber et al., 2018b; Ronfeldt, Brockman, & Campbell, 2018).
The last three columns of Table 4 introduce three measures of a CT’s licensure test score (the WEST-B) on the math, ELA, and writing subtests, respectively. Each column represents one of these scores, and that score interacted with the student teacher’s WEST-B score. The interaction term is included to identify whether student teachers with higher licensure test scores are more likely to be placed with CTs with higher licensure test scores. In all three columns, the CT’s WEST-B score is not statistically significant, indicating that CTs with higher licensure test scores are not more likely to supervise student teachers. However, in all three cases, the interaction between a CT’s and a student teacher’s WEST-B score is positive and significant, indicating that there is some positive sorting of teacher candidates to CTs. For instance, in column 3, the coefficient on CT Math WEST-B × Student Math WEST-B of .0085 indicates that a CT and student teacher who are both 1 standard deviation above average on the math WEST-B are 0.85 percentage points more likely to matched than if either had an average WEST-B score.
Conclusion
This article provides the first statewide empirical evidence of the factors that determine which teachers and schools host student teachers. We find considerable homophilies between CTs and their student teachers along racial, gender, and educational backgrounds. For instance, student teachers are much more likely to be trained by teachers who attended the same TEP, who share the same gender, and who are of the same race/ethnicity. These homophilies are very strong relative to factors which might traditionally be associated with supervising student teachers such as experience, academic degree, and licensure test scores. In addition, we find that teacher candidates are more likely to train with teachers who have higher value added in math, in schools with more openings the following year, and in schools with lower rates of teacher turnover across years. We would characterize these results as encouraging given the empirical evidence connecting school openings (Goldhaber et al., 2017), school stay ratios (Ronfeldt, 2012), and CT value added (Goldhaber et al., 2018b; Ronfeldt, Brockman, & Campbell, 2018) to future workforce entry, effectiveness, and retention.
Importantly, however, the fact that student teaching occurs in schools and with teachers who are associated with positive future outcomes does not imply student teacher placements are optimized. Specifically, there are a large number of promising classrooms where student teachers are not hosted, and there tend to be geographic holes (Figure 2) in parts of Washington that train few future teachers. These holes may have important teacher equity implications given the locality of teacher labor markets (Boyd et al., 2005; Krieg et al., 2016; Reininger, 2012). Future work could explore further equity implications of student teaching placements, including differences in placements among TEPs with higher and lower proportions of URM candidates. Future work could also explore the importance of geographical distance in student teaching placements. Although this work clearly indicates increased distance reduces the likelihood of hosting a student teacher, our sample is restricted to Western Washington where distances between large districts are relatively small. It is an open question whether these findings remain in rural areas and States where TEPs are spaced differently.
Furthermore, it is possible that the strong homophilies between racial, gender, and education backgrounds could preclude potential student teacher placements that would be even more beneficial to the candidate. For instance, placing student teachers with CTs who graduated from the same TEP might be advantageous in the sense that placement officials likely know more about CTs coming from their own program, but it also substantially limits the field of potential CTs to a small subset of possible teachers and thus restricts the type of experiences a student teacher might encounter. There may be additional benefits to student teaching under a teacher who was trained in a different program such as a different perspective on the theory of teaching or approaches to dealing with children. Similar arguments can be made for placement based upon race/ethnicity and gender of the CT. A related concern has to do with matching of students with supervisors based upon grade level and endorsement. As of now, our data set does not contain the endorsement area or grade-level preferences of student teachers, so we are unable to determine the extent of these variables in the matching process. This leaves open a possible area of future research.
In addition to the homophily and network effects, this article documents that placements differ for URM student teachers and non-URM student teachers. Specifically, URM candidates are more likely to be placed with a CT of the same race/ethnicity than non-URM candidates, but in every other sense the network effects discussed above are less strong for URM candidates than for non-URM candidates. Future work could investigate whether these differences in student teacher placements may help explain prior findings that URM candidates in Washington are less likely to enter the state’s teaching workforce (Goldhaber et al., 2014).
Finally, the positive sorting of student teachers with high licensure test scores to CTs with high licensures test scores has two important implications. First, this provides evidence that more-qualified teacher candidates are more likely to be assigned to a more-qualified CT, either through their own efforts or through the efforts of their TEP. Second, this nonrandom sorting complicates ongoing and future research about the relationships between CT qualifications and future student teacher outcomes; for example, findings relating CT effectiveness to future student teacher effectiveness could be driven by this nonrandom sorting and not by the impact of being supervised by a more effective teacher. Thus, future research will need to account for this nonrandom sorting to investigate these important relationships.
Footnotes
Acknowledgements
The authors thank Nate Brown and Malcolm Wolff for outstanding research assistance, James Cowan and Jim Wyckoff for comments that improved the manuscript, and Jessica Cao, Elliot Gao, Andrew Katz, Tony Liang, Arielle Menn, Natsumi Naito, Becca Ortega, Cameron Thompson, Stacy Wang, Hilary Wu, and Yunqi Zhang for their support with data collection and cleaning.
Authors’ Note
The research presented here would not have been possible without the administrative data provided by the Washington Office of Superintendent of Public Instruction through data sharing agreement 2015DE-030 or without the student teaching data provided by teacher education programs from the following institutions participating in the Teacher Education Learning Collaborative (TELC): Central Washington University, City University, Evergreen State College, Gonzaga University, Northwest University, Pacific Lutheran University, Seattle Pacific University, Seattle University, University of Washington Bothell, University of Washington Seattle, University of Washington Tacoma, Washington State University, Western Governors University, and Western Washington University.
Declaration of Conflicting Interests
The author(s) declared no potential conflicts of interest with respect to the research, authorship, and/or publication of this article.
Funding
The author(s) disclosed receipt of the following financial support for the research, authorship, and/or publication of this article: This work is supported by the National Center for the Analysis of Longitudinal Data in Education Research (CALDER), the Bill and Melinda Gates Foundation (grant #OPP1128040), and an anonymous foundation. We appreciate this support but wish to make clear that the views expressed in this article do not necessarily reflect those of the teacher education programs participating in Teacher Education Learning Collaborative (TELC), the funders of this research, or the institutions with which the authors are affiliated.
