
Abstract
Droughts significantly impact livestock systems over natural grasslands. Nevertheless, the practices adopted by cattle producers are usually not adaptive, and therefore they deepen the impacts of the drought and its vulnerability. Drought vulnerability assessments have implicitly considered vulnerability as an individual phenomenon and have not considered the interactions of actors and agents as a key attribute. Social network analysis (SNA) can be used to analyse these processes. However, researchers have largely used SNA from a static perspective and failed to not consider that external drivers could modify the network. The objective of this work was to analyse the incidence of interactions between cattle producers, institutions and agricultural technicians and the effect of such interactions on drought vulnerability from a dynamic perspective. We worked with two operational frameworks, SNA and the incidence of external drivers on the network. Our primary results highlight that (1) cattle producers of greater centrality present lower vulnerability; (2) central cattle producers are not necessarily identified by other producers by the management they carry out; (3) the primary external driver partially affects the structure of the network; and (4) the existence of rigidity and poverty traps and difficulties hindering the propagation and consolidation of practices that reduce drought vulnerability became evident. Our findings enable the identification of potentialities and barriers in the transfer of information to increase adaptation and reduce vulnerability to drought and provide a framework that could be applicable to other productive sectors, threats and geographical contexts.
Introduction
Droughts significantly impact both natural and economic systems, with agricultural systems being the most commonly affected (Wilhite et al., 2014). These negative effects have been generally addressed as functions of exposure, sensitivity and adaptation capacity (AC) (González Tánago et al., 2016). Vulnerability evaluations significantly vary, and the situation has become more complex in recent decades. Droughts are now considered to be complex and adaptive phenomena that are ruled by multiple physical, social, productive and economic dimensions (Wilhelmi and Wilhite, 2002). In general, each producer has been considered an isolated actor, meaning that evaluations do not typically consider interrelationships as key attributes.
In recent years, there has been an increased number of approaches presenting AC as an indispensable step to augment resilience (Rockenbauch and Sakdapolrak, 2017), this being an attribute closely linked to vulnerability (Chapin et al., 2009; Gallopín, 2006). Currently, resilience is understood as the analysis of AC combined with system transformation (Folke, 2016). The combined analysis of this system’s properties includes attributes that go beyond the individual sphere and involve different interactions between producers and all actors. Thus, studying the structure of associated social networks has been recognized for its importance in understanding, among other processes, AC to variability and environmental change (Tomich et al., 2011; Tompkins and Adger, 2004). In addition, these contribute to generating, acquiring and disseminating knowledge and information (Crona and Bodin, 2006; Isaac et al., 2007), thus resulting in the capacity to absorb, adapt and shape changes (Moore and Westley, 2011). On the other hand, social interaction research can contribute to promoting social learning, provide a link between knowledge and action and improve collective action (Henry and Vollan, 2014). These perspectives promote social network analysis (SNA) as a tool for frequent use in AC studies (Bodin and Prell, 2011; Bodin et al., 2014).
SNA relies on the basic assumption that social phenomena are better explained through the relationships between actors and that these interdependent relationships determine the roles and importance of the actors themselves (Freeman, 2004; Wasserman and Faust, 1994). SNA considers the links between actors as being able to transfer information, knowledge and material goods (Wasserman and Faust, 1994). SNA is a high-potential strategy because it allows analysis on a micro (individual) and macro (network) scale while establishing relationships between both. Network type can affect actor behaviour in different ways (Bodin and Crona, 2009; Wasserman and Faust, 1994). SNA allows analysis of the links established between different nodes and can be used to identify the importance of each node in the network (Borgatti and Halgin, 2011; Borgatti et al., 2018). SNA also provides information on central actors when transferring information, creating obstacles and enabling possibilities during the process (Borgatti et al., 2018). Information about actors, links and network structure is obtained using numerous metrics that have been used in several areas of research (e.g. Bodin et al., 2017; Borgatti et al., 1998; Freeman, 1978).
SNA can be applied to agricultural research in a variety of ways, including to the studied object, analysed phenomenon and scale of analysis (Rockenbauch and Sakdapolrak, 2017). Advances in SNA are associated with the transfer of knowledge, technologies and improved agricultural practices. While Rockenbauch and Sakdapolrak (2017) cite a total of 60 works linking social networks and resilience, they also highlight that using SNA to analyse the resilience of rural communities is still incipient. In addition, assuming that the network is a static product, there have been few studies on external drivers and their impacts on the network, which is insufficient for evaluating system trajectory in the long term (Bodin and Prell, 2011).
Changes in land use are often key drivers in agroecosystems and affect various system dimensions, including the permanence of rural producers. Thus, analysing changes in land use may provide an indication about producer permanence (nodes). This will result in information on network functions and transformation. Land use change models (LCMs) have been widely used to analyse changes in land cover and make projections about such changes (Eastman, 2009; Paegelow and Camacho Olmedo, 2008). LCMs are very useful for evaluating the incidence of variables that force change and for predicting future changes.
The primary production of grasslands is the main driver of the livestock industry over natural grassland because it determines the main source of energy for herbivores (Sala and Austin, 2000). The uses and practices developed in pasture grasslands also affect their productivity and are keys to managing vulnerability, mainly during extreme events. Advances towards adaptation strategies to more efficiently manage the temporal and spatial variability of productivity is the main challenge in reducing the vulnerability of cattle producers. This situation is maximized during extreme climatic events.
Agronomic drought is the main meteorological threat in Uruguay (Cruz et al., 2014). It is manifested mainly through a reduction in grasslands productivity and, subsequently, in the sustainability of the farm (MGAP-FAO, 2013). The most recent droughts occurred in the years 2006, 2008, 2009 and 2015, and generated economic losses of hundreds of millions of dollars while affecting thousands of cattle producers (OPYPA, 2016). Producer vulnerability to drought is determined by both structural factors and the adopted producing strategies (Cruz et al., 2018; MGAP-FAO, 2013). Livestock breeding systems in Uruguay do not frequently adopt new technologies, even technologies validated decades ago that do not necessarily represent a high investment (Pereira, 2003). Some regions of the country (e.g. Sierras del Este) experience even higher vulnerability due to a combination of geophysical, social and economic factors (Díaz et al., 2017; Gómez and Saravia, 2016). Considering the grasslands productivity and variability in these systems, the absence of adaptation practices has prevailed (Díaz et al., 2017). Although, in the last years there have been promotions to increase the adaptation to drought in political, scientific-academic and at the producer level (Cruz et al., 2018), there is still a long way to go. In agreement with Cruz et al. (2018) the study of adaptive or informal networks will strengthen the process developed to increase adaptation to droughts, mainly because it is a privileged place for the development of innovations. Producer interrelationships are also variable, often consisting of regulated interactions that lead to both formal (e.g. associations) and informal (e.g. information exchanges between neighbouring producers) networks. Although there are relatively few interactions involving knowledge and technology transfers, some producers have adopted more resilient practices to deal with drought events. Here, questions arise. How do these innovations propagate? Which key attributes of actor and agent networks promote greater AC and resilience?
Several processes determine the temporal dynamics of the interactions between producers. These include disappearance due to the lack of generational relief, low profitability, and strong pressure exerted by an increased competition for land use (mainly afforestation). Thus, another question is, how do network changes affect the transfer and exchange processes between producers?
In this context, this study’s main objective was to analyse the impact of the current and potential links between cattle producers on drought vulnerability.
Methodology
Study area
The study area is located in Sierras del Este region, Uruguay. It is delimited by Barriga Negra and Polanco stream basins (Lavalleja), presenting an approximate surface of 72,600 ha. In the area are located approximately 100 cattle producers. The medium extent of the properties is 150 ha (min = 20 ha and max = 1300 ha). The majority of the producers has the following characteristic: develop a mixed cattle production (bovine and ovine) exclusively over natural grasslands, present a medium or high vulnerability to drought due to deficiencies in the capacity to manage the activity (Díaz et al., 2017). In addition, they have weak interactions between them and with the agricultural institutions (Díaz et al., 2017). The land price increment and the reduction of the livestock area as a result of the advance of afforestation (mainly Eucalyptus globulus, destined to production of cellulose pulp) is one of the main threats of the activity. Thus, the potential advance of afforestation would determine a strong and growing demand for land, which would affect the cattle producers (owners and tenants). The lack of generational changeover and the low profitability of some cattle properties are added as an additional important driver.
Research strategy
We integrated two operational frameworks. The first involved the use of SNA from a static perspective to examine the effects of the known current interactions between cattle producers, in addition to their efficacy in contributing to drought vulnerability reduction. The second involved a dynamic perspective from which we evaluated the main processes that may cause network transformation. These are mainly associated with the disappearance of producers, thus turning to land use changes modelling.
Information and networks analysis survey
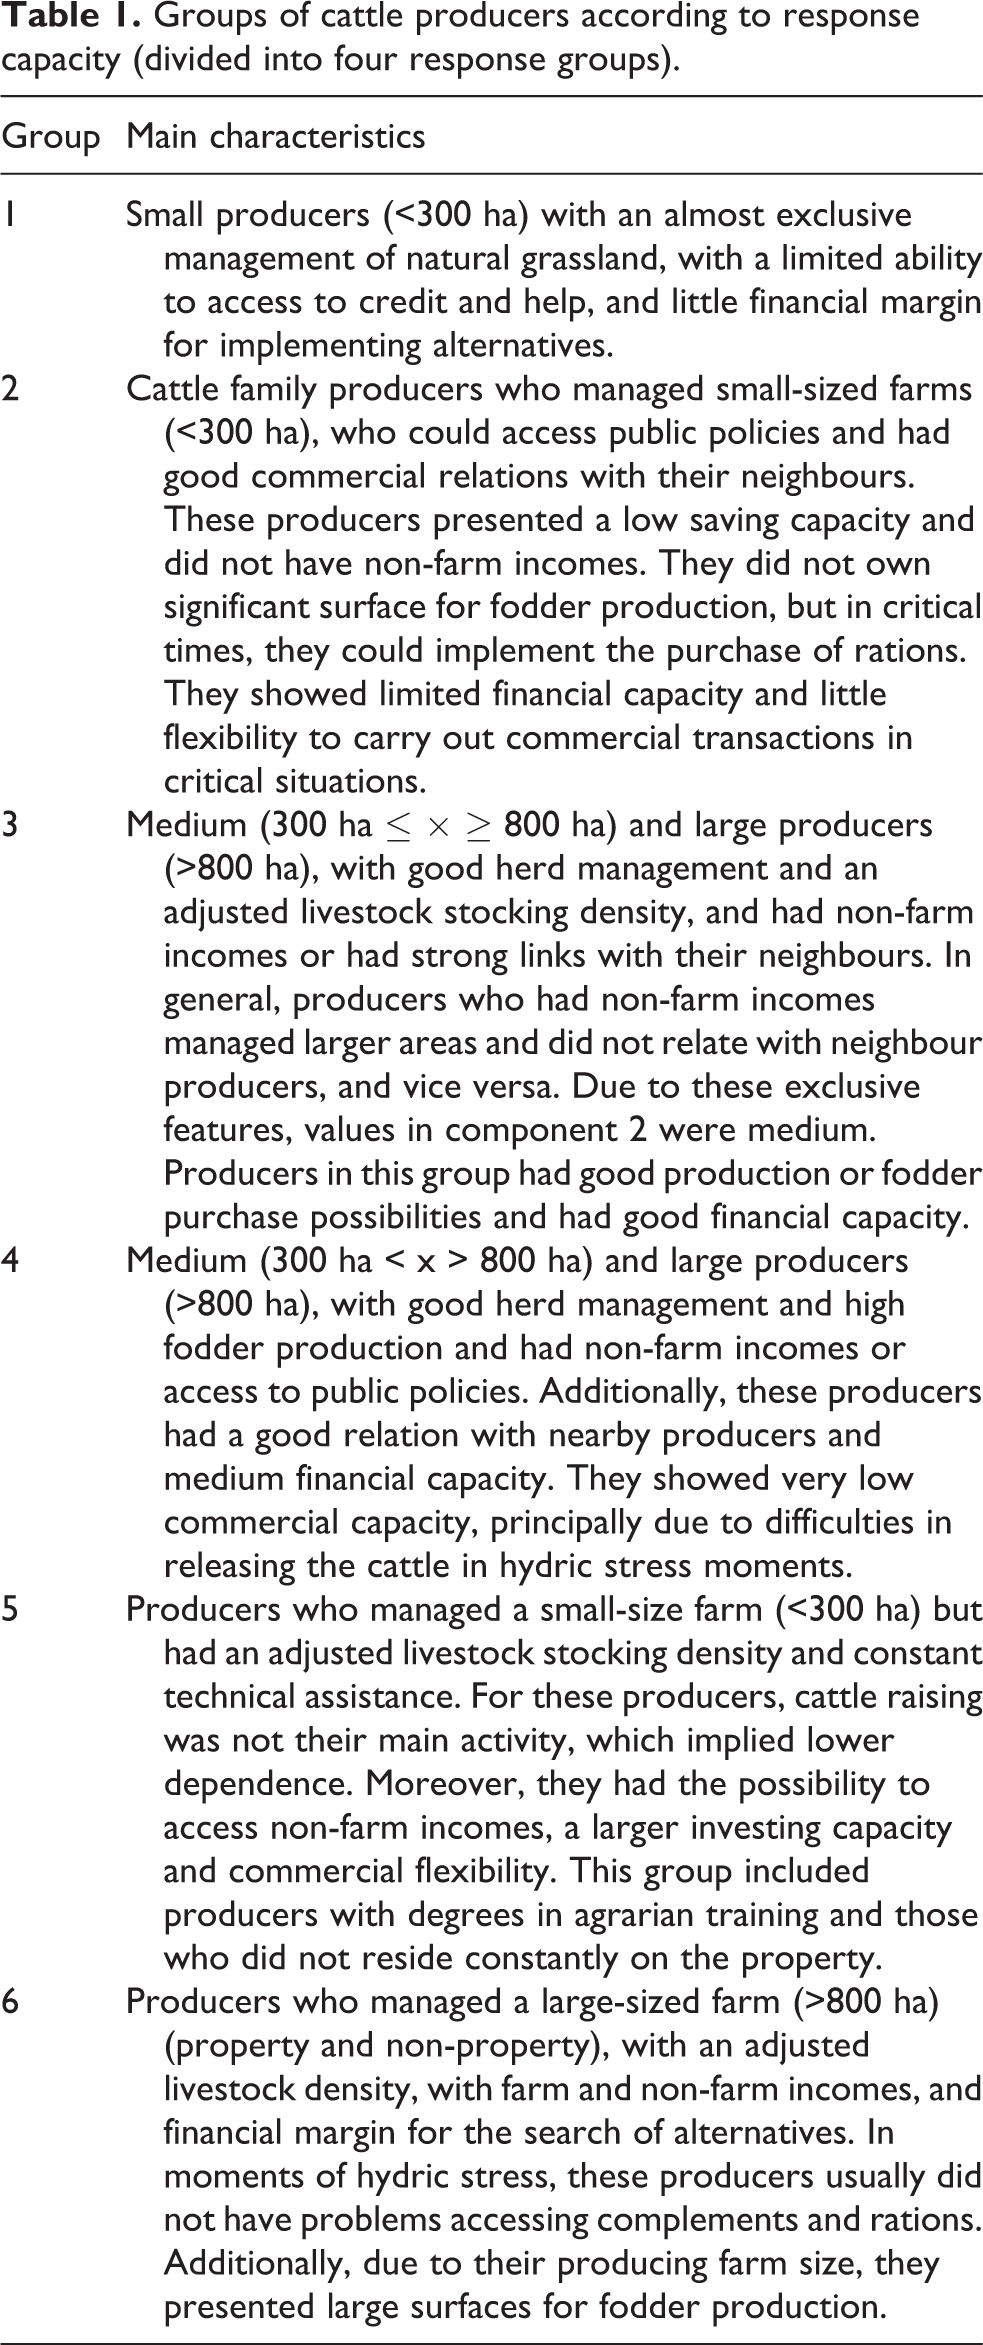
A total of 37 semi-structured interviews were conducted with cattle producers, 6 with private technicians and 2 with Ministry of Livestock, Agriculture and Fisheries (MGAP) technicians were also carried out. Each producer was consulted about their situation in four response groups identified by Díaz et al. (2017) according to key capacities for coping with drought. On the basis of these results, we classified participants into six groups (Table 1).
Groups of cattle producers according to response capacity (divided into four response groups).
In each case, we also requested participants to indicate with which producers they exchanged information with regard to productive practices and technologies. They were similarly asked to indicate cases in which there was some commercial interaction. It was thus possible to build a network of current links (i.e. for information and commercial exchange) involving 44 producers. Participants were also consulted about their relationships with private technicians and agricultural institutions, which allowed us to identify links between five technical advisers (i.e. agronomists, veterinarians and farm technicians) and five institutions: MGAP, Instituto Plan Agropecuario (IPA), Mesa de Desarrollo Rural (MDR) 1 , Sociedad de Fomento Rural Ortiz (SFRO) and Agremiación Rural Francisco A. Cal de Barriga Negra (ARFC).
Different SNA metrics were used to characterize the network (number of nodes, number of links, degree, network density, number of components, isolated nodes and centrality) and the nodes (degree, closeness, betweenness and eigenvector centrality) (Bodin and Crona, 2009; Bonacich, 1987; Borgatti et al., 1998; Freeman, 1978; Wasserman and Faust, 1994) (Table 2). The analysis was developed using Gephi software (Gephi, 2008) and R software (R Core Team, 2017).
Metrics used in SNA, description and interpretation.
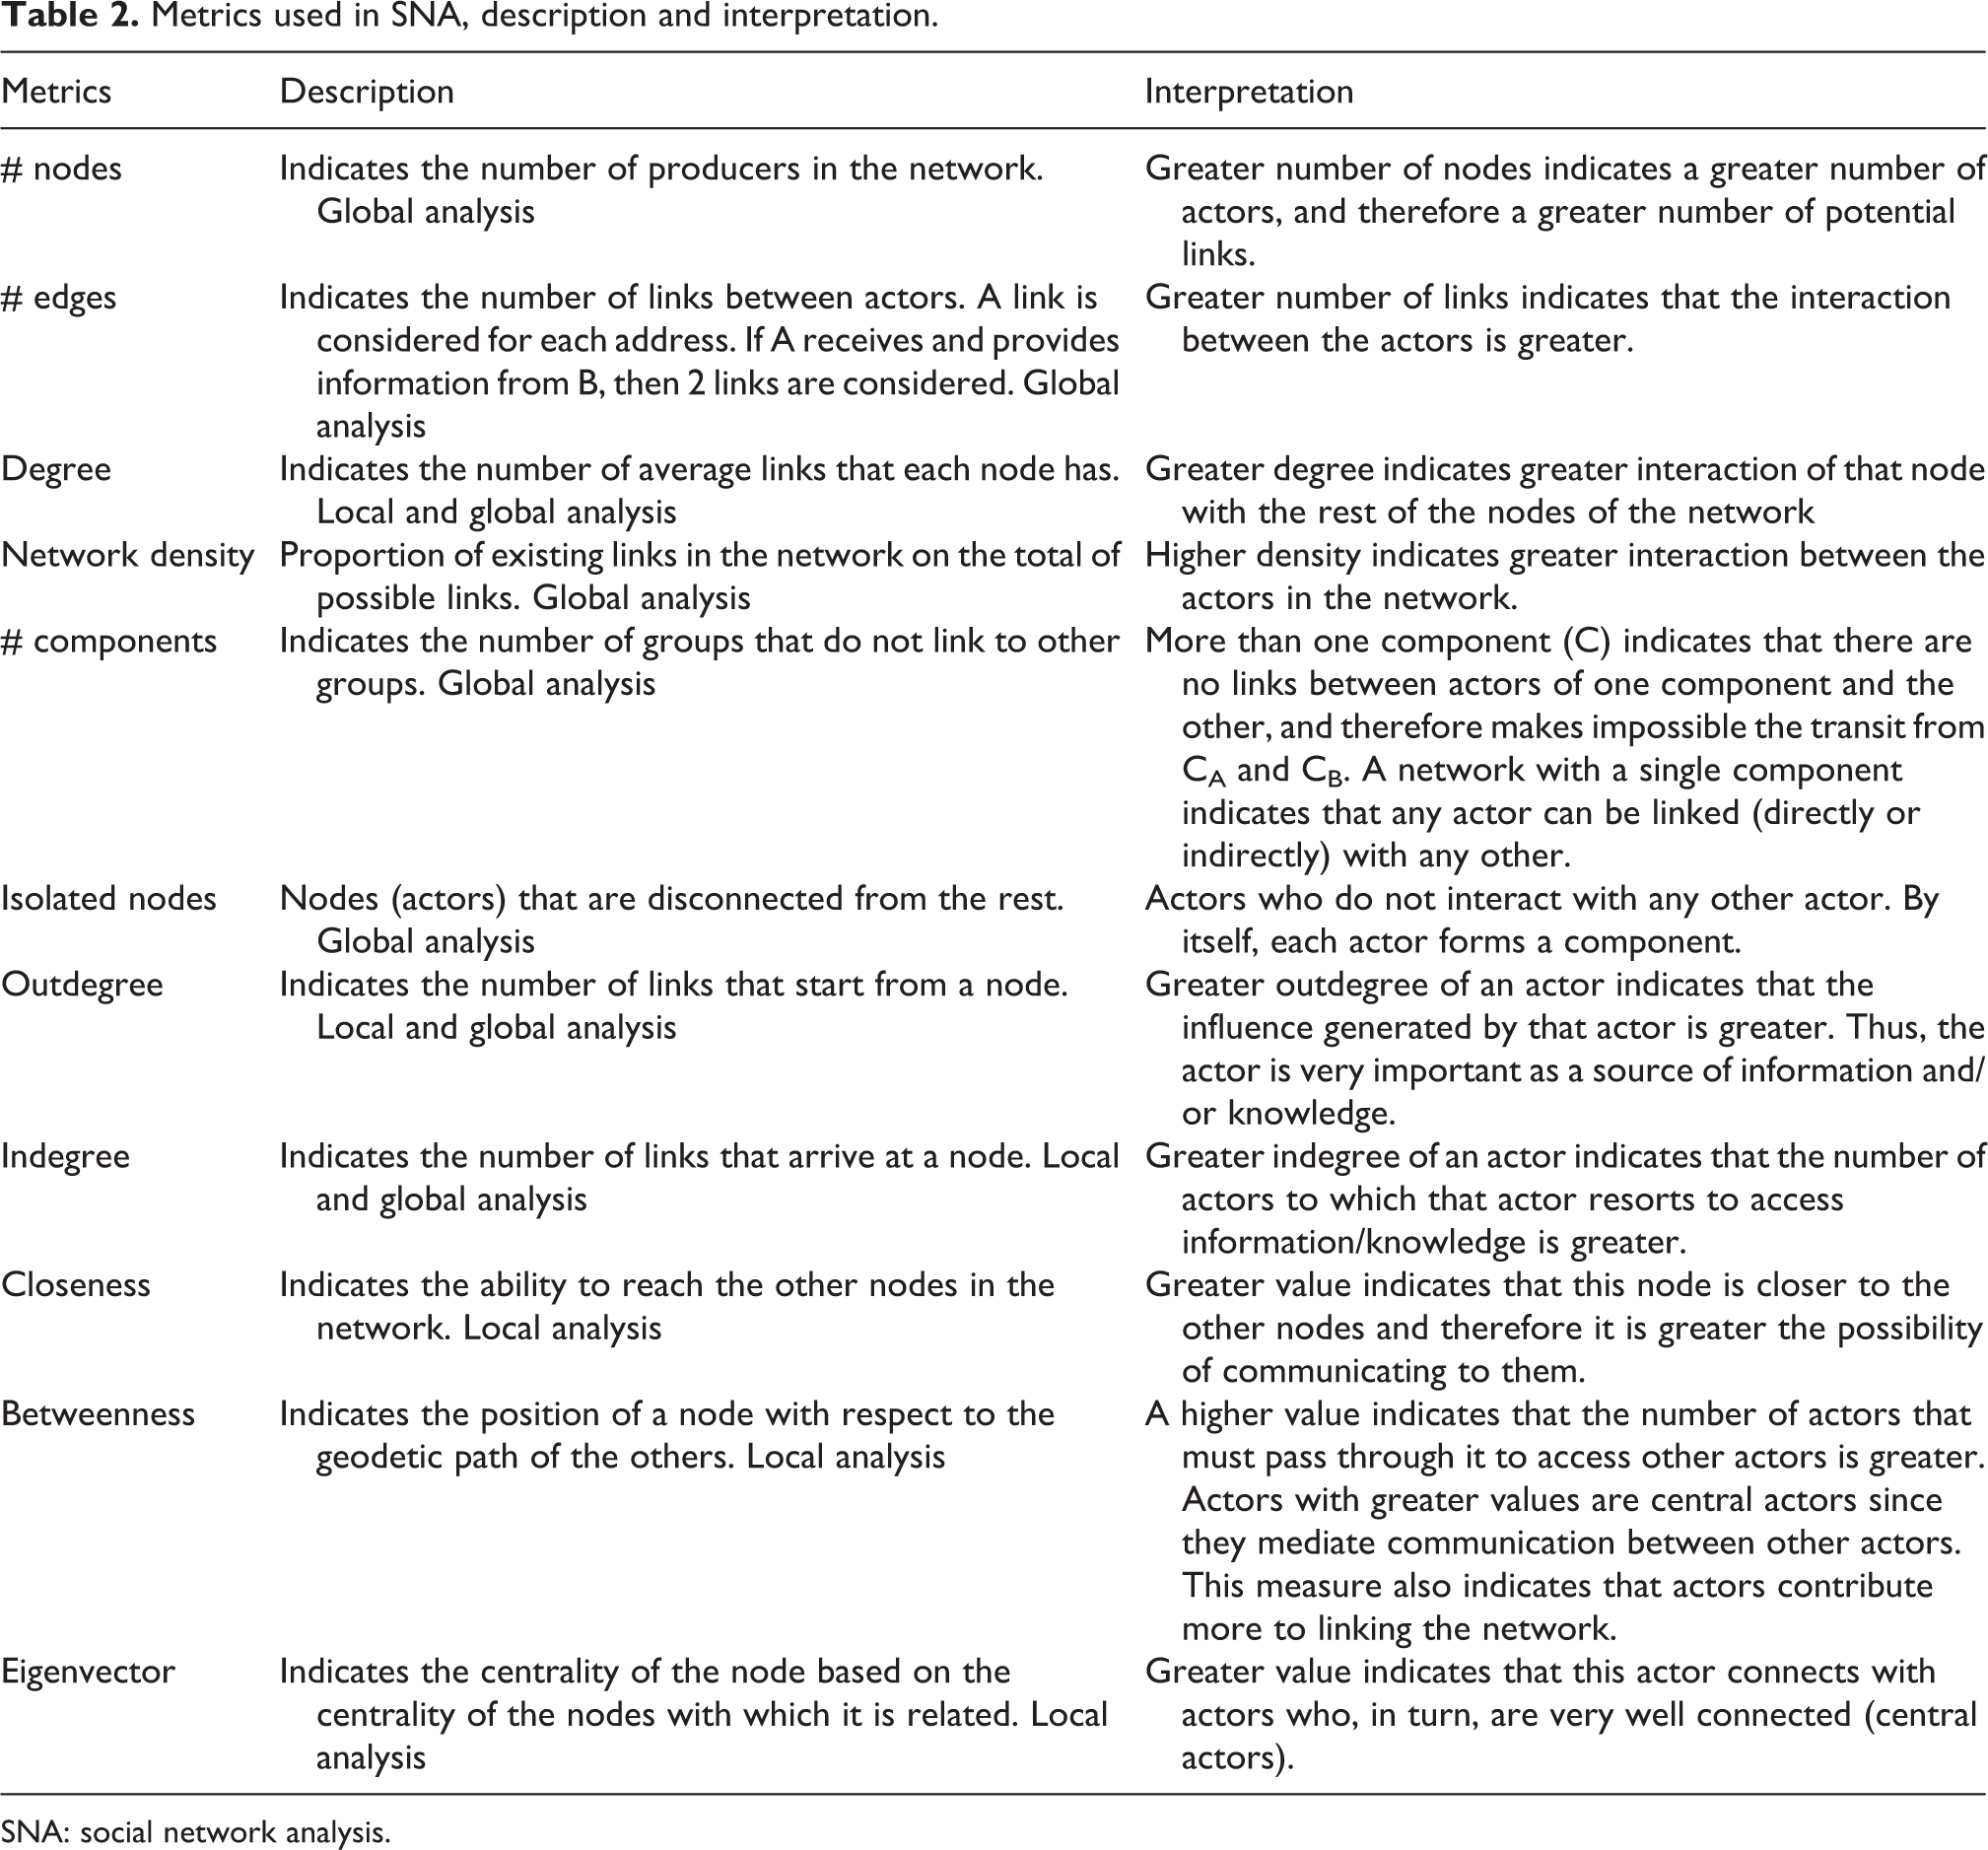
SNA: social network analysis.
Network transformation
The main driver able to determine network transformations was analysed. An evaluation of the potential disappearances of a node was performed starting with the potential impacts of the main threats present in the study area. Potentially affected nodes were assumed to be those that could not continue performing activities and/or were willing to abandon activities (i.e. due to low profitability and/or high vulnerability) if an appropriate offer for their land was made.
An assessment was performed to evaluate the situation at each farm, disposition to sell the farm, and, in the case of aged producers, the possibility of generational relief. In addition, the potential growth of forestry with exotic species was evaluated, beginning with an analysis of the potential transition using LCM. The potential transition to forestry was determined as occurring in 2025, a year that was arbitrarily chosen as a near-future scenario. It was assumed that the competence, and price relations, between livestock and forestry will not change in the projected period. The factors of influence defined for land use included priority forest land defined by the Uruguayan law, the land productivity index (MGAP, 1994), distance to current forestry activity, distance to roads and rural property size. We started with forestry maps generated through a supervised classification of LANDSAT 5-TM images in the years 2000 and 2010 in addition to a LANDSAT 8-OLI in the year 2015. The certainty of the transition generated by the LCM between 2000 and 2015 was verified. Because of this adjustment, we estimated that a transition would occur in 2025. We accomplished this using the Land Change Modeler module of IDRISI SELVA (Clark-Labs, 2009).
All information was processed through a geographic information system (GIS) containing productive and geophysical information to elaborate the LCM and the classification of satellite images.
Data analysis
We analysed whether the metrics identified in the SNA would significantly differ among the producers highlighted when managing the farm (i.e. those with greater AC and reduced vulnerability to drought) as compared to other producers. Moreover, we analysed the different values of vulnerability among producers identified as central nodes in the network and compared the obtained data to that of other producers. In both cases, a Mann–Whitney U test was used. The existence of statistically significant relationships between node metrics and vulnerability to drought was evaluated using Spearman’s correlation coefficient (ρ). A comparison of the centrality metrics between different types of producers defined according to their drought response capacities was made using a Kruskal–Wallis H test and Mann–Whitney U test for post hoc analysis. These analyses were conducted using R software (R Core Team, 2017); a significance level of 0.05 was established for all tests.
Results
The network included 54 nodes (i.e. 44 producers, 5 technicians and 5 institutions) and 271 unidirectional links corresponding to the interaction between producers and institutions (116, 43%), producers (69, 26%), producers and technicians (66, 24%) and those remaining (20, 7%) between technicians and their institutions. The presence of institutions and technicians determined whether the network had a higher average degree, higher density, lower number of components and lower number of loose nodes (Table 3). The average network degree was 5.0 as corresponding to the high degree registered by the five institutions (average degree = 22) and technicians (average degree = 8). Considering producers only, the network average degree was 1.6, which indicated an average link for each producer of less than two producers.
Descriptions of the complete network and the network only consisting of producers.
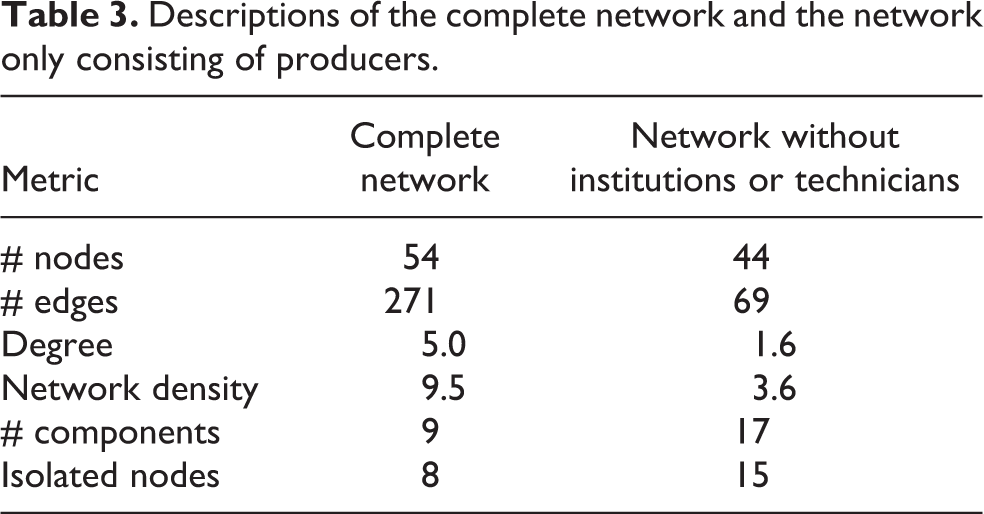
Half interactions were informal and were not regulated by any institution or formal framework. The other half corresponded to interactions within the association frameworks and between producers and the MGAP. An overall 65% of all informal interactions occurred between producers and central actors. The remaining 35% occurred between neighbouring producers.
All five institutions presented the highest values of closeness centrality. They were located among the first six places of centrality for degree, while three obtained the highest values in betweenness centrality (i.e. ARFC, MGAP and SFRO). ARFC presented the highest values of eigenvector centrality, and SFRO was ranked third. Private technicians and advising producers on MGAP-promoted support plans shared first place in the centrality ranking in all remaining cases.
In the absence of institutions and technicians, 15 producers did not present links (isolated nodes) (Figure 1). These producers presented the highest values for vulnerability among all producers (U = 125, p < 0.02). We identified eight producers presenting the highest values for the four centrality criteria used. These producers were therefore positioned as central network nodes. This group of producers presented the lowest levels of vulnerability (U = 67.5, p < 0.02). Four were located in configuration A, while the other four were located in B. Of these producers, four were identified by four or more producers as realizing critical property management in the area (two each in configurations A and B). On the other hand, four or more producers identified each of five producers that were notable for their leadership capacity, participation and organization (three in configuration A and two in B).
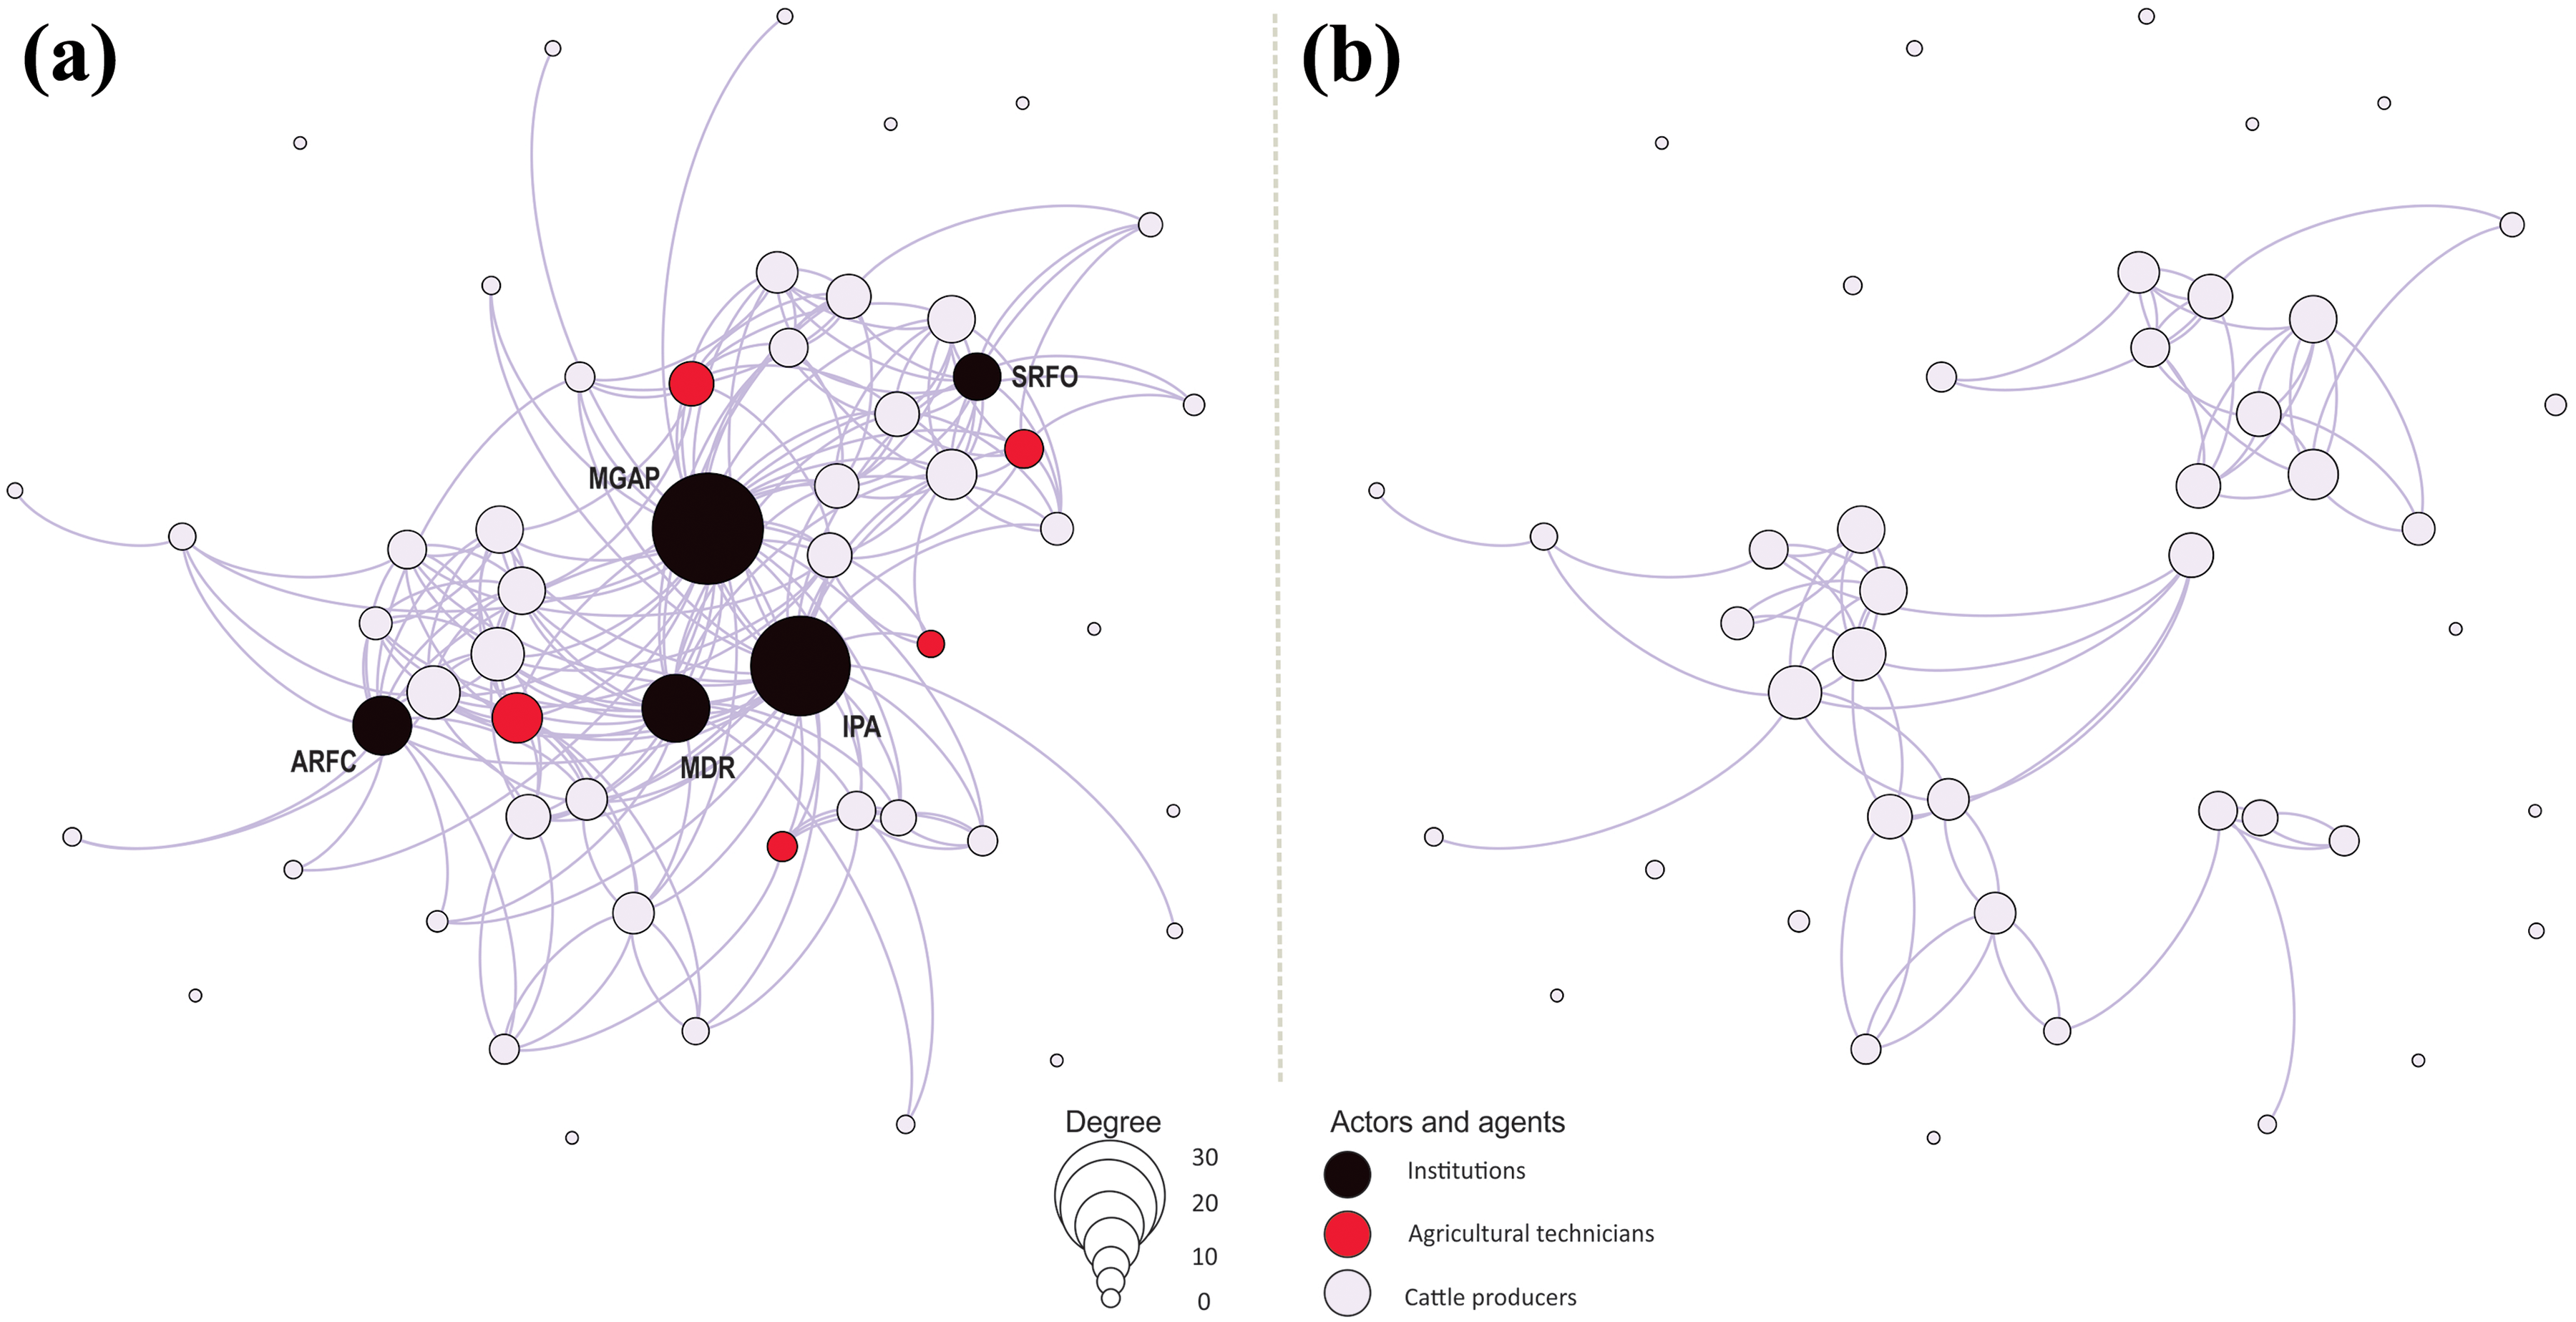
Diagrams of social networks considering producers, institutions and technicians (a) and only producers (b). Isolated nodes indicate producers that do not link to any other nodes.
Half of the producers identified by other producers due to the fact that they perform a good herd management of their farms (because they apply, at least, many of the following practices: stocking density adjustment, rotation between paddocks, herdsmen weaning time, body condition scoring application, gestation diagnosis, etc.) were not detected as central nodes (3/6). However, these producers presented values that were significantly higher than those of the rest in terms of their indegree (U = 52, p < 0.05) and outdegree (U = 42, p < 0.01), closeness (U = 50, p < 0.05), betweenness (U = 46, p < 0.05), eigenvector centrality (U = 47, p < 0.05) and, of course, the level of vulnerability (U = 38, p < 0.001).
Producers with the highest levels of vulnerability presented lower outdegree (ρ = −0.34, p < 0.01) and indegree (ρ = −0.48, p < 0.001). They also showed lower values of betweenness (ρ = −0.32, p < 0.05), closeness (ρ = −0.41, p < 0.05) and eigenvector centrality (ρ = −0.33, p < 0.05). Thus, producers with higher levels of vulnerability were less linked to other actors and occupied places of less centrality.
Considering the type of producers according to their capacity to respond to drought, type 4 were found to generally present the highest values of centrality, followed by types 2 and 3 (Figure 2). Lower values are presented in all cases by type 1, 6 and 5 producers. The differences between groups were significant in all measures of centrality (H = 24, H = 30, H = 23, H = 36; p < 0.01), which is explained by the value differences between groups 2, 3 and 4 and 1, 5 and 6 (p < 0.05). There were no significant differences between types within these groups (between 2, 3 and 4 or between 1, 5 and 6) (p < 0.05).

Average values of centrality according to the type of producer as defined by drought response capacity.
External drivers of the network
More than half of all analysed producers rented at least a part of the area they managed (25% rented more than 50% of its surface). This was highlighted as a serious limiting factor due to the high cost of renting land and the limited availability of land for rent. A total of 18% of all analysed producers (8/44, mostly older than 60 years of age) declared that their farm was not largely occupied by family generations. These producers presented a greater vulnerability to drought than did the rest of the producers (U = 56.5, p < 0.05).
A total of 84% of all producers were reluctant to abandon activity. The remaining 16% said that they would consider the possibility of selling or renting if the offers were good. Notably, the levels of vulnerability of these producers were not greater than the rest (four of seven were tenants). Finally, one producer identified as a central network actor considered the possibility of ceasing activity, while two central actors emphasized the problem of generational relief.
In 2025, the forest area will increase to 20,500 ha, a 30% growth rate compared to 2015; forestry will occupy 27% of the study area (Figure 3). This could exert a direct influence on the properties of 15 producers (i.e. 6 tenants and 9 owners). This will also directly affect the properties of five producers who do not discard the possibility of selling and abandoning activity. The increased forest area would reduce the livestock area by 10%, thus decreasing the natural grasslands surface available for rent.

Afforestation area evolution between 2000 and 2015 and projected changes for 2025.
This new stage would result in a network consisting of 34 nodes and 46 links, an average degree of 1.35, a density of 4% and 15 components (13 of which being isolated nodes). The new network would alter the arrangement of central actors in which five of the eight central producers would be those highlighted by the rest of producers due to performance. These five producers would experience an average decrease of 0.5 in their output degree. Changes in the network would also determine a reduction in the relative weight of links between producers equal to 4%, which is mainly assumed by technicians. The relative weight of the institutions remains constant, but, inside, it is the ARFC who presents the greatest impact since its links are reduced by 15%.
Discussion
The current network structure of producers, technicians and agricultural institutions in the study area is generally well connected. However, with low density, weak links and the centrally weighed institutions and technicians, there are actors who play key roles in transferring information. Some cattle producers also occupy a prominent role in the intermediation of information, but these are not necessarily those carrying out good management of their farms. Therefore, the information that may be transmitted is not necessarily the most appropriate. Although low density determines that this is not a central problem, it marks a double challenge for management since, besides facing the need to transfer information, it must ensure that the information is correct. Thereby, it emerges as a challenge to advance in training processes so that producers can correctly evaluate the information they receive. There is evidence of a fundamental problem due to the need to generate substantive changes in the productive practices of central nodes and/or to promote the increased centrality of producers who are properly managing their farms.
With generally weak links, the low density of interaction can hinder the transfer of knowledge and successful management experiences. This is because low density determines less redundancy and therefore fewer opportunities to mobilize information, provide resources and act collectively (Orchard et al., 2015). Additionally, in agreement with the proposed by Gómez and Saravia (2016), most producers conduct inefficient practices and thus increase drought vulnerability when attempting to prevail through overload without managing body condition and weaning time.
The scenario involving spatial propagation of the transformation thus seems very limited. Although it has been pointed out that high network density can negatively influence the heterogeneity of practices and thus hinder the potential for innovation (Oh et al., 2004; Reagans and McEvily, 2003), increasing density could enable the successful transfer of practices currently recognized for their efficiency. From the perspective of adaptation cycles, adverse configurations (traps) limit beneficial transformations (Carpenter and Brock, 2008; Gunderson, L.H. 2001). The situation identified in this study presents attributes of both rigidity and poverty traps. This statement is based on system connectivity in the accumulated economic and natural capital, including recent innovations in the livestock activity and low resilience to drought events. Typical attributes of a rigidity trap have been identified given that a connected system is present. However, there are relatively homogeneous ideas and practices available without implementing known innovations and clear alternatives with scientific support. Despite the fact that resources are not necessarily limited (due to the potential economic resources of some institutions and the low economic demands of some practices), there is not a clear capacity to consolidate alternatives allowing the system to evolve. This stands out as a key attribute of poverty traps (Westley et al., 2006). In addition, there is still a significant number of non-connected producers. This combination determines that transformations are extremely difficult in the current scenario due to innovations, when existing, are difficult to propagate and consolidate.
Institutions and technicians are central actors in the analysed network since they canalize more than 75% of the links. The high centrality of a node can have a positive incidence since it increases the efficiency in transferring information, but it can also be negative since it generates dependency, reduces the possibility of gaining access to other sources of information, and the risks are high when inappropriate information is transferred (Abrahamson and Rosenkopf, 1997; Weimann, 1982). These nodes are essential for strengthening network links and avoiding the formation of isolated nodes. Many producers also state that some formal groups of producers work well because of the integral role of the technician in charge. This is particularly important in the Uruguayan context since a major role for the implementation of public policy in family farms and in areas of high vulnerability was given to a private technician. In this sense, the information available and proposed by the agricultural institutions (and later by private technicians) is essential for reducing drought vulnerability. On the other hand, the low proportion of informal interactions deepens the role of public policy in transferring information and propagating practices designed to reduce vulnerability.
Strategies for strengthening the network must be simultaneously supported by changes in production practices. Otherwise, strengthening the network could have an adverse effect as homogeneous and highly connected systems tend to have greater resistance to change and less ability to adapt (Scheffer et al., 2012), and therefore to consolidate a rigidity trap. Considering the low rate of adoption for certain productive practices (e.g. livestock density adjustment, weaning time, rotation between paddocks and gestation diagnosis), strengthening the network should be accompanied by the promotion of practices that diminish vulnerability. Producers do not tend to implement these practices despite them being promoted by agrarian institutions (Cruz et al., 2018) and technicians and implemented by some producers. In this context, it is key to understand whether the non-application of potentially favourable alternatives responds to the lack of connectivity or simply the interests of producers for unknown reasons. Alternatives to reduce vulnerability to drought have been mostly designed in technical-academic areas, without the participation of producers. The government has taken decisions based on the available information, which despite being sometimes directed to particular producers, has failed to cover the diversity of existing producers. Although incipient experiences of co-innovation have reported favourable results in Uruguay (Albicette et al., 2017; Dogliotti et al., 2014), they are marginal in the area. Advance in these strategies, and also in the validation of alternatives currently underway in conjunction with the producers, can be opportunities for the dissemination and appropriation of alternatives by producers. This process of definition, implementation, evaluation and consolidation of alternatives, framed in adaptive management, is key to progress in the consolidation of strategies applicable to the diversity of producers.
The central producers are not necessarily identified by favourable management of their farms (in terms of vulnerability and associated components), which could generate adverse effects since the high centrality presents negative aspects caused by the high possibility of transferring inappropriate information or strategies (Abrahamson and Rosenkopf, 1997; Weimann, 1982). The information that is usually transferred is not necessarily the most updated or the most efficient for managing the farm and reducing vulnerability. It should be noted that farm managed by these producers are generally larger and that their vulnerability to drought is usually low. This situation adds greater complexity, since the information that is transferred generally stems from experiences on a scale of production exceeding that of most producers.
An inverse relationship between centrality and vulnerability was detected. However, the explained variability was less than 50% given that larger producers and those that did not have livestock as main income sources (lower levels of vulnerability) generally had few links to neighbouring producers. In addition, the most vulnerable were also those with less centrality. In both cases, the need to strengthen links was highlighted for the most vulnerable producers to access knowledge that allowed them to reduce their vulnerability and for less vulnerable producers to influence the effects of transferring knowledge. In these cases, it is necessary to know which fraction of vulnerability has a structural component (Díaz et al., 2017) and which part responds to the response capacity of the producer, which can be transferred to others. This is particularly important for large producers given that their low vulnerability can be associated with the scale of production and not necessarily the implementation of good managment practices.
The combination of threats potentially generates a new network that is less dense and contains less producer links, but has increased links with technicians. Therefore, the crucial role of technicians increases. Changes in producer centrality are not radical. However, these generate alterations in an order favouring the most central. This situation further complicates public policy analyses and management strategies given that the identification of central nodes from which to implement dissemination strategies must consider the dynamism in producer centrality. The situation is even more complex because, in addition to whether they exist, the composition and viability of links also differs at the temporal level (Baird and Gray, 2014; Islam and Walkerden, 2014). The main threat in the study region is the growth of forestry area, which determines the level of decrease in livestock areas and increases the price of land. Although this second impact was not analysed, it is a process that results in great uncertainty due to the potential transformation of an area containing many tenant producers.
SNA frequently assumes that networks have positive effects in generating resilience (Nygren and Myatt-Hirvonen, 2009; Rockenbauch and Sakdapolrak, 2017). In this work, there were advantages and disadvantages identified in centralities and their potential impacts on the inclusion and exclusion of actors in accessing information. Likewise, we identified the importance of agricultural institutions in network formation and in the generation and dissemination of information needed to reduce vulnerability, tasks that were often difficult, and demanded time and resources (Lyle and Smith, 2014; Nygren and Myatt-Hirvonen, 2009). On the other hand, it was demonstrated that current threats had a differential effect, mainly in the conformation of the network and centrality of the actors. Advances in these aspects are crucial to understanding the network dynamics and their impacts on the individual and collective behaviour of producers.
In the analysed system, attributes and characteristics typical of rigidity and poverty traps coexist and are determined by three key elements: network connectivity, the lack of interest for many producers in implementing alternatives and the inability of many actors to consolidate greater resilience strategies. Knowing the causality and contribution of each of these three factors is currently a great challenge in reducing drought vulnerability. This is mainly because of the severity of current droughts, which could contribute to the disappearance of some cattle producers, mainly those managing smaller areas and which lack other income. Current productive strategies prevent exploitation of the maximum productive capacity during years with favourable rainfall and are probably insufficient to cope with a more extreme drought regime in the future.
Conclusions
The integration of static and dynamic approaches in social networks allowed characterization of the cattle producer network, the circulation of information and the transfer of knowledge needed to reduce drought vulnerability. This research highlighted the existence of a network that was not very dense, but which was connected, thus emphasizing the existence of rigidity and poverty traps that limit possible adaptation of the system to promote the reduction of drought vulnerability. This context is even more complex because central actors (producers) did not stand out for being related to good management practices. This situation in general is not addressed by public policy, which adds further complexity to the process of designing and implementing adaptive practices. This information allows the identification of potential restrictions in transferring information that is needed to increase AC and decrease drought vulnerability. It also provides a framework that can be applied to other productive sectors, threats and geographical contexts.
Footnotes
Acknowledgement
The authors express their gratitude to the cattle producers and technicians who participated in the interviews.
Declaration of conflicting interests
The author(s) declared no potential conflicts of interest with respect to the research, authorship and/or publication of this article.
Funding
The author(s) disclosed receipt of the following financial support for the research, authorship and/or publication of this article: This research has been carried out with financial support from the CAP-UDELAR.