
Abstract
This paper focuses on resolving a defect of population-based urban sprawl analysis from a land-use planning perspective. This defect is indicated for a few metropolitan areas, which have experienced a controversial phenomenon of population decentralisation but with potential household centralising force. With the emphasis on household movement, this paper first aims to clarify the role of populations, households and employment that characterises urban sprawl and to check if unmet housing demand in city centres can be identified. Second, we evaluate the influence of household distribution factors, such as unmet housing and land-use related factors, on spatial-structure-based compactness/sprawl, taking time lag into consideration. A new classification of urban forms is developed to identify potential residential centripetal market forces. Additionally, the housing demand generation-distribution + push-accessibility-pull (GD+PAP) analysis framework is applied. The results of an empirical study on the Taipei metropolitan area between 1980–1990 and 1990–2000 suggest that the most significant policy towards compactness is high density. We recommend a prioritisation in city centres, particularly when housing demand is underserved.
Extensive studies on compactness and sprawl of urban form continue to accumulate knowledge on methods of quantifying compactness/sprawl (Jaeger et al., 2010a, 2010b; Tsai, 2005), quantification (Cutsinger et al., 2005. Hayek et al., 2011; Terzi and Kaya, 2011) and classification (Schwarz, 2010) of metropolitan areas as sustainable development progresses and expands as a result of global climate change, increasing population growth and governmental financial shortages, among others. Its causes and countermeasures and various aspects of impact evaluation for metropolitan areas is considered (Ewing, 2008; Lieske et al., 2012). The spatial structure of populations that reflects the collective results of population growth and household movement is frequently used to measure compactness/sprawl. The possible reasons are its role in sustainability, clear characterisation of observable urban forms and data availability, among others. Decentralisation results from such factors as household preferences for suburban living (Garcia-López, 2010) and the degraded quality of life in city centres has played a significant role in the phenomenon of urban sprawl. From this, there is less compactness in city centres and other local sprawl phenomena such as low-density development. Nonetheless, decentralisation in monocentric metropolitan areas is not necessarily unsustainable if it develops into a polycentric urban form. This is increasingly regarded as compactness (Anderson et al., 1996; Tsai, 2005).
However, population-based observations do not properly reveal if housing demand forces are decentralised or centralised. For example, between 1990 and 2000, Taipei city was the primary core of the greater Taipei area in Taiwan that experienced decreasing population growth but an increasing number of households because of shrinking household sizes. Anti-sprawl policies based on decentralising populations without a consideration of centralising households, could be inappropriate because of misdiagnosis of the housing demand. The identification of housing demand is significant for urban planners to develop or to revise land-use plans. The primary focus of this study is that housing demand and market-oriented policies are more likely to succeed than plan-led policies because the former work with populations. Nonetheless, household data (significant in identifying household movement) is rarely considered in this way. On this basis, household and population locations rather than employment-based urban forms are studied (Giuliano et al., 2008).
Two methodological adjustments seem rational but are seldom adopted jointly. One is the housing demand and supply and its resulting unmet housing demand that initiates household migrations (Giuliano et al., 2008) and the distribution of households. The other is analysing the impact of urban sprawl factors more dynamically and takes into account the time lag between them to provide more a complete and direct analysis than cross-sectional analysis will.
Hence, first, we clarify the roles of population, households and employment data to examine urban sprawl and to check if unmet housing demands in city centres are identifiable. Second, we evaluate the impact of household (re)distribution factors considering potential time lag.
Urban compactness/sprawl statically and dynamically
Compactness and sprawl are usually regarded as opposites of urban forms. There are many definitions because of an intermingling of urban forms and consequences (Jaeger et al., 2010a; Tsai, 2005). A universal definition does not exist but a few definitions are popularly accepted. From sprawl, low-density (i.e. density-based), strip and leapfrog (i.e. spatial-structure-based) developments in unbounded outlying areas are widely regarded as signs of sprawl (Ewing, 1997, 2008). At the other end of the spectrum, compactness usually involves a concentration of housing or employment. Using these definitions, an alternative has been developed that characterises spatial-structure-based compactness and sprawl together: (1) monocentric sprawl as compactness, and (2) decentralised sprawl as sprawl (Ewing, 1997; Gordon and Richardson, 1997). Polycentric urban form is increasingly regarded as compactness (Anderson et al., 1996; Tsai, 2005). The degree of compactness for metropolitan areas is degraded if local sprawling conditions occur as strip and leapfrog developments (Tsai, 2005).
Various dimensions of definition have also been proposed from different perspectives to characterise and quantify compactness/sprawl or to evaluate different aspects of impact such as land consumption, lack of open space, public service costs, travel efficiency and air pollution (Ewing, 2008). These dimensions include equal distributions or concentrations, centrality, continuity (Cutsinger et al., 2005; Tsai, 2005), nuclearity (the above are shape-related), mixed use (diversity-related) and proximity (Cutsinger et al., 2005; Ewing, 2008; Galster et al., 2001). 1 However, some definitions adopt more than one dimension with statistical techniques and even involve population and employment data to reveal more detail of urban forms (Cutsinger et al., 2005; Jaeger et al., 2010b). The application depends on data availability, ease of comprehension and interpretation or the development of software for complicated calculations.
Numerous urban sprawl indexes have been developed and have evolved (Ewing, 1997; Terzi and Kaya, 2011) based on landscape, population or employment data (Cutsinger et al., 2005; Schwarz, 2010) and have been reviewed thoroughly to quantify compactness/sprawl. 1 Alternatively, population-based sprawl indexes are classified as follows: (1) density; (2) degree of equal distribution or concentration; and (3) spatial clustering of high-density areas (Tsai, 2005). First, density level is the result of density policies for land-use plans and market demands. One theoretically sound density variable that truly quantifies activity intensity of developed residential land alone, excludes undeveloped parcels (i.e. net density), and is not readily retrievable for all cases because its data management is demanding. For example, only gross density (population divided by land areas of all urban land uses) is available in Taiwan, but not net density. Its application of density to gauge changes in urban sprawl over time demands particular caution because if the same boundary containing undeveloped areas is adopted to calculate density at different time points, the overall density reflects a change in population size, but not in density for all developed land. Second, variance- or concentration-based sprawl indexes, including the Gini coefficient, relative entropy (Thomas, 1981) and Sprawl Index (SI) (Lopez and Hynes, 2003) have gauged the degree to which the activity is evenly distributed across metropolitan areas. Third, the Moran’s I coefficient is applied to further quantify the spatial clustering pattern of high-density parcels (Tsai, 2005).
The above definitions of compactness/sprawl are static and usually applied for comparison analyses among metropolitan areas (i.e. cross-sectional analysis). Further, they are applied to the same metropolitan area over time to address dynamic transformation processes (Garcia-López, 2010; Jaeger et al., 2010a). The dynamic framework, taking time lag into consideration, has the capacity to evaluate how the urban form changes directly as a result of changes in socio-economic characteristics, land use or transportation, housing policies as well as whether a certain type of land use (Garcia-López, 2010) or transportation system tends to cause sprawl more than other characteristics over time (Baum-Snow, 2007; Pendall, 1999).
Spatial structure-based decentralised sprawl processes can be defined as the urban centre(s) growing at a lower rate than its outer areas (Gillham, 2002; Glaeser and Kahn, 2004). According to this definition, North American metropolises in the 1970s have tended towards decentralisation if they have not developed in a polycentric form with subcentres, while European metropolises were centralising (Muller, 2004), though Switzerland was criticised for its urban sprawl (Jaeger et al., 2010a).
The above spatial-structure-based definition differs from density-based aspects to define the same level of urban compactness/sprawl as metropolitan areas develop. Metropolitan areas that grow at the same rate in each subarea maintain the same compactness level. Figure 1(a) shows an example of a monocentric metropolitan area that can also be applied to a polycentric metropolitan area. However, its metropolitan density has increased and is regarded as more compact and with centripetal market force. In contrast, a metropolitan area that grows to maintain the same density (Figure 1b) can actually be decentralising and expanding, and consequently is regarded as sprawl (Jaeger et al., 2010a). Hence, it is hard to reach a consensus on the same level of compactness when a population increases. Nevertheless, if the same levels of compactness or sprawl considered the impact of the two urban forms on travel behaviour or cost of infrastructure, it is even harder to reach. The reason for this is that they are unlikely to be the same for either equal-growing-rates or maintaining-same-densities.

(a) Equal-growing-rate urban form. (b) Same-density urban form.
Archetypal urban form based on city centre(s) transformation from population, households and employment
Urban sprawl has been assessed from activity and landscape perspectives for different purposes. Population and employment distributions (Garcia-López, 2010; Hayek et al., 2011; Lee, 2007) are most commonly adopted data to analyse residential and economic activities. They are collectively reflected by building distribution of landscape-based data (Jaeger et al., 2010a). Incorporation of rarely adopted household distribution data provides a more complete picture of activity dynamics for identification of residential centripetal forces, rather than population. In short, changes of household and population distributions represent migration directions for residential units and the resulting spatial structure transformations after migration that are crucial for instances when the changes are significant or opposite. Additionally, an activity-based sprawl index may be more suitable for activity-based impact evaluations, such as sustainable transportation levels affected by distributions of population and employment. In contrast, a landscape-based sprawl index is more appropriate for ecological concerns such as land consumption. Hence, a sprawl index must consider the evaluation field, which complicates definitions of urban sprawl.
Six types of archetypal urban forms have been developed (Table 1) for monocentric or polycentric urban forms for identified city centres from data on population, households and employment in the city centres for two time points. Other than the traditional bipolar classification of centralisation and decentralisation, the change of household numbers in city centres further classifies metropolitan areas with residential centripetal market forces if the number of households increases. Controversially, where city centres experienced decreasing populations but increased number of households, the population distribution was decentralised but with an increased housing demand. The reason for this is that households are moving inwards or new households remain in city centres derived from household fission for such reasons as fewer than three-generation households, increases in single-parent households and single households because of late marriage.
Archetypal urban form based on city-centre(s) transformation.
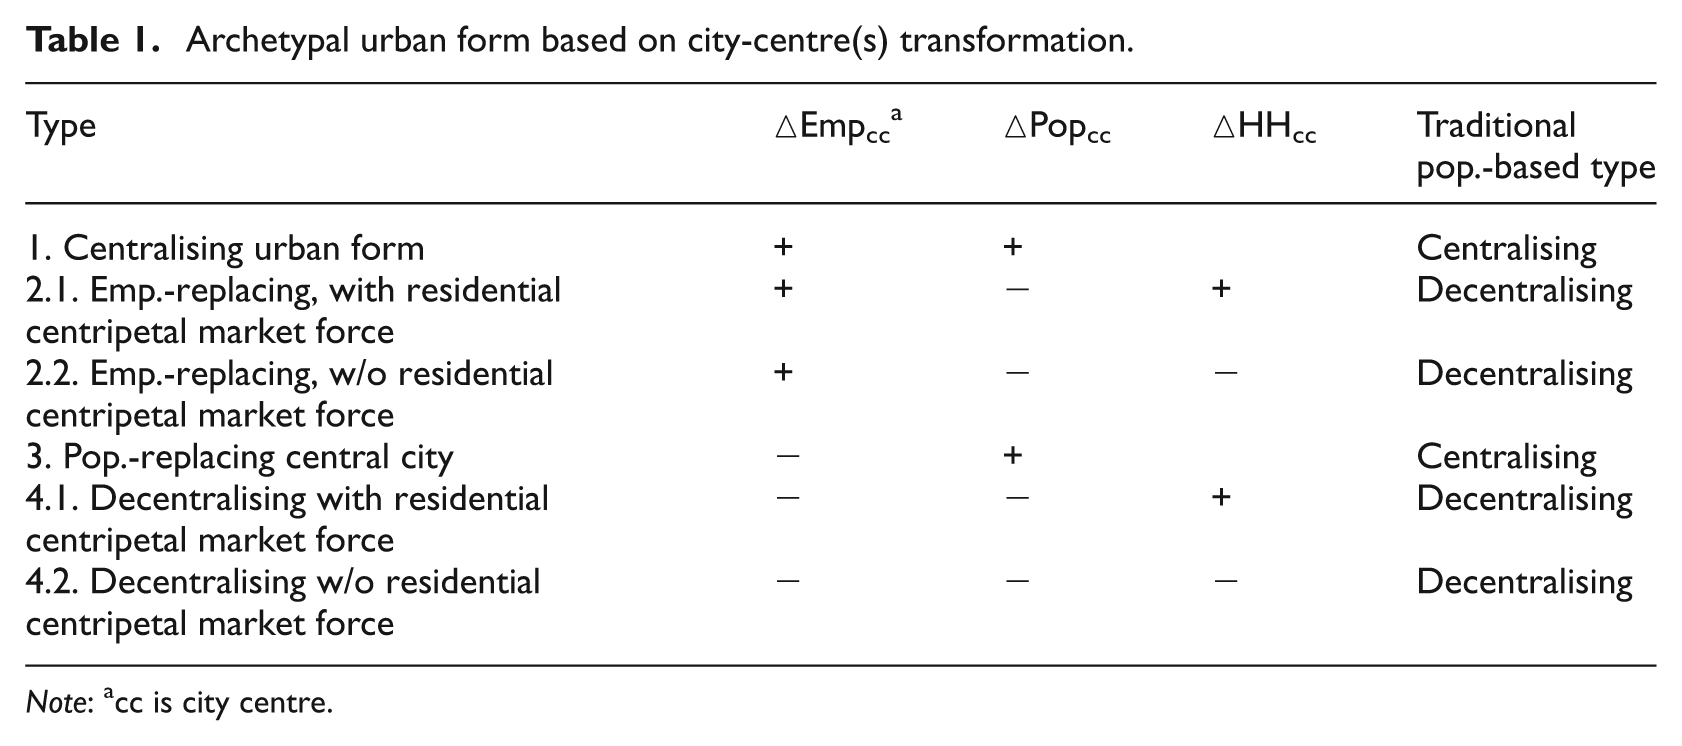
Note: acc is city centre.
Housing demand GD+PAP analysis framework for the urban sprawl process
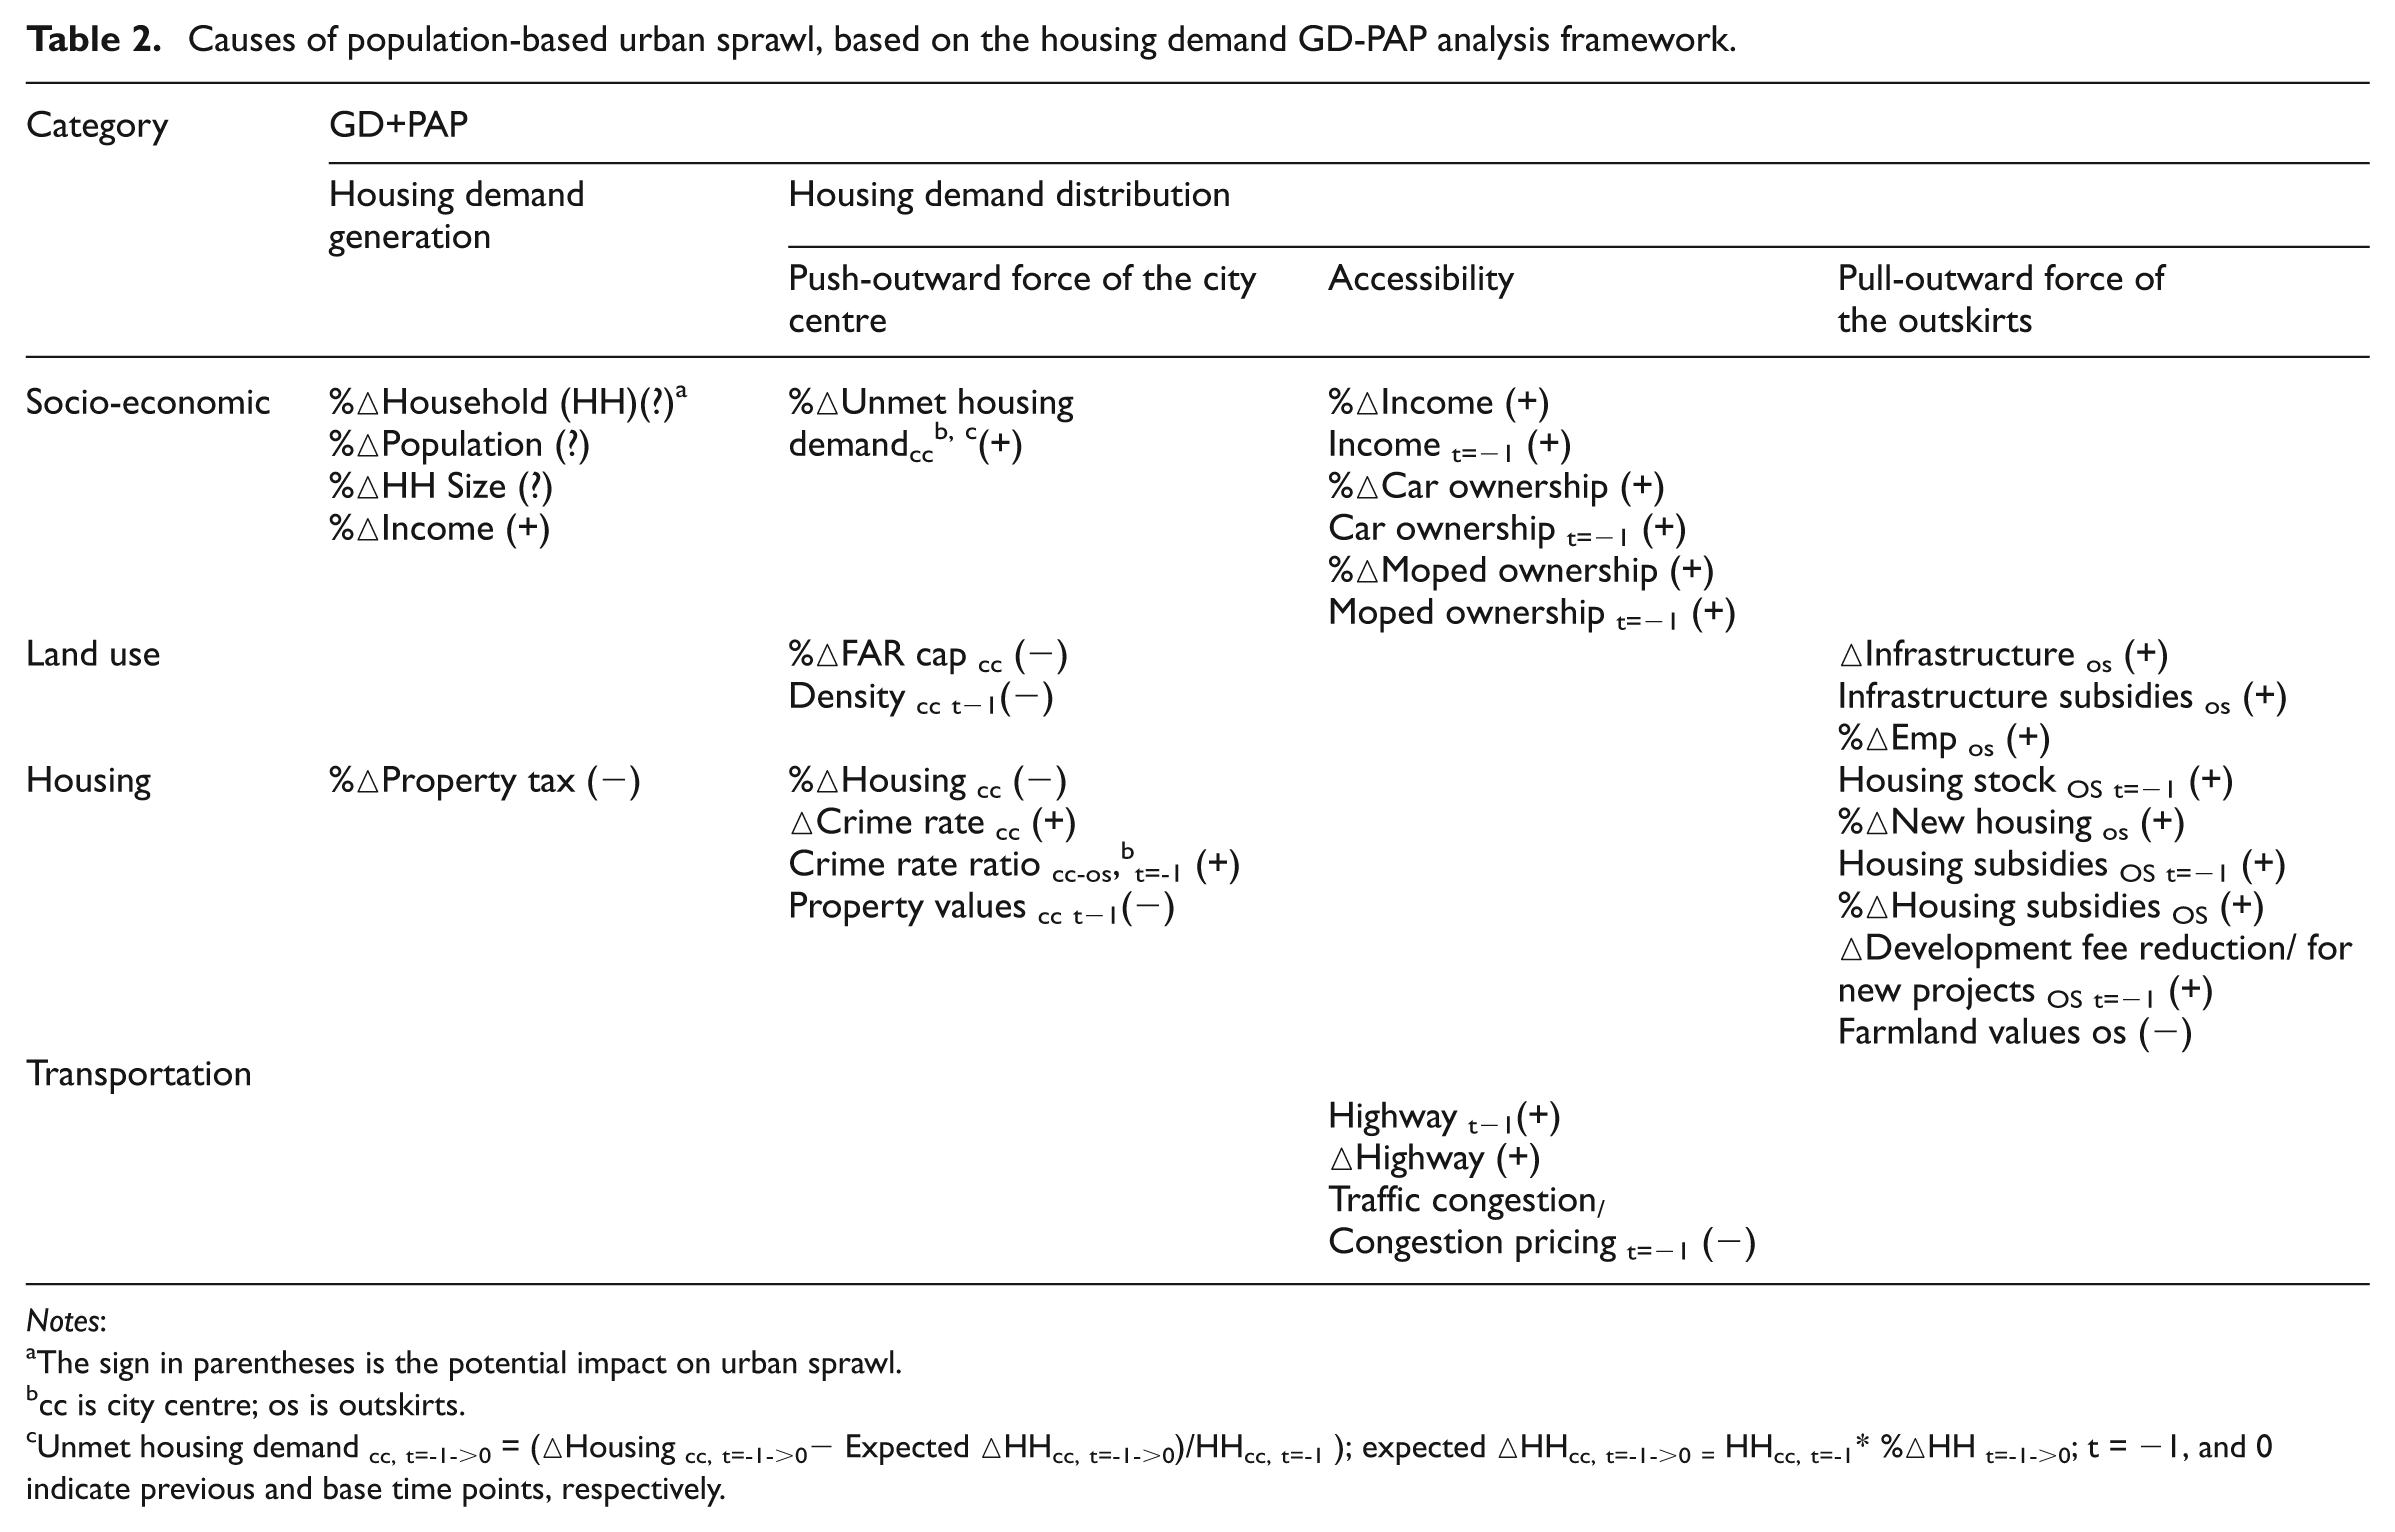
This section addresses an alternative analysis framework for organising causes of population-based dynamic urban sprawl – housing demand GD+PAP. The GD+PAP is based on Ravenstein’s laws of migration (1876) and the push-pull model of urban economists (Dorigo and Tobler, 1983; Nechyba and Walsh, 2004; Tiebout, 1956). This framework is based on new housing demands initiating population distribution and together with the redistribution of existing populations, may develop towards centralisation or decentralisation, depending on preferences of housing and location characteristics affected by attractiveness of city centres and its outskirts. This can be further cross-classified into socio-economic, land-use, housing and transportation characteristics (Table 2). Finally, the distribution form is shaped by the land-use plans for boundaries and densities.
Causes of population-based urban sprawl, based on the housing demand GD-PAP analysis framework.
Notes:
The sign in parentheses is the potential impact on urban sprawl.
cc is city centre; os is outskirts.
Unmet housing demand cc, t=-1->0 = (△Housing cc, t=-1->0− Expected △HHcc, t=-1->0)/HHcc, t=-1 ); expected △HHcc, t=-1->0 = HHcc, t=-1* %△HH t=-1->0; t = −1, and 0 indicate previous and base time points, respectively.
Housing demand generation
Increased housing demand is largely caused by population growth, increased incomes (Brueckner, 2000), and shrinking household sizes and property taxes (Brueckner and Kim, 2003), among other factors (Table 2). Housing demand stimuli will certainly change urban forms. The higher the demand for new housing, the greater the changes of urban forms. Increased households may cause development that is more compact when urban centres still have room. On the contrary, for well built-up metropolitan areas, increased housing demands may lead to sprawl if not accommodated by high-density, particularly in the city centres.
Housing demand distribution: Push-accessibility-pull
Push-outward force of city centre(s)
The push-outward force of city centres is composed of unmet housing demand (quantity-based within a housing type) and unattractive qualities of city centres that cause households to move outwards from centres (Table 2). The unmet demand may occur naturally when the city centres reach capacity or from poor planning, such as a relatively low-density limit and the inertia of urban renewal. Failure because of poor planning differs from market failures and corresponding policies. The former relies largely on coping with market needs, while the latter focuses on internalising external costs such as the development of new projects of pull-outwards forces and traffic congestion (Brueckner, 2000; Terzi and Bölen, 2011). The quality-based push-out force is affected by characteristics that downgrade liveability and increase living costs in city centres, such as housing prices and crime rates (Cullen and Levitt, 1999).
Pull-outward force of the outskirts
The pull-outward force of the outskirts attracts emigrants from city centres. Similar to the push-out force above, the characteristics of the pull force can also be classified as quantity-based and quality-based, such as change of housing supply during a period and characteristics that improve the liveability of the outskirts, including suburban green environments (Giuliano et al., 2008); amenities (Brueckner et al., 1999); improved (Mieszkowski and Mills, 1993) or subsidised infrastructure or services (Brueckner, 2000); housing subsidies (Raup, 1975); and increased employment (Garcia-López, 2010; Thurston and Yezer, 1994) (Table 2).
The indexes of the push and pull forces quantify the conditions of city centres and outskirts. Furthermore, some of the indexes are relative, such as differences or ratios to quantify the relative conditions between the city centres and outskirts as addressed in the differential attractivity model of migration (Lucas, 1981).
Accessibility
Improved accessibility makes travelling and commuting between city centres and peripheral areas much easier to trigger or reinforce decentralisation for larger, cheaper housing and quality amenities. Accessibility is enhanced by an upgraded transportation system (Steen, 1986), better routing, technological innovations in information and communication, lower transportation costs or increased incomes. On the contrary, accessibility is degraded by such factors as congestion pricing (Table 2). The impacts of accessibility on urban sprawl are observable dynamically and statically. Residents with more accessibility capacity, e.g. higher incomes, can move to the outskirts more easily than residents with lower individual incomes or living in a city with fewer highways. Additionally, available transportation types may affect urban forms differently. For example, highways are likely to lead to more sprawling forms than mass rapid transit. In addition, the routing of transportation matters as radial-form routing leads to more sprawling urban forms than circular-form routing does (Hart, 1992).
Land use
The land-use plan sets the fundamental tone of urban forms for density and location of development after the distribution effect, which cannot be achieved without market support. First, a higher-density policy may lead to more compact urban form if the market force supports it. A city with high density may indicate its acceptance by the market. Second, the decentralised population from the city centre(s) is scattered in low-density outskirts. However, this is not necessarily so for the case of formation of new subcentres, such as in many European cities between the 1960s and the 1980s (Anas et al., 1998). Suburban transit-oriented development (TOD) areas are a phenomenon of decentralised compactness. Finally, containment policy also directs development (Jaeger et al., 2010a).
Research hypotheses
There is a three cause–effect relationship for urban sprawl that may exist as the metropolitan area develops over time based on the above housing demand GD+PAP analysis framework. This hypothesis is focused on land-use related policies, with others as control variables for serving the needs of such urban planners in Taiwan with a primary tool. First, unmet housing demand in city centres (the deficit in housing supply due to household growth) is likely to initiate decentralisation for mono- and polycentric cities and distributed to lower-density settings in the outskirts. In other words, unmet housing demand in city centres may initiate urban sprawl. Second, the push force of city centres improved accessibility and the pull force of the outskirts contributes to low-density development of the outskirts. The third hypothesis is that how urban form contributes to a decentralised population may depend on density policies of land-use plans. The higher the density policy, then the more compact the metropolitan area may grow.
Research methods
This research involves the classification of metropolitan areas according to changing environments of city centres and the development of urban sprawl models must consider time lag between sprawl and its causes. The causes probe if housing demand market forces for centralisation exist, while sprawl examines its causes with land use as policy variables based on the GD+PAP analysis framework. This empirical study is conducted for the 36 metropolitan areas (the so-called ‘one-day living boundary’) in Taiwan.
The model was developed first with bivariate analysis to acquire the appropriate mathematical relationships between dependent and independent variables with panel data regression to control for other non-target variables. The analyses were conducted for three time periods: 1966–1980, 1980–1990 and 1990–2000 and date back to the earliest availability of population, housing (Executive Yuan of Taiwan Government, 1966, 1980, 1990, 2000), industry and commercial census data (Executive Yuan of Taiwan Government, 1966, 1981, 1991, 2001). The maps with the necessary detailed subarea boundaries were only available for 1981, 1991 and 2001. Hence, some of the analysis is quite limited in these periods. The city centres have been defined according to the ‘one-day living boundary’ system (Yang and Lin, 2003), which gives a single centre for most smaller metropolitan areas (i.e. monocentric) and multiple centres for larger metropolitan areas (i.e. polycentric). Additionally, most city centres contain multiple employment centres and are regarded as primary intended development areas. The software used was ArcGIS and STATA.
Urban sprawl model
A population-based SI (Lopez and Hynes, 2003) (equation 1) was adopted to measure urban sprawl for this model (equation 2) for three reasons. The first is that this model emphasises spatial structures (as opposed to density per se). The second is that the unavailability of the 1966 maps made it impossible to calculate an ideal Moran coefficient because of small sample size to conduct panel data regression. Finally, the SI quantifies the extent that population lives in high-density subareas where normally the urban cores are located, which may be better than other equal-distribution indexes. The SI theoretically ranged between 0 and 100 to provide a better sense of the values. The larger the SI value, the more sprawl or the higher the percentage of the population living in low-density subareas. An SI with a score of 50 represented equal distribution. The thresholds of high- and low-density for this research are set at the 80th and 20th percentiles of all the subareas of the metropolitan area rather than for all the metropolitan areas. The reason was that if they are based on all metropolitan areas, the cut-off points might change for different time periods. In this case, a metropolitan area whose urban form remained the same over time may have different SI values or it may have the same SI even if the urban form changes.

where Si and Di are the percentage of total population in the bottom and top 20% dense subareas, respectively.
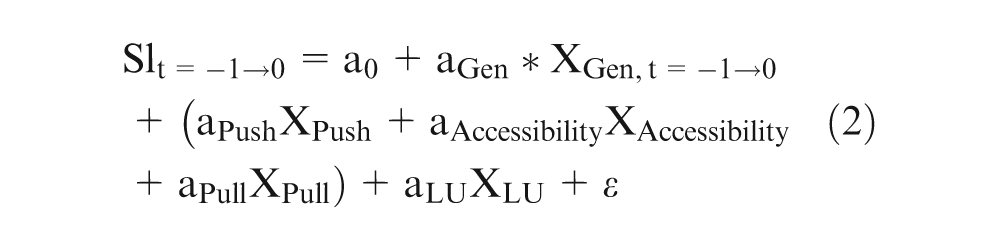
where △Slt =−1→0 is the change of SI between the previous period (t = −1) and the base period (t = 0); XGen, XPush, XAccessibility and XPull are the arrays of housing demand generation, push-outward, accessibility and pull-outward variables, respectively (see Table 4); XLU is the array of land-use variables regarding density and containment; a0 is interception, and aGen, aPush, aAccessubility, aPull and aLU are coefficients.
The time periods for XPush, XAccessiblity, XPull and XLU can be both the change from the previous period to the base period (i.e. t = −1→0) and the previous period (i.e. t = −1), depending on the cause–effect relationship, i.e. to assess the change of sprawl index resulting from changes in characteristics, or whether certain conditions of characteristics tend to cause sprawl. Most independent variables are standardised, such as percentage-based variables to build a reasonable comparison base for different metropolitan areas as well as the same metropolitan area at different time periods. Absolute and relative forms of independent variables were developed based on different rationales addressed in the literature review.
Descriptive statistics of the 36 metropolitan areas in Taiwan
Urban sprawl trends in Taiwan, 1980–1990–2000
The 36 metropolitan areas in Taiwan are classified according to the six archetypal urban forms based on the combined development patterns of population, household and employment in the city centre(s). From 1980–1990 and 1990–2000, about half were experiencing centralisation (i.e. type 1); with increasing populations and employment in city centres (Figure 2). The second popular type was city centre(s) with increasing employment and decreasing population but an increasing number of households (i.e. type 2.1) (some 20%). These metropolitan areas have possibly experienced centralising economic activities and more households were able to stay or move into city centre(s). However, the population in city centres shrunk because of shrinking household size. Hence, this is recognised as population-based decentralisation. The average household size in Taiwan decreased from 5.9 to 3.3 people at a quite stable rate between 1966 and 2000 (Executive Yuan of Taiwan Government, 1966, 1980, 1990, 2000). These population-decentralising metropolitan areas were likely to have housing demand in the city centre(s). Hence, the decentralisation could be diminished or even reversed if housing supply had been increased through relaxing floor area ratio (FAR) cap and dwelling sizes were adjusted through market forces long term or by policy incentives. These demand-served policies, once provided, would be efficient to resolve urban sprawl.
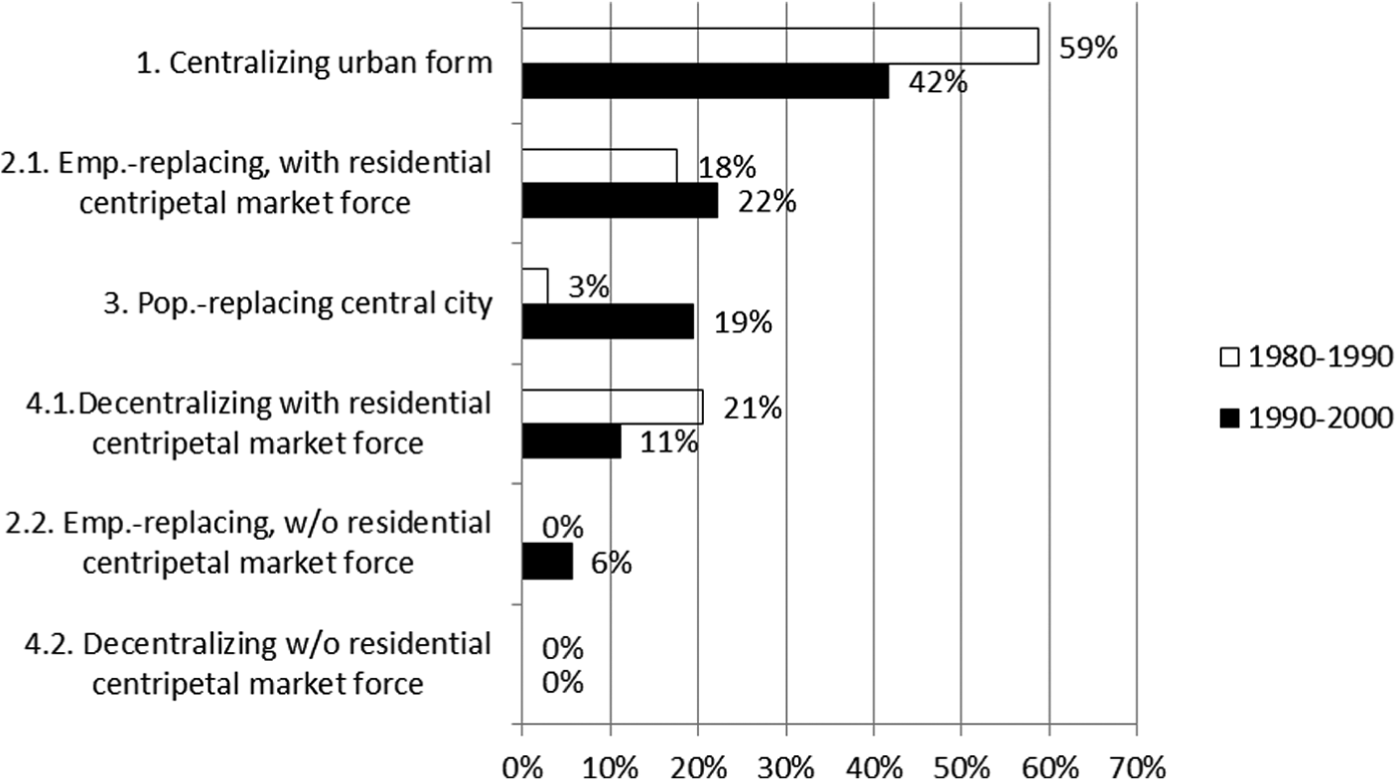
Share of archetypal urban forms in Taiwan: 1980–1990, 1990–2000.
Another popular type for the 1990–2000 period was city centres with increasing population but decreasing employment (less than 20%) (i.e. type 3). Finally, between 11% and 21% of metropolitan areas experienced reduced populations and employment-weakening decentralisation in those two decades. However, fortunately, there was continuing housing demand in city centres (i.e. type 4.1). The weakened city centres were likely to be strengthened by the above demand-served housing policy.
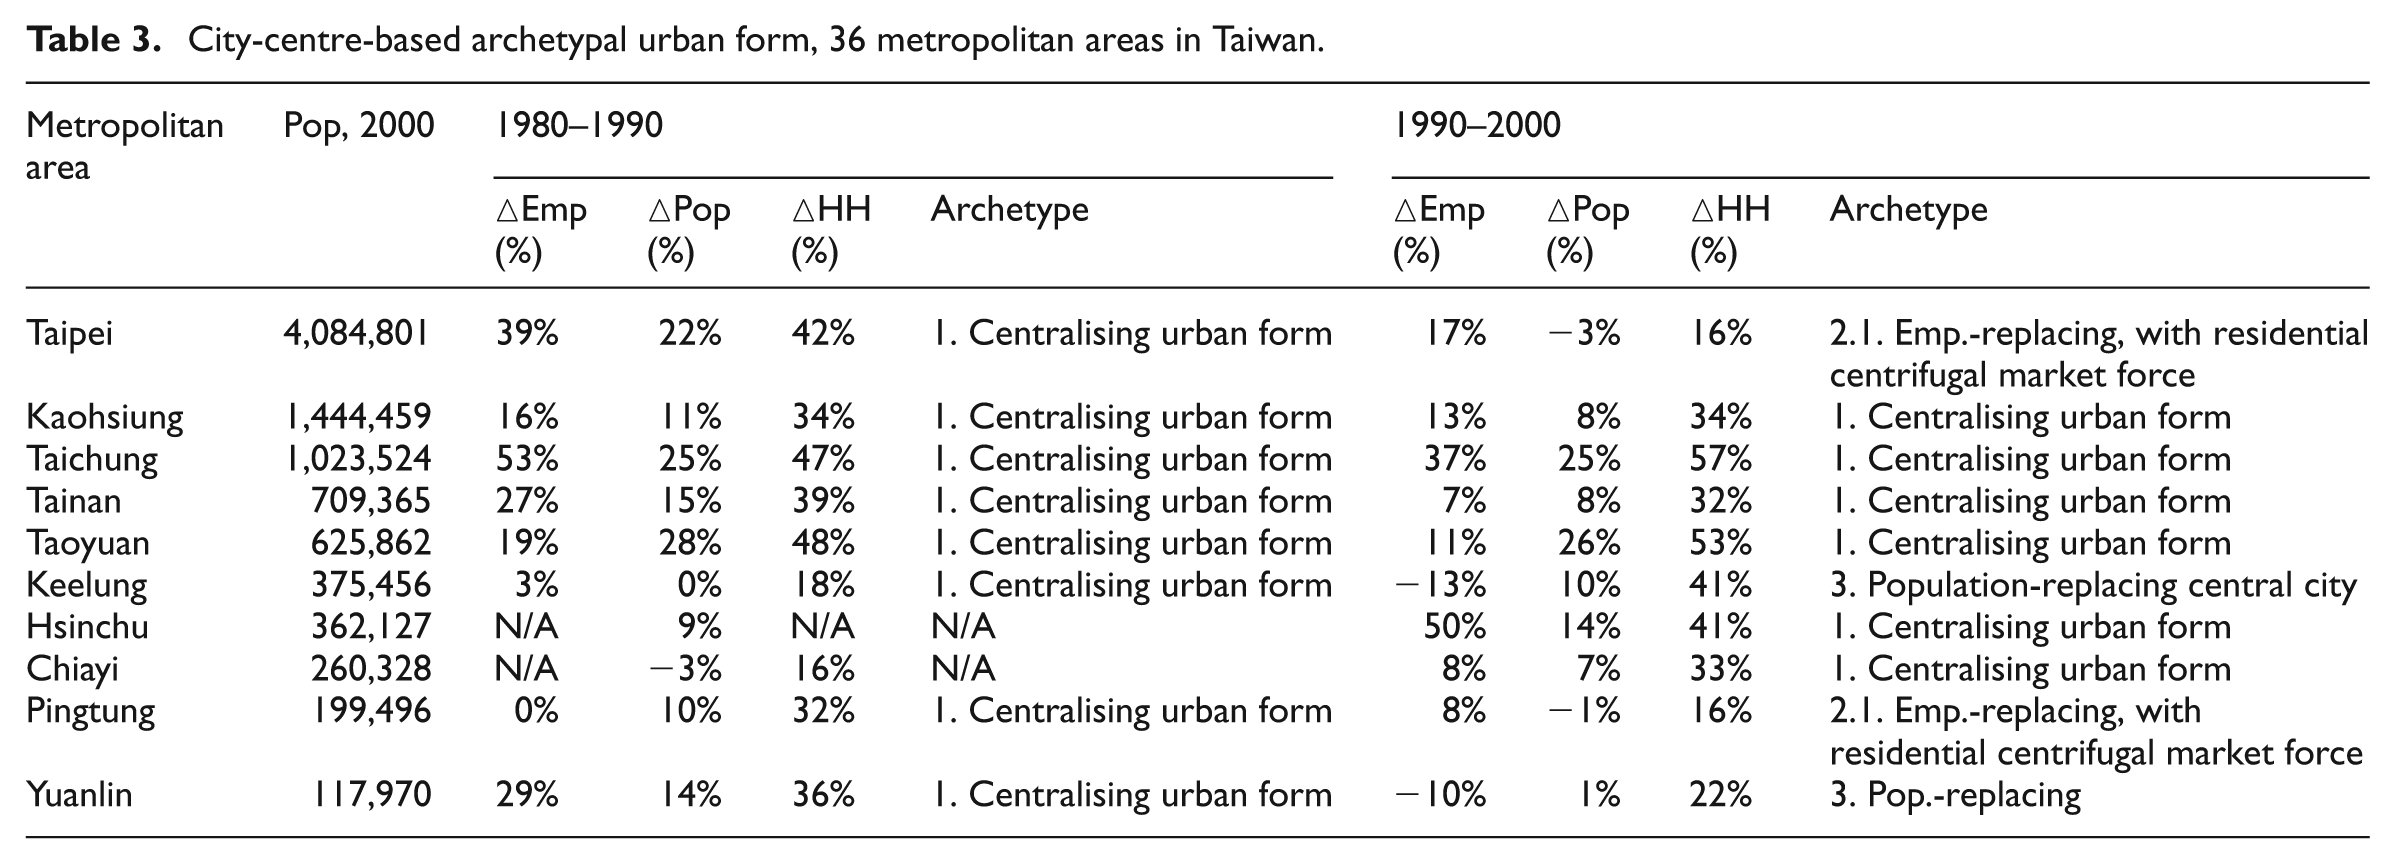
In addition, eight of the ten largest metropolitan areas were in a phase of centralisation (i.e. type 1) during the 1980–1990 period (Table 3). Then, in the next decade, Taipei and Pingtung transformed into employment replacing with potential housing needs in city centre(s), but still with centralising market force. Overall, 39% and 33% of the decentralisation traditionally classified as population decentralisation had a population-centralising market force in the 1980s and 1990s, respectively. In addition, 28% of traditionally labelled population decentralisation areas was actually employment replacing.
City-centre-based archetypal urban form, 36 metropolitan areas in Taiwan.
Descriptive statistics for the urban sprawl panel data model
The SI indexes of the 36 metropolitan areas in Taiwan show that, on average, they were slightly compact over the 1966–1980, 1980–1990 and 1990–1900 periods. The mean SI value was 44.4, slightly smaller than the 50 of the evenly distributed population urban form (Table 4). During these periods, the metropolitan areas (on average) grew a little more compact. The population (on average) increased by some 4.7% during the most recent ten-year period (except for the 15 years between 1966 and 2000). However, households grew much faster than the population by about 22%, attributed to shrinking household size by 0.89 persons per household every ten years or so. Housing demand was likely inflated by increasing incomes, which had more than doubled (on average) every ten years or so.
Descriptive statistics of variables for panel data regression model.
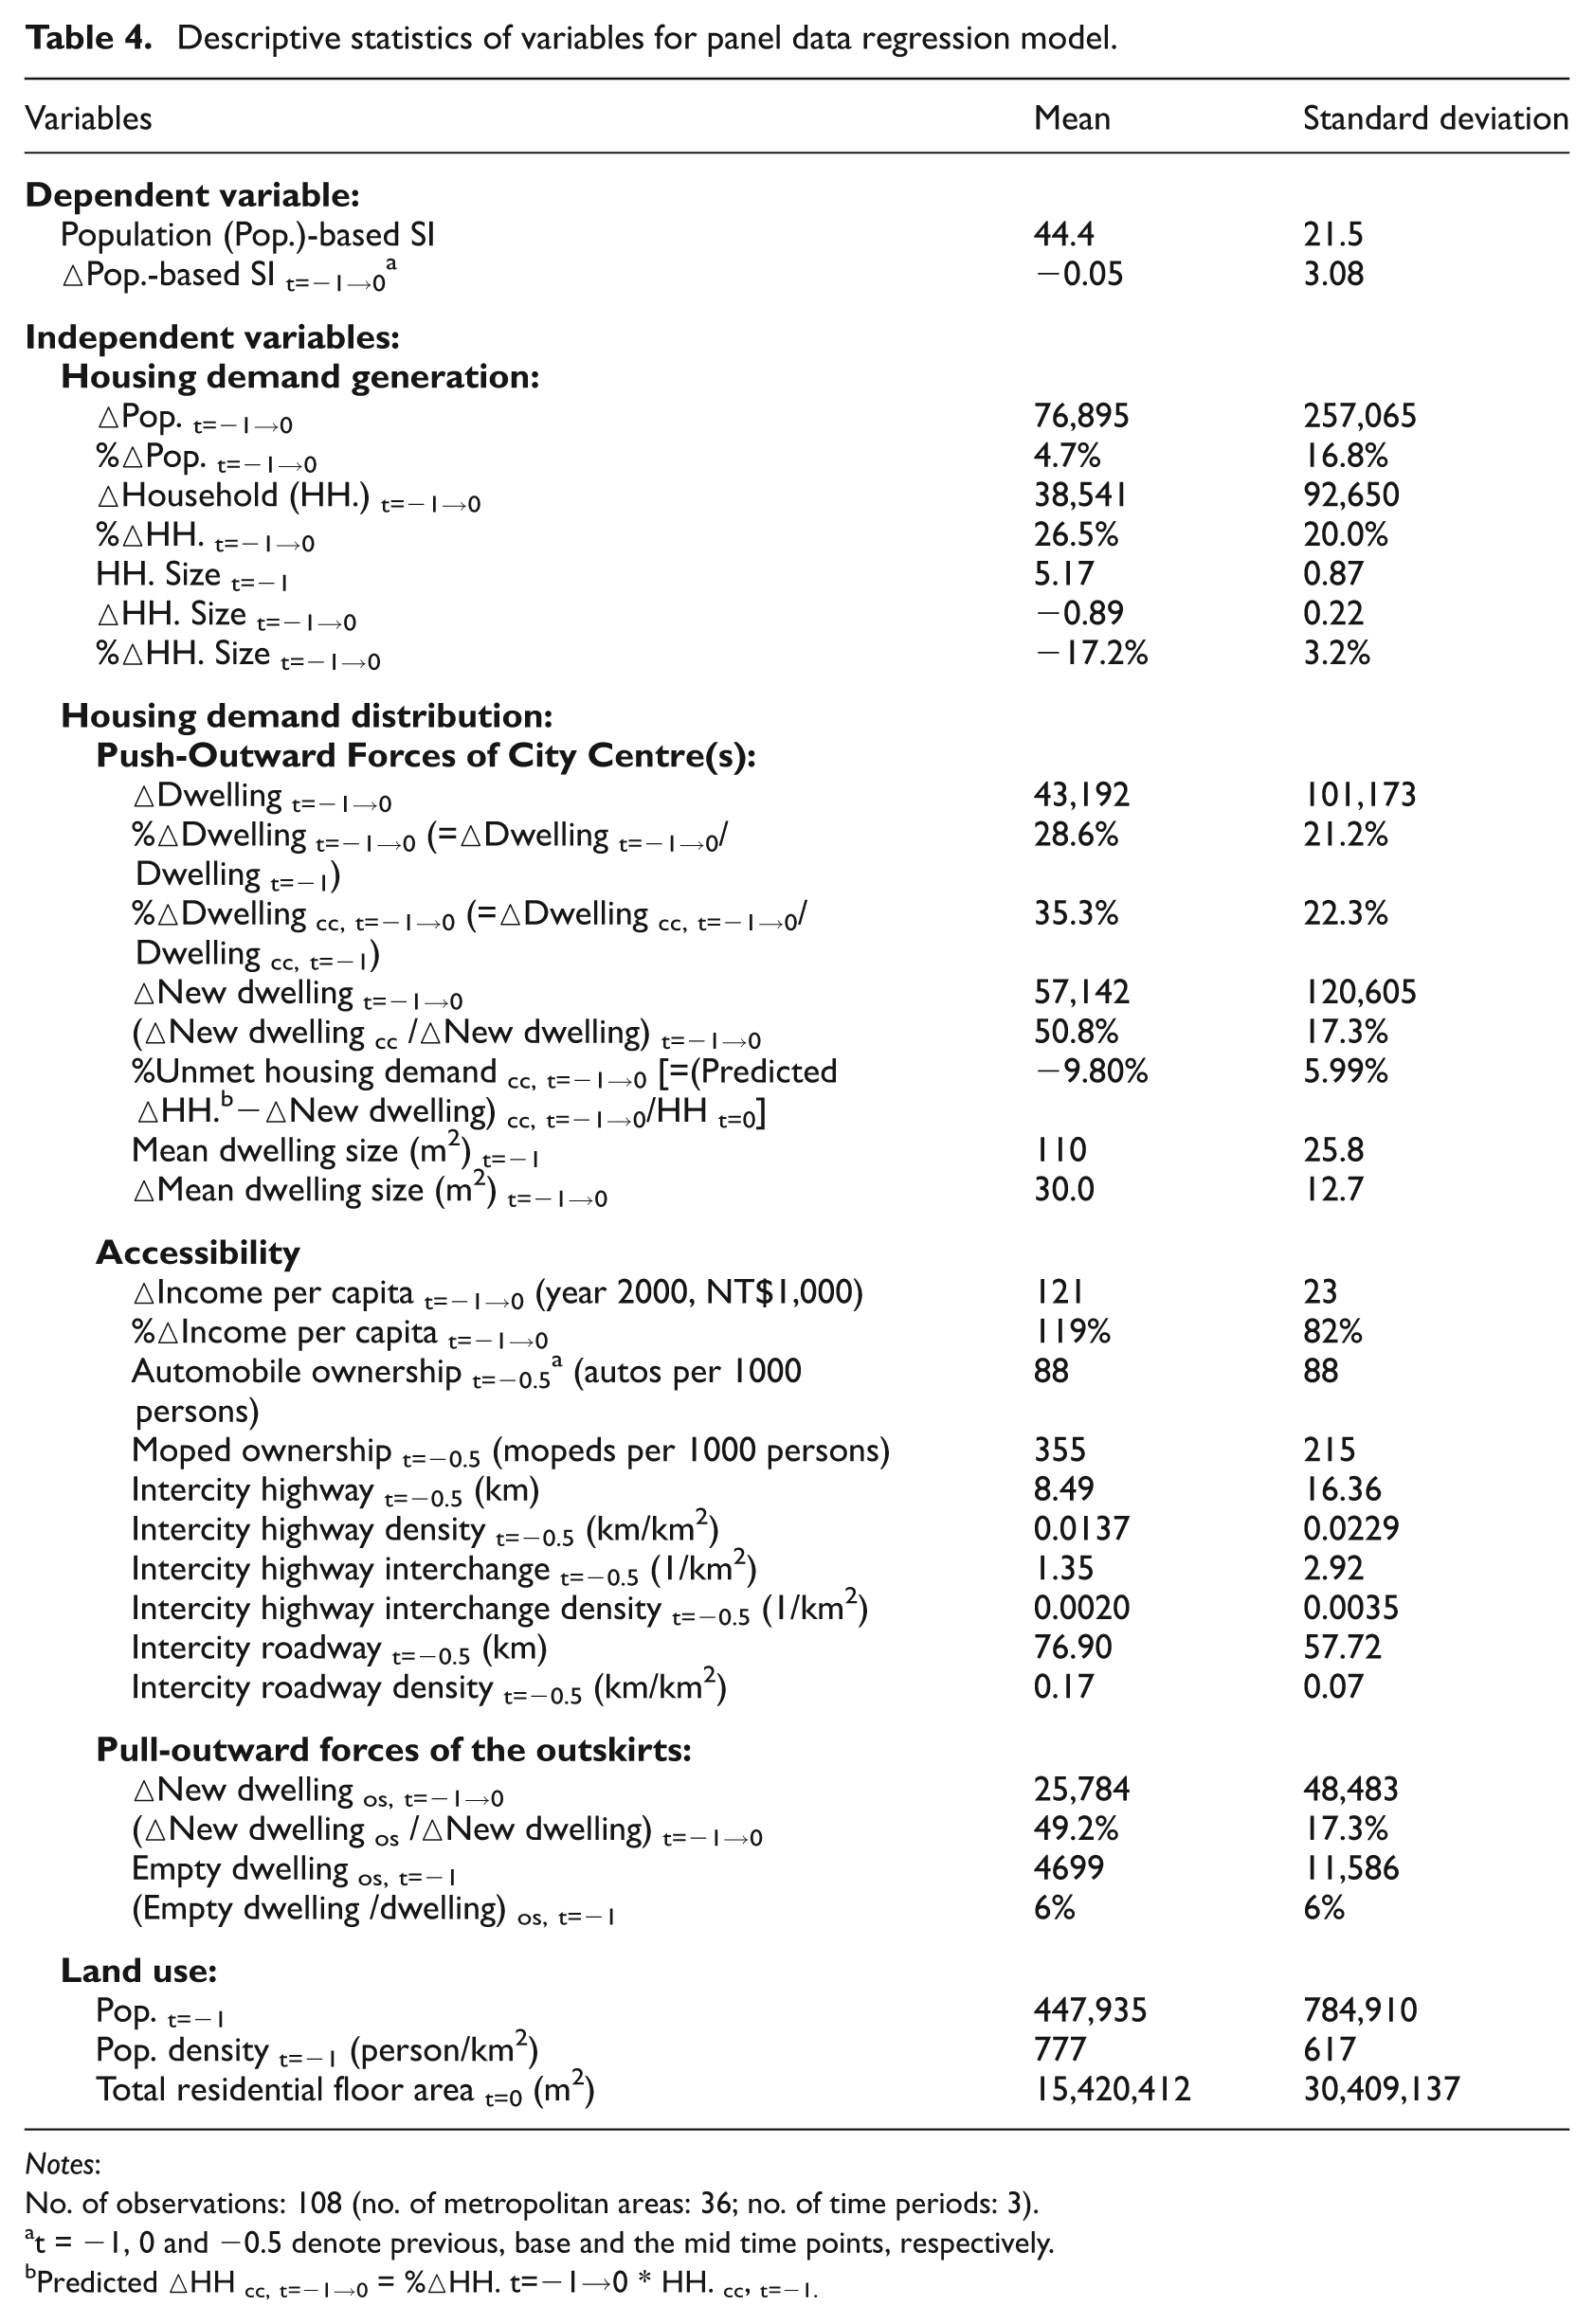
Notes:
No. of observations: 108 (no. of metropolitan areas: 36; no. of time periods: 3).
t = −1, 0 and −0.5 denote previous, base and the mid time points, respectively.
Predicted △HH cc, t=−1→0 = %△HH. t=−1→0 * HH. cc, t=−1.
The dwelling units (on average) increased by 28% every ten years or so for all the metropolitan areas, about two percentage points more than the increased number of households. In addition, the housing supply in city centre(s) grew at a faster pace (35.3%) than whole metropolitan areas (28.6%), implying that housing supply was distributed in a more compact form. Assuming the number of households grew at the same rate across metropolitan areas, housing demand in city centre(s) was oversupplied by some ten percentage points without considering housing type preference and consumer purchasing power to constitute a quantity-based counter push-outwards force, i.e. pulling-inwards force. On the outskirts, other than the attraction of newly built housing, though at a slower rate than in city centre(s), 6% of unoccupied housing may also have pulled households outwards.
In addition to push and pull forces, decentralisation may be stimulated and/or reinforced by accessibility capacity. During each of the three time periods, personal income almost doubled (Table 4). The ownership of automobiles and mopeds (a uniquely popular transportation mode in Taiwan) were 88 and 355 per 1000 persons, respectively. In addition, metropolitan areas with different levels of transportation infrastructure may trigger different levels of urban sprawl. The mean density of intercity highways and city roadways were one interchange for each metropolitan area and 77 km/km2. The decentralised population may be distributed in a denser or sparser form, depending on the density policy of land-use plans and market needs as a whole. A proxy for both as a whole can be population density for the previous time point, which was 777 persons/km2. The degree of compactness or sprawl is also affected by increasing housing size owing to improved household affluence, which increased by 30 m2 every ten years or so.
Results of the urban sprawl model
A fixed-effects model was chosen over the random-effects model for the panel data regression analysis, since the p-value of the Hausman test was significant (Hausman, 1978). This model was conducted with the original data standardised to obtain standardised coefficients. The explanatory power of this model is 44% (Table 5). The three most influential variables were land-use-related variables. The most significant variable that caused sprawling/compact growth form was population density, which suggests that if a metropolitan area has a more compact form at the beginning of a period, it has the tendency to become more compact; and vice versa, implicating more acceptance for high-density living. Another influential variable is the number of newly built dwelling units. A negative coefficient indicated that the more new dwellings built the more compact the metropolitan area grew. This could be because the new residential buildings generally had a higher FAR and were located in originally high-density areas because of building renewal projects, urban renewal or even infill development. In addition, the larger the total residential floor area of a metropolitan area, the more sprawling a metropolitan area grew.
Results of panel data regression model, fixed-effects.

The next tier of significant variables was associated with accessibility and push-outward forces. In compliance with past research, the more developed the intercity highway system, the more sprawling the metropolitan area grew. In addition, increased personal incomes also boosted urban sprawl because of more demand for housing space and higher capacity to move to the outskirts. The unmet housing demand in a city centre also caused a sprawling pattern, but on the borderline significant level.
Hypotheses test
The first hypothesis that unmet housing demand in city centres can cause urban sprawl was slightly supported by our research findings since the impact was only marginally statistically significant. Second, the hypothesis that accessibility initiates sprawling development was supported, as increased income and a high supply of highways to the metropolitan area catalysed sprawling urban growth. The hypothesis that the higher density the policy, the more compact the metropolitan area may grow is indirectly supported. This is because even though density policy per se is not incorporated in this study since its data were only partially available, our empirical findings show that metropolitan areas with denser development levels at the beginning of a period tend to develop in a more compact way.
Conclusions and policy implications to diminish sprawl
As metropolitan areas grow, high-density policy seems to play an essential role towards achieving a sustainable urban form. The common high-density urban development in Taiwan may be the result of restraints of land supply, land-use planning and market need/acceptance. The relationship whereby the higher the density, the more compact the metropolitan area grows based on Taiwan’s experience between 1966 and 2000 suggest that metropolitan areas with higher-density land use receive more acceptance over time.
Second, location-wise, it is recommended that high-density policy be prioritised within an urban growth boundary on a large scale, while in city centres and transit station areas (i.e. transit-oriented development/TOD) to cluster development in the form of monocentric or polycentric urban form (Garcia-López, 2010) on a small scale. In terms of relaxing density caps around transit station areas, recent finance policy planned by the central government in Taiwan may switch local government attitudes from resistance, resulting from planning reasons such as degraded liveability and congestion among others, to acceptance. This policy plans to impose a minimum cost coverage rate for new mass transit investment with a financial influx from an increased FAR within a TOD area and property tax revenues, i.e. tax increment financing (TIF). Consequently, the density around the TOD areas of the new transit stations are likely to be pushed by local governments.
Third, as the metropolitan area grows, it is essential to serve housing needs that lead to compact urban form at the least and to direct housing needs to compactness-ideal locations. In the case that the housing demand for city centre living is identified through analysis of household growth trends, infill development and streamlining of urban renewal in the city centre or near transit stations should be encouraged. Sustainability impact is easily realised when compared with cases where there is little housing need. Therefore, it is important to apply tools, such as incorporation of household data, to identify housing needs to develop market-oriented land-use policy.
Thus, high-density policy is particularly important for metropolitan areas that are predicted to enter a phase of decreasing population in the near future, such as Taiwan, where a fertility rate of 0.9 children per woman was recorded in 2010 (Ministry of the Interior, 2011), which is far lower than the 2.1 replacement rate. This is because infrastructure investment needs to take into account the foreseeable lower-density development in the near future for cost-efficiency purposes. Nevertheless, this research again supports that highway systems are not to be encouraged as priori knowledge.
Footnotes
Funding
This work was supported by the Ministry of Science and Technology of Taiwan Government. NSC 95-2415-H-004 -023 -SSS and NSC 102-2410-H-004 -199