
Abstract
This article addresses the problem of estimating the proportion π S of the population belonging to a sensitive group using optional randomized response technique in stratified sampling based on Mangat model that has proportional and Neyman allocation and larger gain in efficiency. Numerically, it is found that the suggested model is more efficient than Kim and Warde stratified randomized response model and Mangat model.
Keywords
Introduction
One of the important things for obtaining data pertaining to human population is the social survey. To measure opinions, attitudes, and behaviors that cover a wide band of interests, the social survey has been established as being tremendously practical. The surveys are conducted due to many reasons, nonavailability of certain facts/information in the archives being the most understandable and apparent. For instance, if one is interested in knowing crime rate, information about unseen crimes or unreported victimization experience is not available in formal records on crimes. Sometimes, the facts about the individuals (in a population) are inaccessible to the investigators for legal reasons. Questionnaires, in particular social surveys, generally consist of many items. Some of the items may be about sensitive/high-risk behavior, due to the social stigma carried by them. One problem with research on high-risk behavior is that respondents may consciously or unconsciously provide incorrect information. In psychological surveys, a social desirability bias has been observed as a major cause of distortion in standardized personality measures. Survey researchers have similar concerns about the truth of survey results/findings about topics such as drunk driving, use of marijuana, tax evasion, illicit drug use, induced abortion, shop lifting, child abuse, family disturbances, cheating in examinations, HIV/AIDS, and sexual behavior. Thus, to obtain trustworthy data on such confidential matters, especially the sensitive ones, instead of open surveys alternative procedures are required. Such an alternative procedure known as randomized response technique (RRT) was first introduced by Warner (1965).
Subsequently, several other workers have proposed different Randomized Response (RR) strategies, for instance, see the review-oriented references like Greenberg et al. (1969), Fox and Tracy (1986), Mangat (1994) and the papers by Tracy and Mangat (1995), Kim and Elam (2005), Singh and Tarray (2012, 2013, 2014a, 2014b, 2015a, 2015b, 2015c), and Tarray and Singh (2015).
Hong, Yum, and Lee (1994) suggested a stratified RR technique under the proportional sampling assumption. Kim and Warde (2004) and Kim and Elam (2005) have presented a stratified RR technique using a Neyman allocation which is more efficient than a stratified RR technique using a proportional allocation. Kim and Elam (2007) have mentioned that the extension of the RRT to stratified random sampling may be useful if the investigator is interested in estimating the proportion of HIV/AIDS positively affected persons at different levels such as by rural areas or urban areas, age-groups, or income groups.
In the stratified random sampling, the population to be used to conduct the survey is partitioned into strata. A sample is then selected by simple random sampling with replacement (SRSWR) from each stratum is known. To get the full benefit from stratification, it is assumed that the number of units in each stratum is known. In the stratified Warner’s randomized response model, an individual respondent in the sample from stratum “‘i” is instructed to use the randomization device Ri
which consists of a sensitive question (S) card with probability Pi
and its negative question

where Zi is the proportion of “Yes” answers in a stratum i and π
Si
is the proportion of respondents with the sensitive trait in a stratum i. Let ni
denote the number of units in the sample from stratum i and n denote the total number of units in sample from all stratum so that
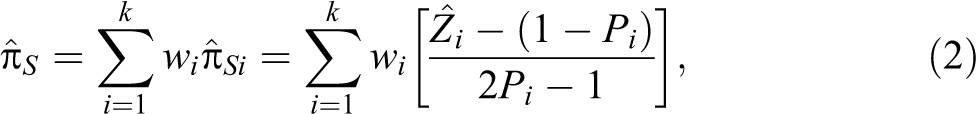
where wi
= (Ni/N) for (i = 1, 2, …, k) so that
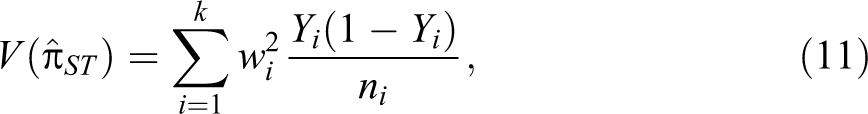
The variance of
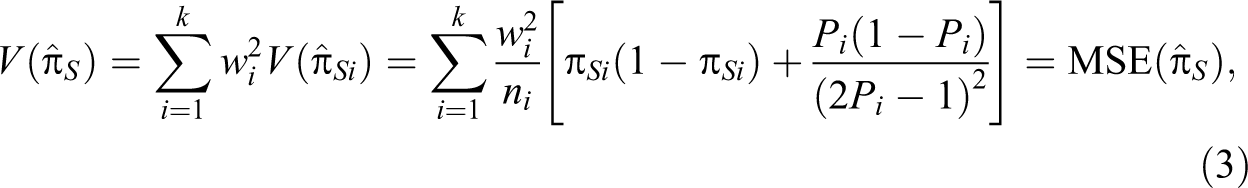
where mean square error (MSE) (.) stands for the MSE of (.).
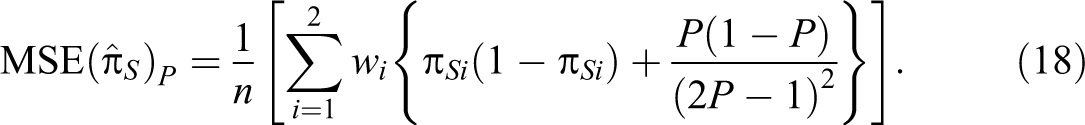
Under proportional allocation (i.e., ni
= n (Ni
/N)), the variance/MSE of
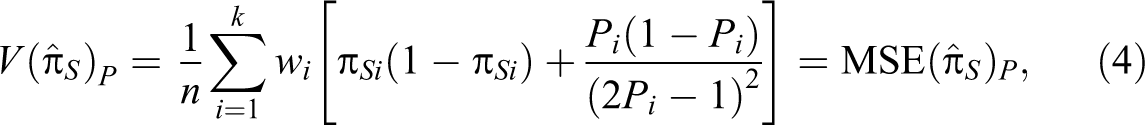
which is due to Hong et al. (1994).
If the prior information on π Si is available from the past experience, then under Neyman allocation:
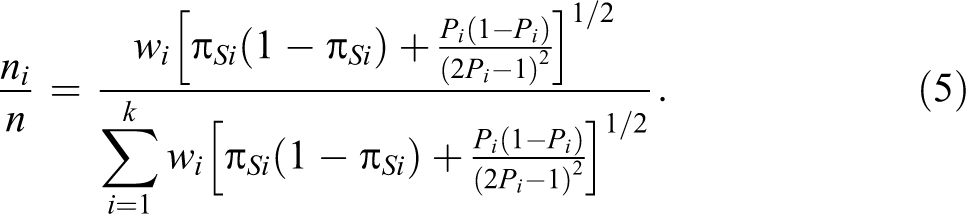
Kim and Warde (2004) obtained the minimal variance/MSE of the estimator

Proposed Model
In this proposed model, the population is partitioned into strata, and a sample is selected by SRSWR from each stratum. To get the full benefit from stratification, it is assumed that the number of units in each stratum is known. In this procedure, the randomized response device Ri and method for sampling the respondents in each stratum “‘i” remains same as in Kim and Warde (2004) model. However, it differs in the sense that the respondent is free to give answer in terms of “Yes” and “No” either by using RR device or without using it. It is not revealing to the interviewer which mode has been followed for giving answer.
Let ni
denote the number of units in the sample from stratum i and n denote the total number of units in samples from all stratum so that

where Zi is given by equation (1).
For this procedure, we consider the following estimator of π Si :
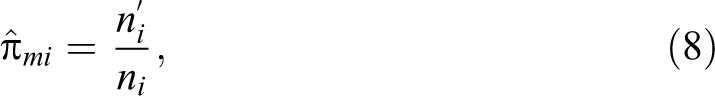
where
Since the selection in different strata is made independently, the estimators for individual strata can be added together to obtain an estimator for the whole population. Thus, the estimator
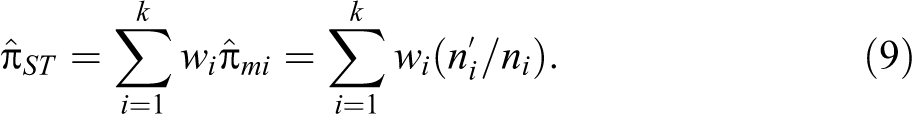
Since
where Yi is given by equation (7).
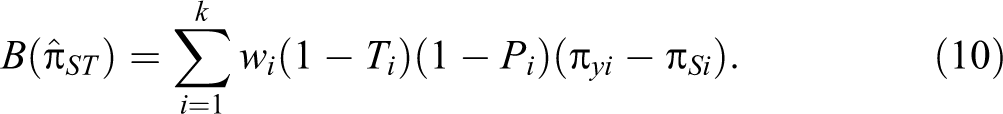
As the proposed estimator

Thus, we state the following theorem.
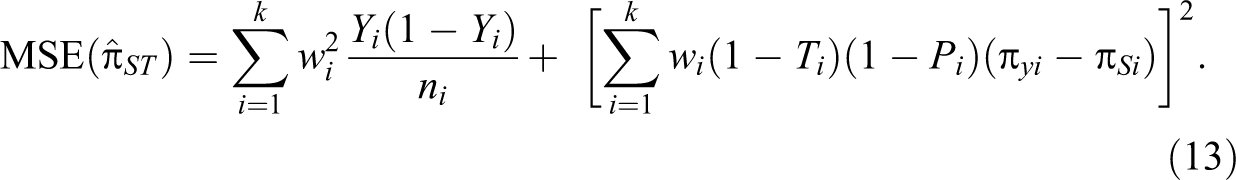
Now, we will obtain the MSE
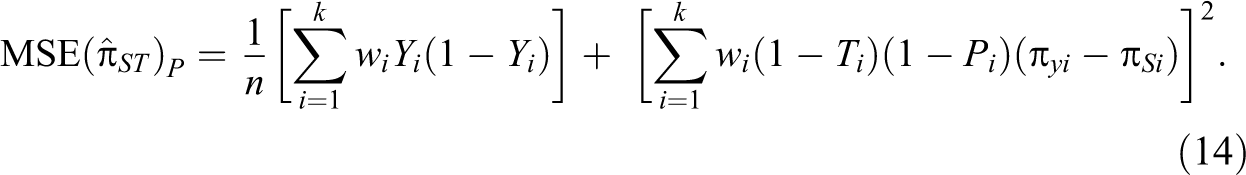
i. proportional allocation
The MSE
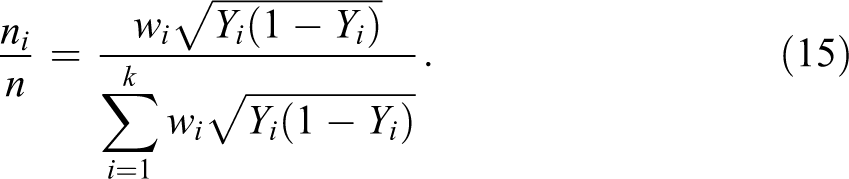
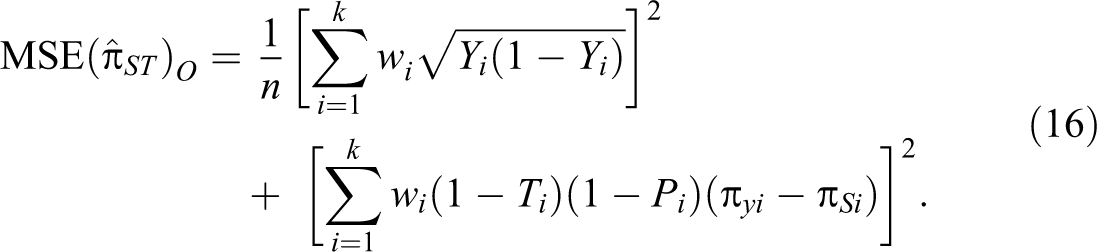
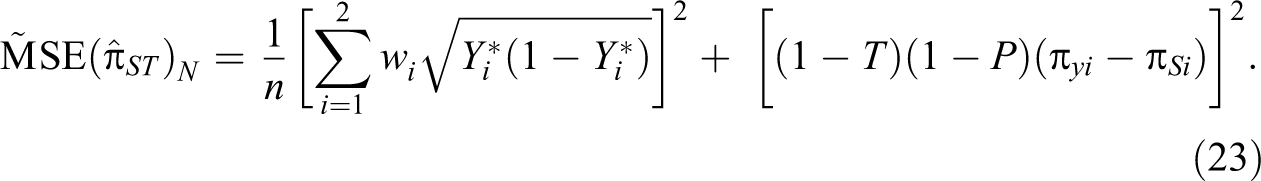
ii. Neyman allocation
Information on π
Si
and Ti are usually unavailable. But if prior information on π
Si
and Ti are available from past experience, then it helps to derive the following Neyman allocation formula.
Relative Efficiency
To compare the MSE of the proposed estimator

where
Proportional Allocation
For two strata (i.e., k = 2) in the population and P = P1
= P2
, MSE(
Under the assumptions k = 2, P = P1
= P2
and T = T1
= T2
,

where
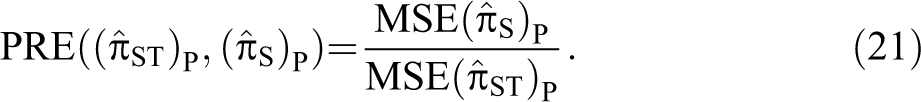
From equations (17), (18), and (19), the percent relative efficiency (PRE) of the proposed estimator

and
We have computed the percent relative efficiencies
Percentage Relative Efficiency of the Proposed Estimator

Percentage Relative Efficiency of the Proposed Estimator

It is observed from Tables 1 and 2 that:
The values of percent relative efficiencies
We further note from the findings of Tables 1 and 2 that there is a large gain in efficiency by using the suggested estimator
Neyman Allocation
Under the assumption k = 2 (i.e., two strata in the population), P = P1
= P2
, T = T1
= T2
, MSE(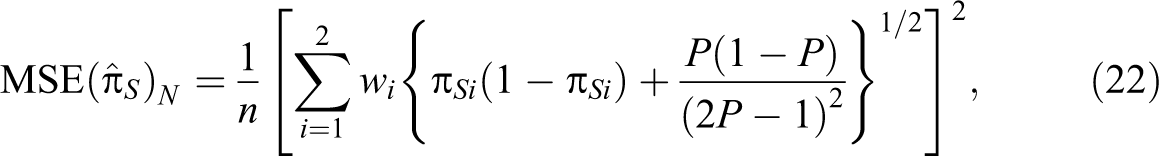
From equations (17), (22), and (23), PRE of the proposed estimator
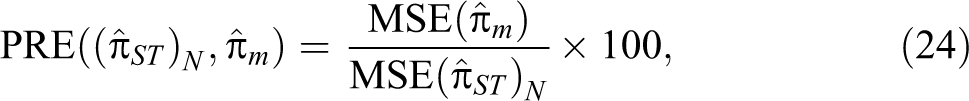
and

We have computed the percent relative efficiencies
Percentage Relative Efficiency of the Proposed Estimator
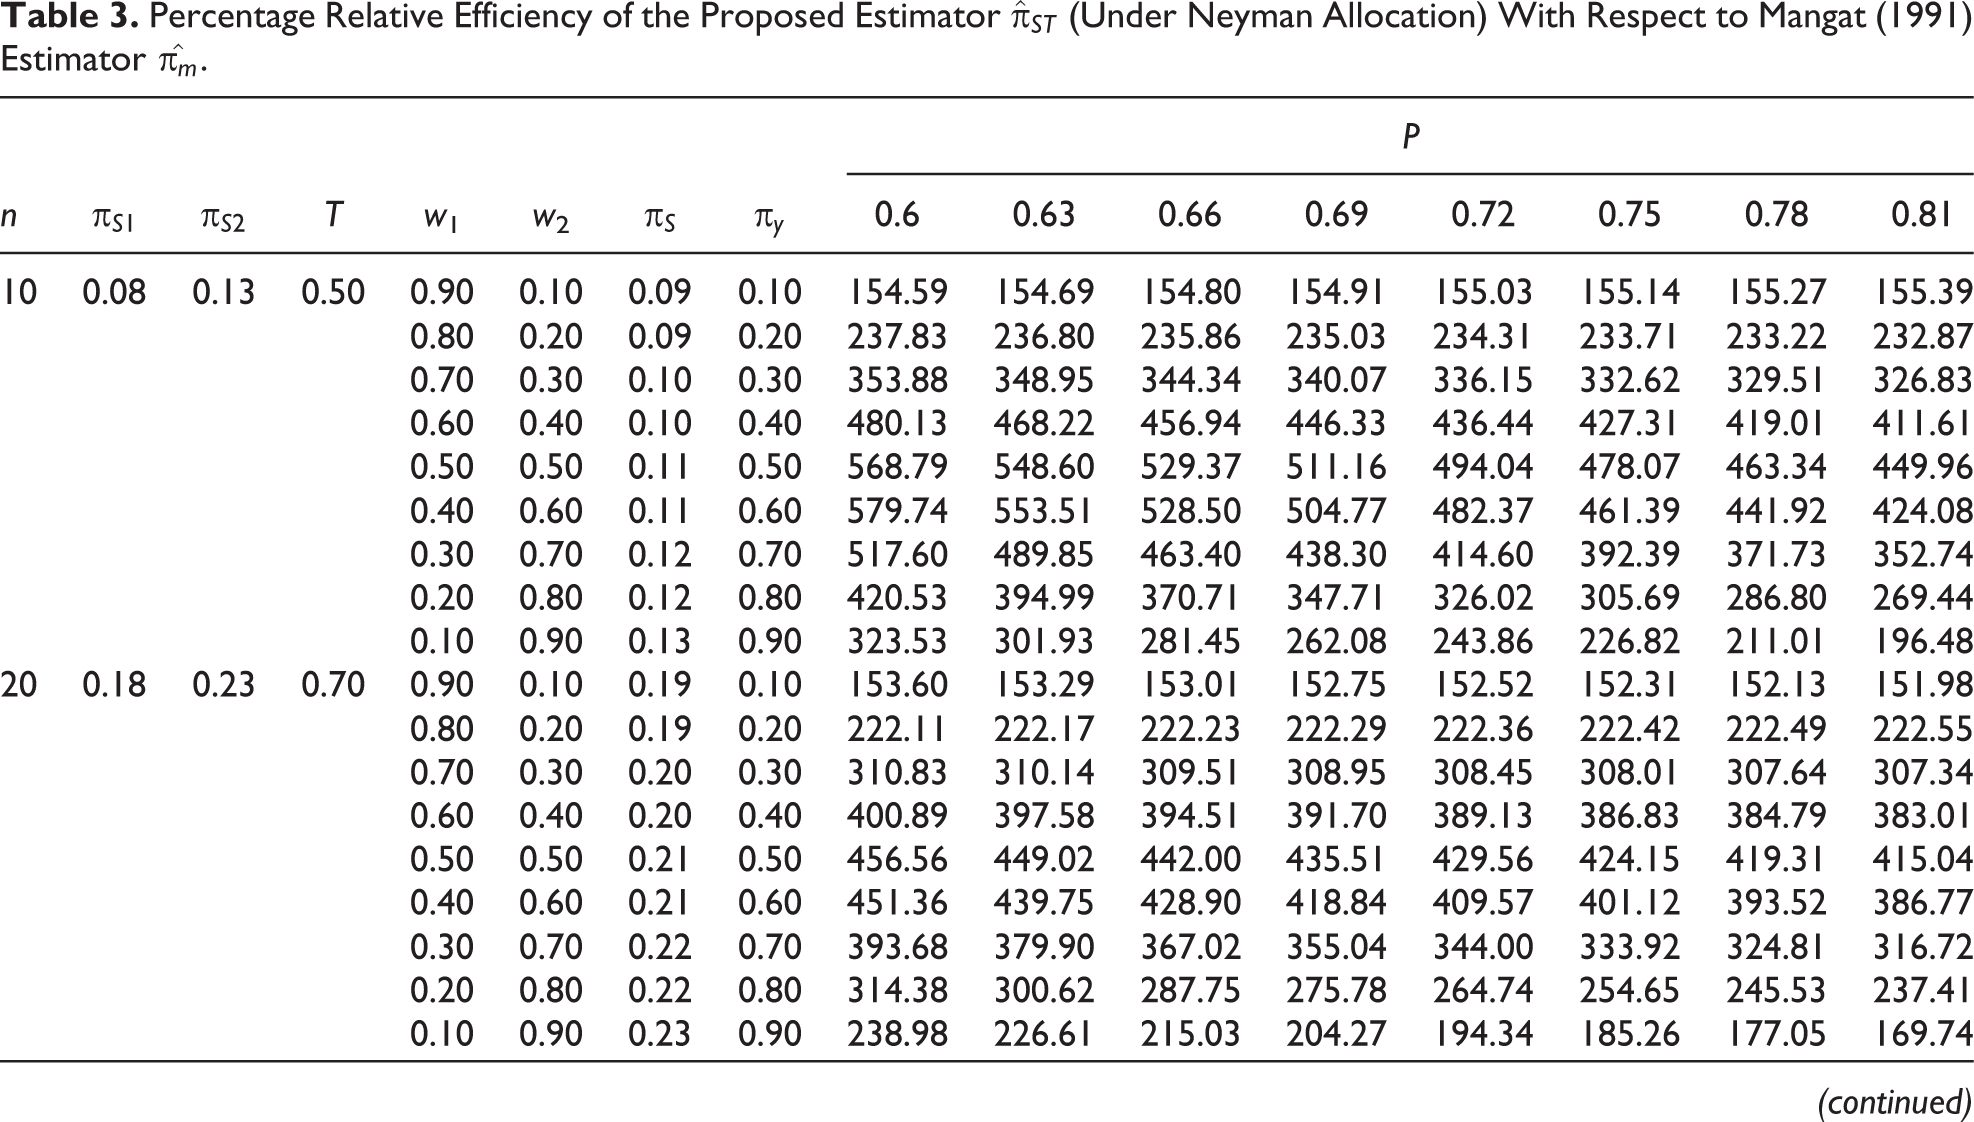
Percentage Relative Efficiency of the Proposed Estimator

The values of
To have the tangible idea about the performance of the proposed estimator
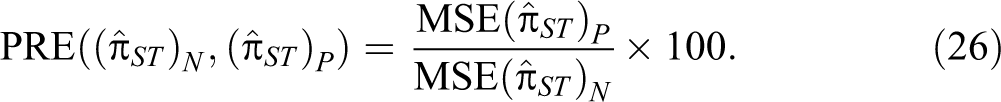
For different values of n, P, w1
, w2
,
The findings are shown in Table 5.
Percentage Relative Efficiency of the Proposed Estimator

We note from Table 5 that the values of the relative efficiencies
Discussion
This article addresses the problem of estimating the proportion π S of the population belonging to a sensitive group using optional RRT in stratified sampling. A stratified optional randomized response model using Mangat (1991) model has been proposed. It has been shown that the proposed randomized response model is more efficient than the Hong et al.’s (1994), Mangat (1991), and Kim and Warde’s (2004) stratified randomized response models.
Footnotes
Acknowledgments
The authors are grateful to the editor in chief and to the learned referees for their valuable suggestions regarding improvement of this article.
Declaration of Conflicting Interests
The author(s) declared no potential conflicts of interest with respect to the research, authorship, and/or publication of this article.
Funding
The author(s) received no financial support for the research, authorship, and/or publication of this article.