
Abstract
Researchers interested in studying the frequency of events or behaviors among a population must rely on count data provided by sampled individuals. Often, this involves a decision between live event counting, such as a behavioral diary, and recalled aggregate counts. Diaries are generally more accurate, but their greater cost and respondent burden generally yield less data. The choice of survey mode, therefore, involves a potential trade-off between bias and variance of estimators. We use a case study comparing inferences about payment instrument use based on different survey designs to illustrate this dilemma. We then use a simulation study to show how and under what conditions a hybrid survey design can improve efficiency of estimation, in terms of mean-squared error. Overall, our work suggests that such a hybrid design can have considerable benefits, as long as there is nontrivial overlap in the diary and recall samples.
Introduction
Much research in the social sciences involves the study of rates: How frequently people act in certain ways or experience certain events. Indeed, individual count data are found in data sets relevant to a variety of fields including economic consumption (BHPS; CES; SCA; PSID), health (NHIS), media (BMCS), and crime (BRFSS), among others (see the reference list for the full names of these data sets). In particular, the example used in this work relates to the study of payment instrument use among consumers.
A researcher often has a choice of how to collect such count data from sampled individuals. In this work, we juxtapose two modes of data collection: “live” data collection, in which events are recorded as they occur, and recall surveys, in which respondents provide a retrospective event count for a prespecified period of time. Live data collection can take many different forms, but perhaps the most common is the behavioral diary, in which respondents track daily events as they happen. From this point on, we focus primarily on diary data, though the ideas in this work apply to other forms of live data collection.
The appeal of the recall survey directly relates to its logistical advantages. As opposed to a recall query, diaries are generally more difficult to implement and demand a greater respondent burden, leading to a higher cost per respondent. Beyond that, diary fatigue, in which respondents’ motivation wanes as the length of the observation period increases, suggests limiting the length of diary measurement periods to maintain suitable data quality (Ahmed, Brzozowski, and Crossley 2010; Jonker and Kosse 2009; Schmidt 2011; Silberstein and Scott 1991). As an example, most consumer payment diaries organized by Central Banks last from a day (the Netherlands) to three days (United States and Canada) to a week (Germany, France, Austria, and Australia). On the other hand, months (used in the CES) and years (used in the PSID and the SCA) have all been used in recall surveys. The difference in cost can be such that, within a fixed budget, a recall survey collects data from more individuals and for longer observation periods than a diary.
Unfortunately, recalled count data are notoriously subject to error. Both omission and telescoping, wrongly counting events that occurred outside the period in question, have been documented in past studies (Bound, Brown, and Mathiowetz 2001; Groves 1989; Neter and Waksberg 1964). In fact, research suggests that the dependability of recall is governed by a complex cognitive process (see Rockwood [2015] for an overview). In general, accuracy of recall is linked to saliency, a somewhat nebulous concept relating to the frequency, regularity, and impact of the event in question. Social desirability has also been shown to lead to overreporting of seemingly commendable activities, such as exercising, and underreporting of negatively perceived behavior, such as drug use (Shephard 2003; Tourangeau and Yan 2007).
Of course, diary data are not immune to inaccuracies. Much like longitudinal studies, diaries are subject to attrition and the aforementioned diary fatigue, which can introduce nonignorable response bias when the loss of data is linked to the behavior of interest (Groves et al. 2001; Thomas, Harel, and Little 2016). Some multiday diaries, such as the CES, observe significant data entry at the end of the observation period, thus nudging it in the direction of recall and jeopardizing quality (Crossley and Winter 2014; Silberstein and Scott 1991). Finally, it has been hypothesized that the act of recording one’s behavior itself may result in unusual behavior on the part of the individual, although there has been no conclusive evidence to verify this hypothesis (Kemsley and Nicholson 1960; McKenzie 1983).
The attributes of each survey mode have implications on the quality of inference, introducing potential trade-offs between bias and variance. In this article, we consider the possible benefits of a hybrid design that combines diary and recall data. To do so, we assume that a diary likely represents a higher standard of data than a recall survey, which we reduce to an assumption that diary counts are accurate and recalled counts are potentially inaccurate and systematically biased. This general notion is supported by research on topics as diverse as reporting food consumption (Brzozowski, Crossley, and Winter 2017), hospital visits (Clarke, Fiebig, and Gerdtham 2008), exercise (Nusser et al. 2012), household chores (Marini and Shelton 1993), and job-related accidents (Andersen and Mikkelsen 2008). Moreover, the quality of diary data is likely to generally improve with the increased implementation of new technology that makes mobile tracking and data entry easier and more reliable (Anderson, Burford, and Emmerton 2016; Chatzitheochari et al. 2018; Greaves et al. 2015; Siemieniako 2017). As a result, we believe the ideas in this work have the potential to benefit research in many fields.
The paper proceeds as follows. We begin by specifying the research problem and developing a general framework of analysis. A case study is introduced to highlight how inference based on different modes can lead to different results. Then, the methodology of assimilating two data modes is developed, and a simulation study is used to determine the extent of the potential gains and how they can be practically factored into survey design. Finally, we discuss the general findings and their implications for data collection.
Framework
Although the example in this work relates to research on the frequency of payment instrument use, the ideas are relevant to any study of how often individuals experience certain events. No matter the discipline, the unifying framework is a population of individuals, indexed by the subscript i, with associated rates,
Information about
Diary Versus Recall
One measure of the information collected in a data set of counts is the total length of time observed, generally a number of days. There are two dimensions to this; the number of respondents in the sample, N, and the number of days of observation for each individual
As a simple, illustrative example, consider the case of a homogeneous Poisson point process with daily rate
As expected, an increase in the sample size results in a lower mean-squared error, as does a lengthening of the recall period, though the latter does so with a nonzero lower bound. Determining N and
Evaluating Survey Design
A necessary component of this study is evaluating survey designs, which we do through the average quality of inference associated with data generated via the said survey design. More formally, let
A simple measure of how well the posterior distribution estimates any parameter

In the simulations found in this article, we consider a special case where

measures the benefit in efficiency of the new data in

quantifies the added value of the additional information in
Case Study: Frequency of Payment Instrument Use
Before turning to the simulation, we consider a case study using data from different survey designs to infer the frequency of payment instrument use of cash, credit cards, debit cards, and checks among likely adopters of each payment instrument. The restriction to likely adopters is made to avoid more complex models that must accommodate bimodal distributions due to reported zeros by nonadopters.
For each payment instrument, there are five data sets. One is extracted from the 2012 Diary of Consumer Payment Choice (DCPC), a three-day diary of all payment activity. The other four are recall-based data specific to each payment instrument for recall periods of a day, week, month, and a year, from the RAND Corporation survey, “Well Being 199,” which we dub the 2011–2012 Recall Survey. Both data sets were collected from members of RAND’s American Life Panel (ALP), the details of which can be found at www.RAND.org/ALP. Each data set is a reasonable representation of what a researcher studying such questions might have available, and there is no prior reason to think they should not be used to make inferences. Despite this, we find that estimates based on all five data constructs yield significantly different results.
As the case study is primarily an illustrative example of survey mode effects, the exposition is deliberately concise. Of particular note, the general model of payment behavior that informs all later analysis is introduced in the section titled “Model”. The remainder of the case study is organized as follows. A brief summary of the data source and the likelihoods used in diary-based and recall-based estimation are given in sections “Estimation Based on Diary Data” and “Estimation Based on Recall Data,” respectively. Finally, details of parameter estimation and a discussion of the results are provided in the section titled “Parameter Estimation”.
Model
The most basic unit of observation is the number of payments made by individual i on any given day t, which we model as

where

so that

We further enforce that
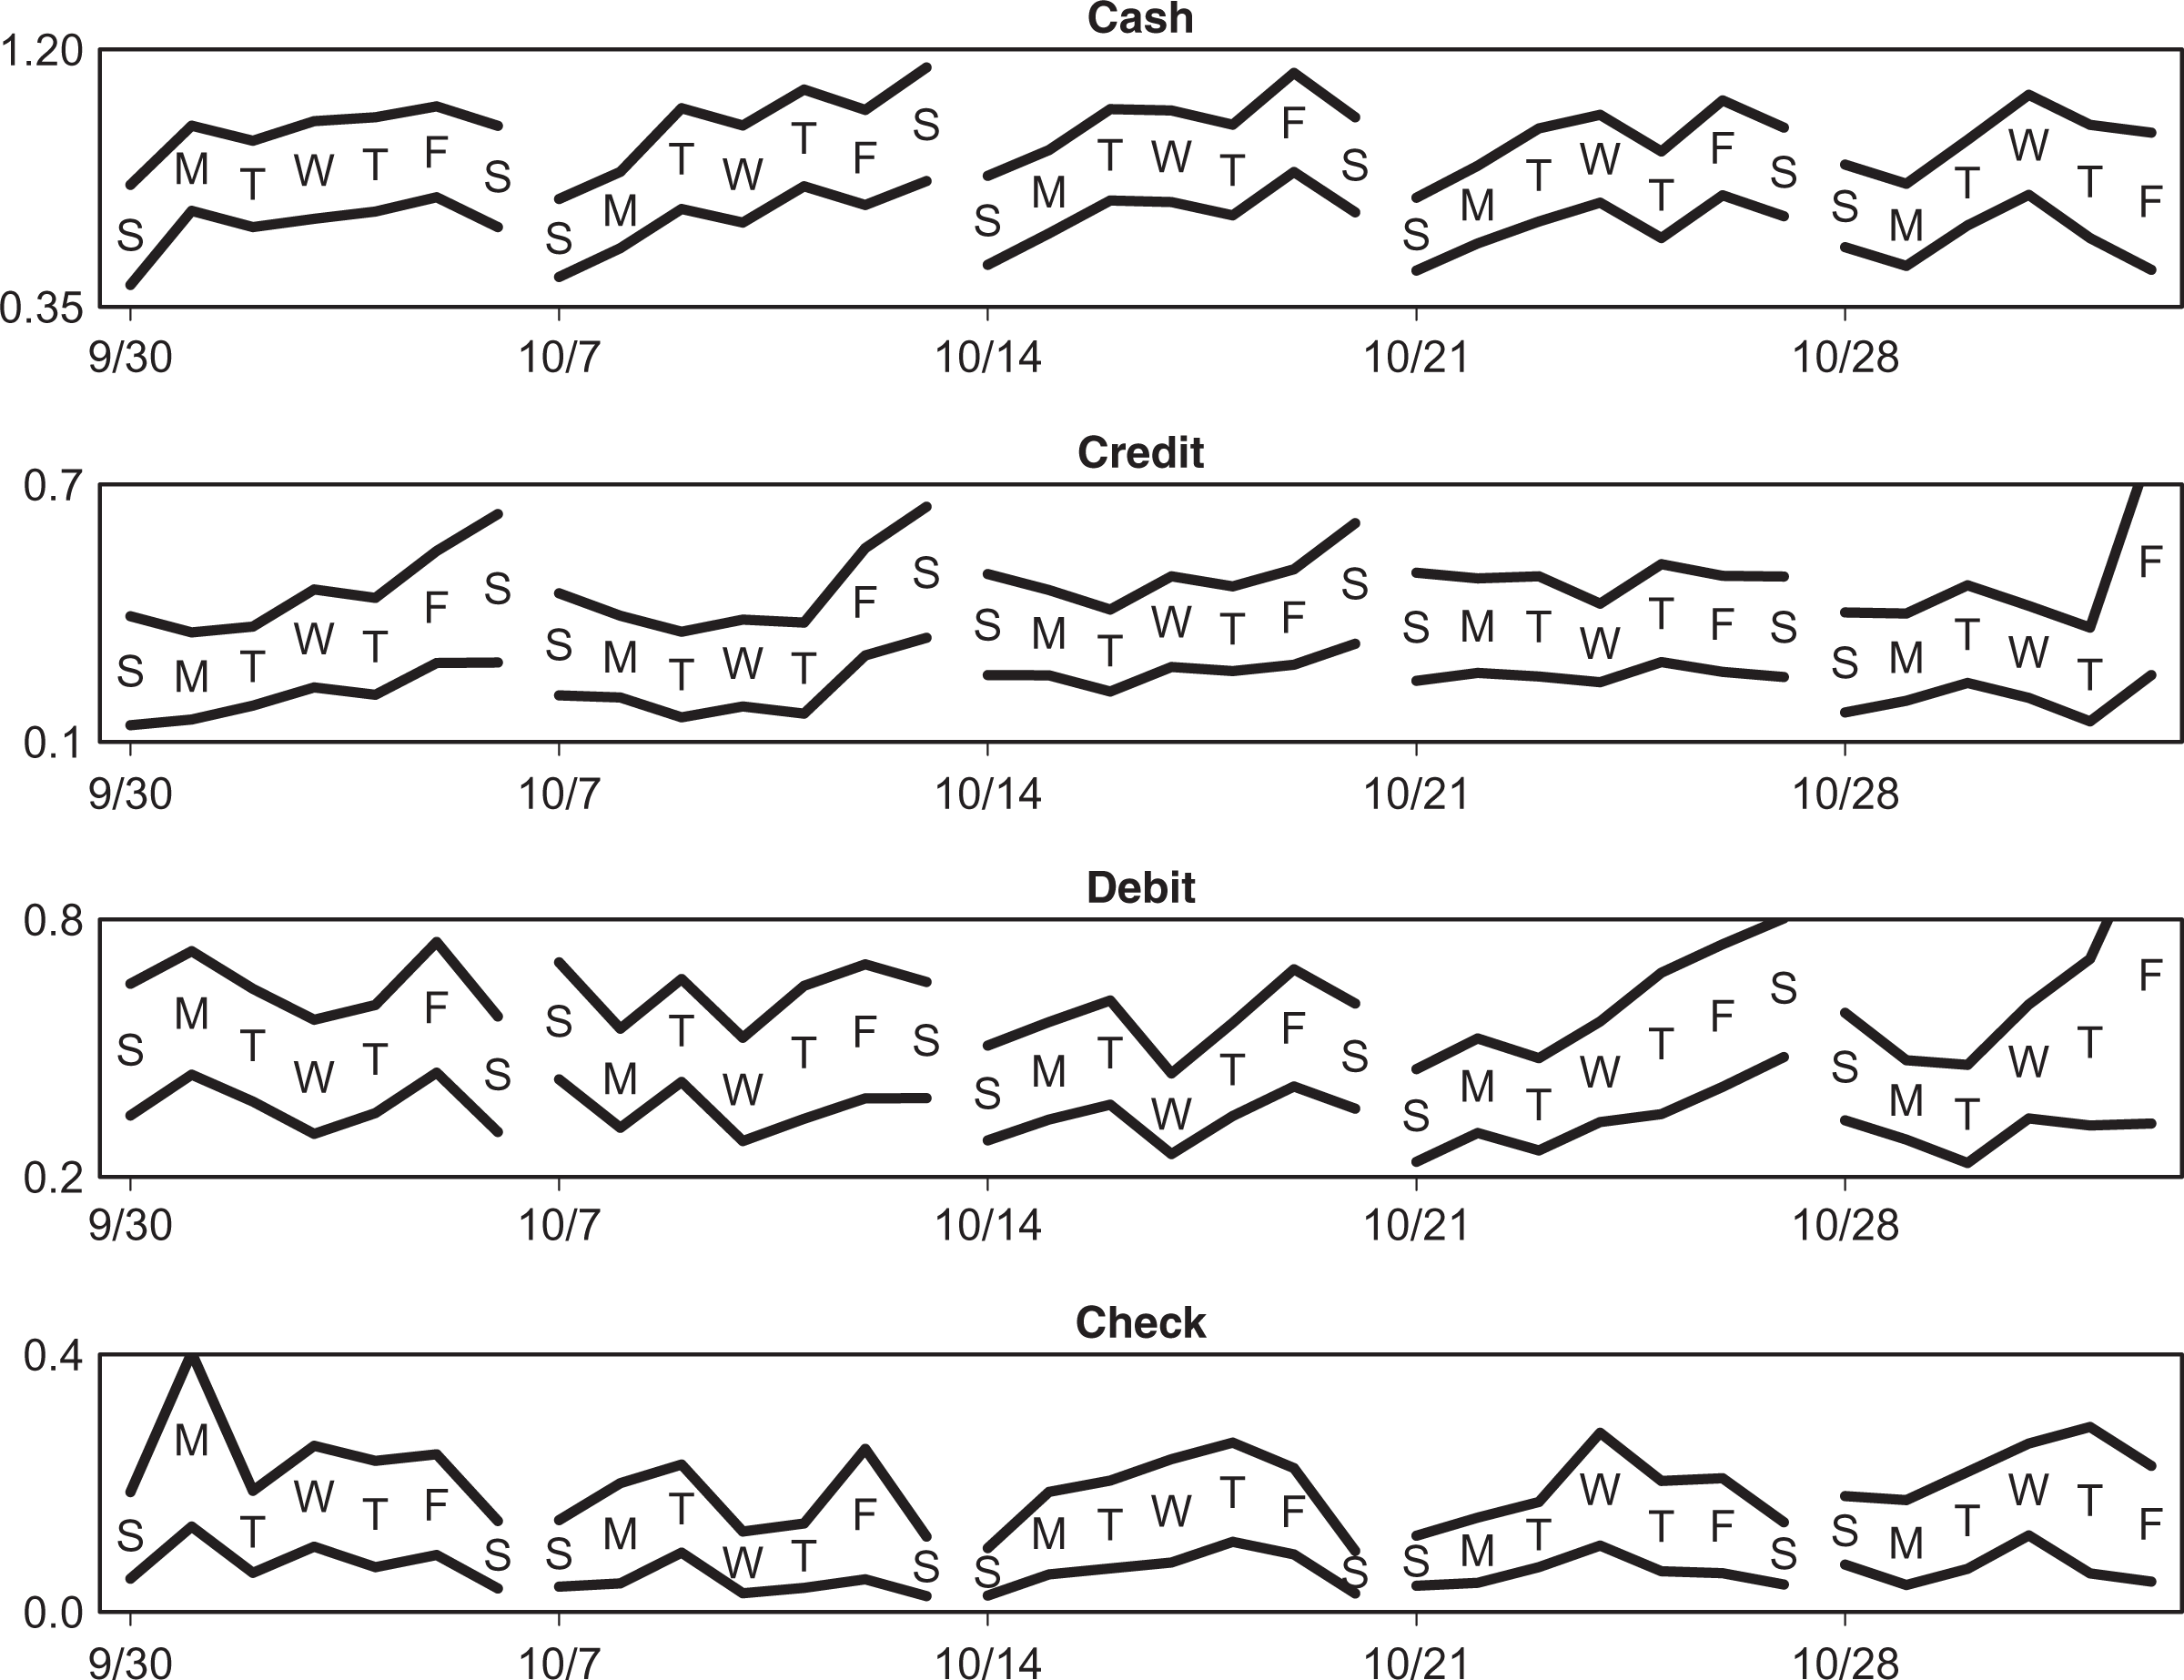
Daily averages and averages’ ±2 standard deviations in the 2012 Diary of Consumer Payment Choice.
In practice, temporal patterns are almost certain to be more complicated and heterogeneous. Nevertheless, the weekly cycle seems to represent a decent approximation to a complex reality for some period of time surrounding the dates of observation. Even this approximation may not apply to different time periods due to seasonal trends that have systematic impacts on individuals’ payment behavior.
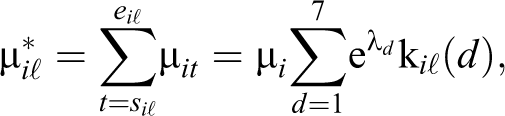
The weekly rates,

where
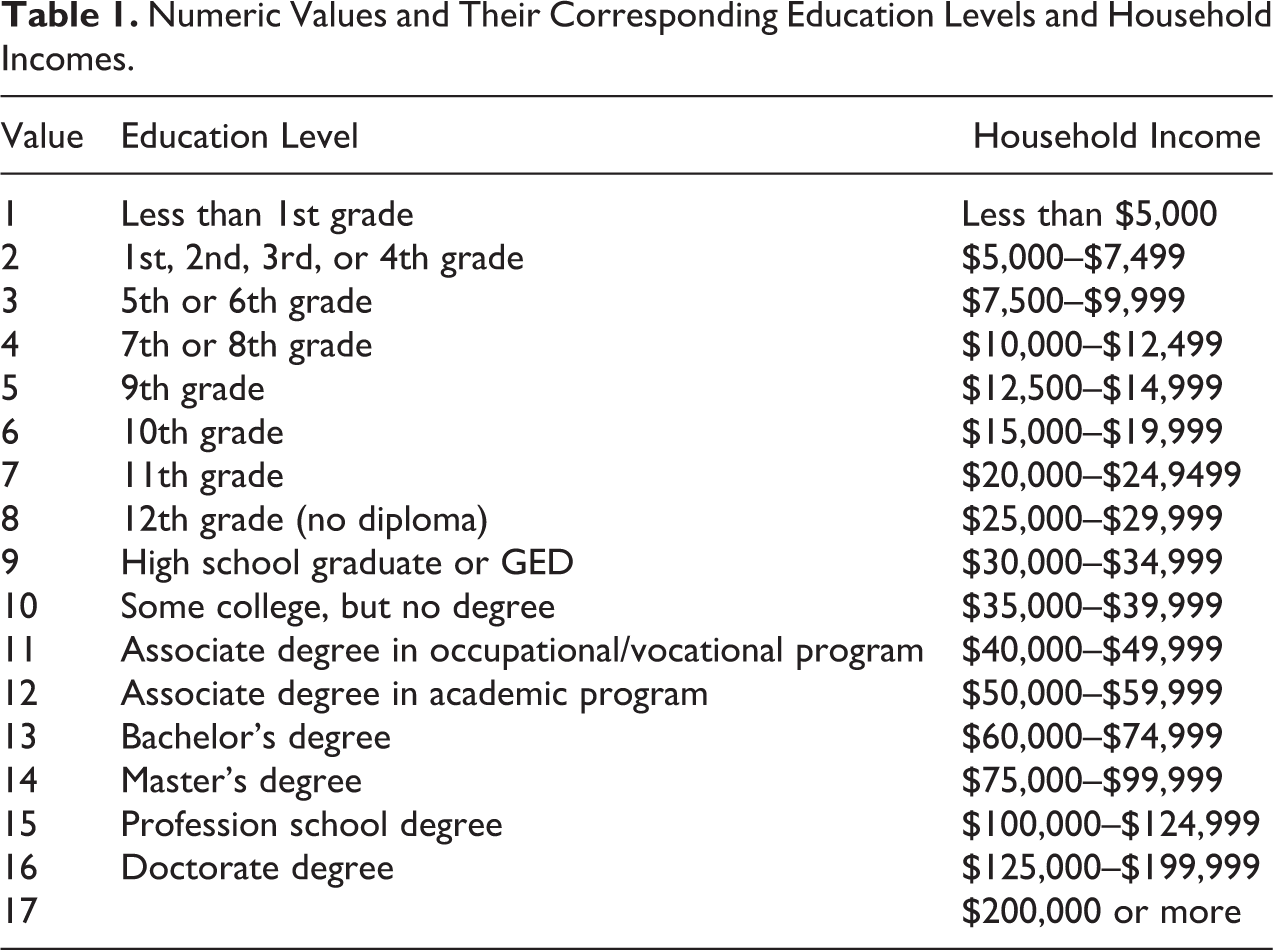
Numeric Values and Their Corresponding Education Levels and Household Incomes.
Estimation Based on Diary Data
Diary data: Source
The
Diary data: Preprocessing
The number of purchases made with each payment instrument on each day can be extracted from the 2012 DCPC data. Because general purchases and bills are reported in separate modules, it is possible to enter a bill payment once in each. Thus, we only count once entries in the bill and general purchase modules that share the same payment instrument, amount of payment, and merchant for a given individual and day of reporting. The result for each individual is a triplet of daily number of purchases,
Likely payment instrument adopters are identified with the help of the 2012 Survey of Consumer Payment Choice (SCPC), a second payments survey with high overlap with the DCPC, which directly asks about ownership and use within the past year of various payment instruments. In 2012,
Diary data: Likelihood
Mirroring the model developed in the subsection titled “Model” above, we assume

Estimation Based on Recall Data
Recall data: Source
The 2011–2012 Payment Recall Survey is an effort led by RAND to study the quality of recall via five online surveys administered every three months between July 2011 and September 2012 to a starting field of 3,516 ALP panelists. In each survey, respondents recall the number and total dollar value of payments made with each of the four payment instruments for four different recall periods: day (
Figure 2, which shows the dates of the recall survey and the first day of the diary for the 715 individuals who were featured in both, offers a representative view of participation dates. Although all surveys are e-mailed on the
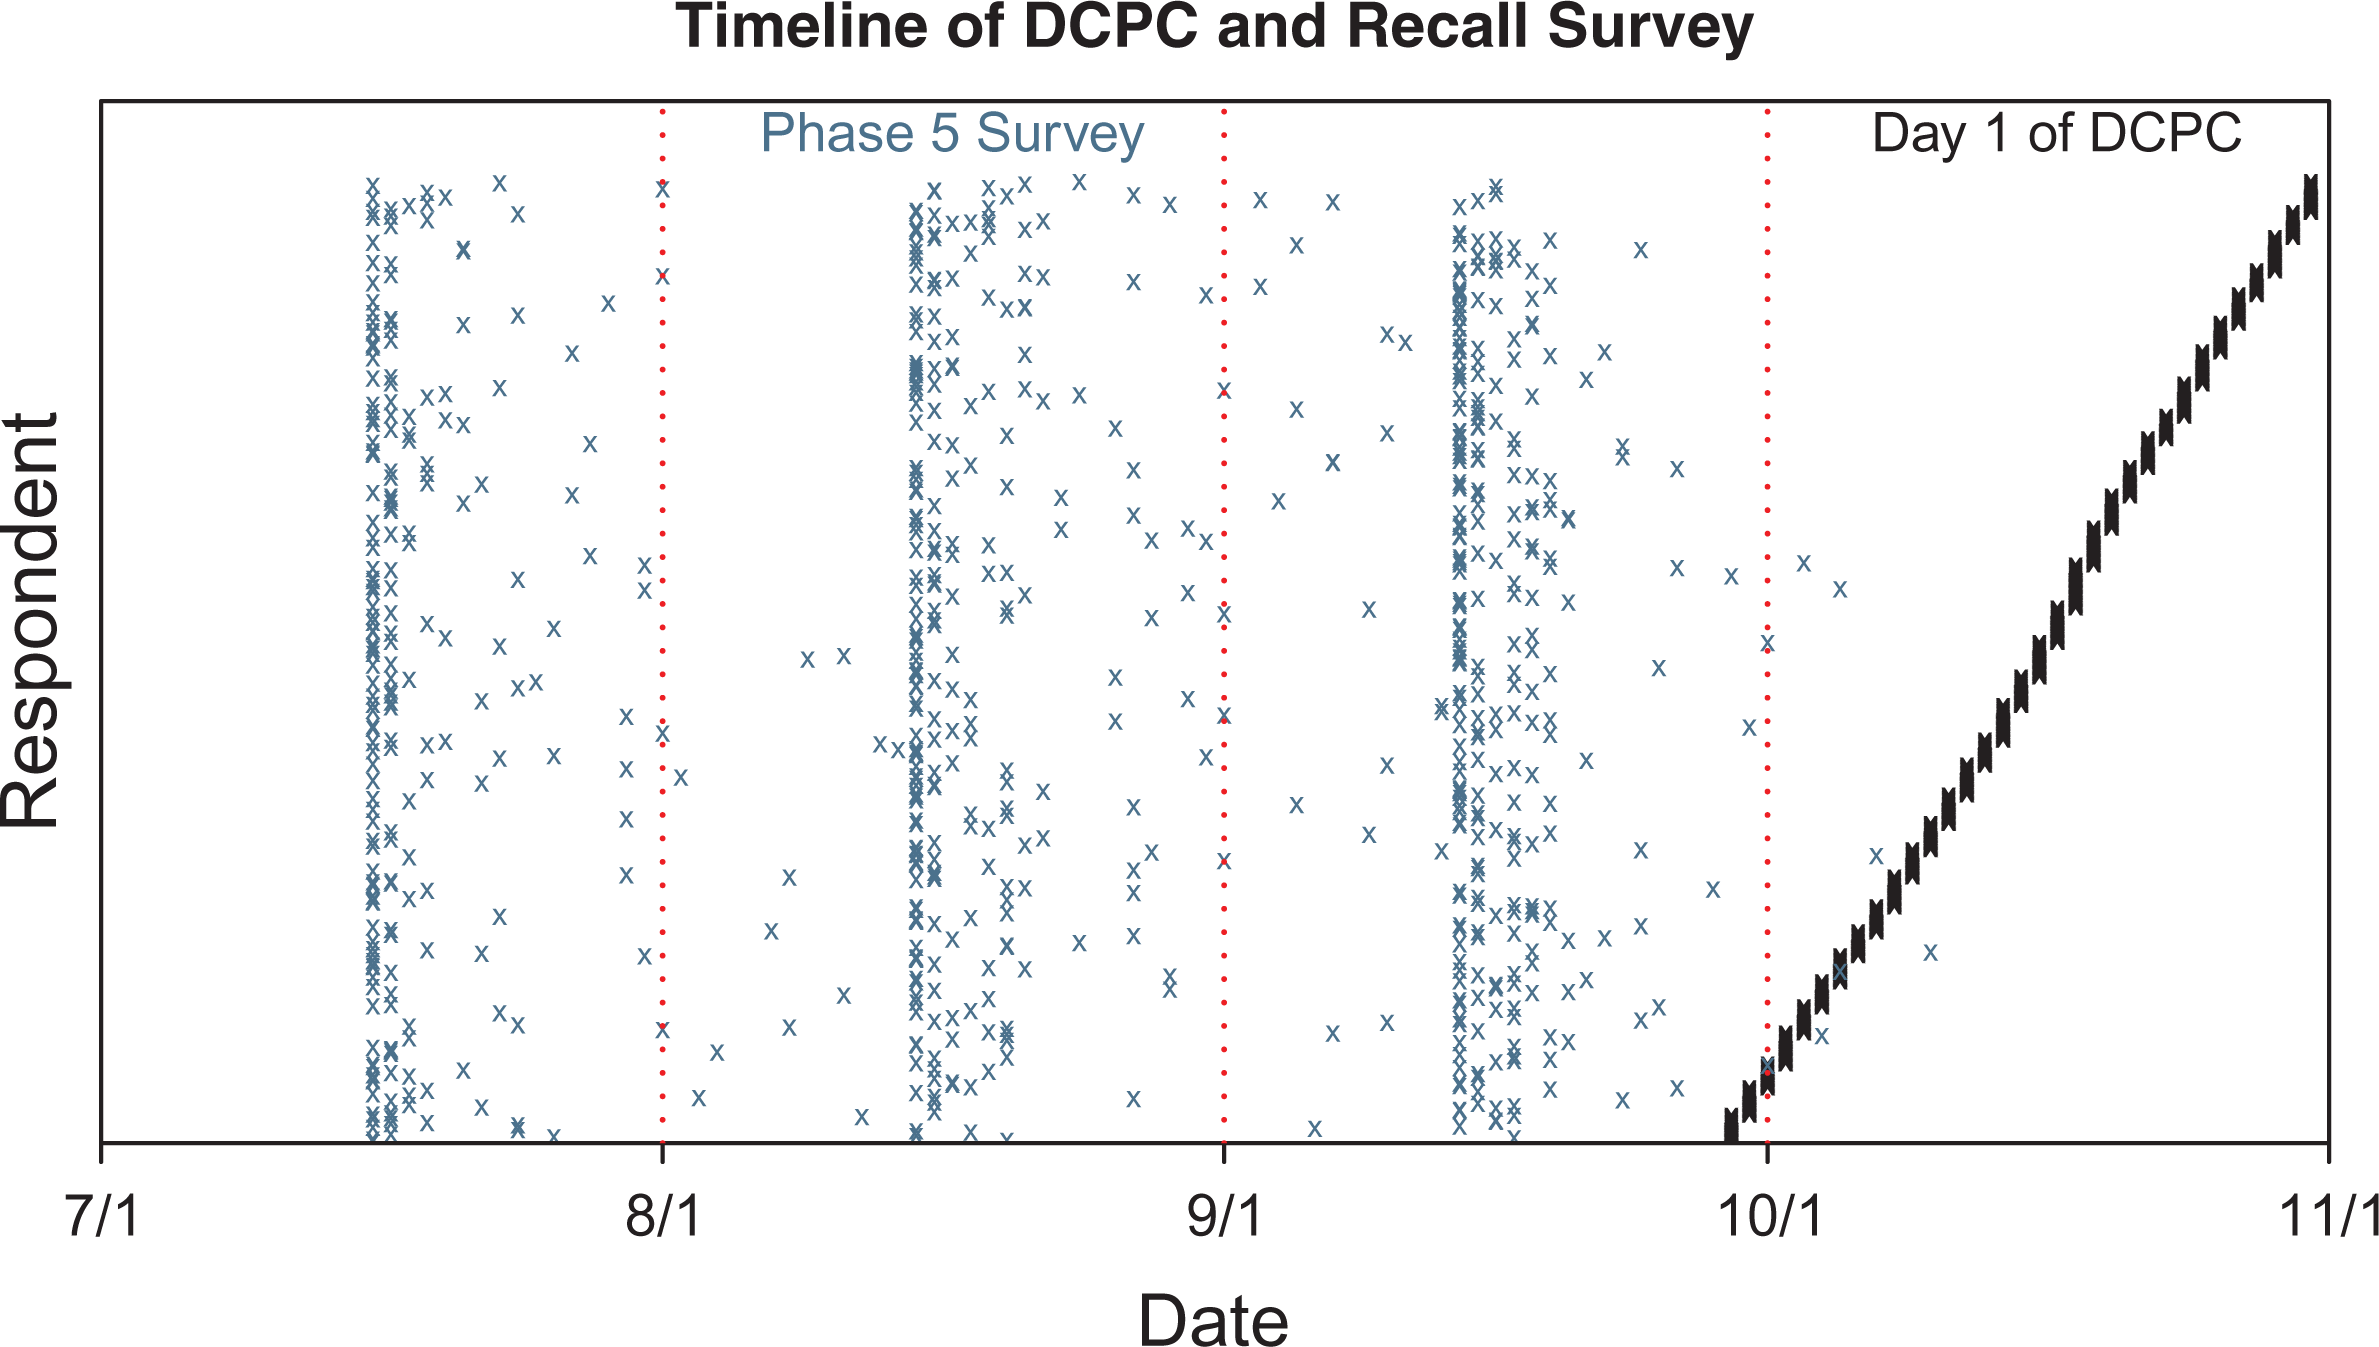
A temporal distribution of the recall survey and the Diary of Consumer Payment Choice for 715 individuals who participated in both.
Recall data: Preprocessing
In the case of recall data, likely adopters are defined as anyone who claims to be an adopter in the 2012 SCPC (977 recall survey respondents participated in the 2012 SCPC), anyone who made a payment in the 2012 DCPC, or, for the 289 who did not participate in either, reported making payments for at least one recall period in the recall survey. A necessary part of using the recall data for estimation is addressing highly unlikely response numbers in the right tail that are likely to affect parameter estimates. In this analysis, we adopt the approach of limiting estimation to those responses below some threshold. Specifically, let
Number of Recall Responses Above Threshold Removed From Analysis and the Total Number of Observations for Likely Adopters.
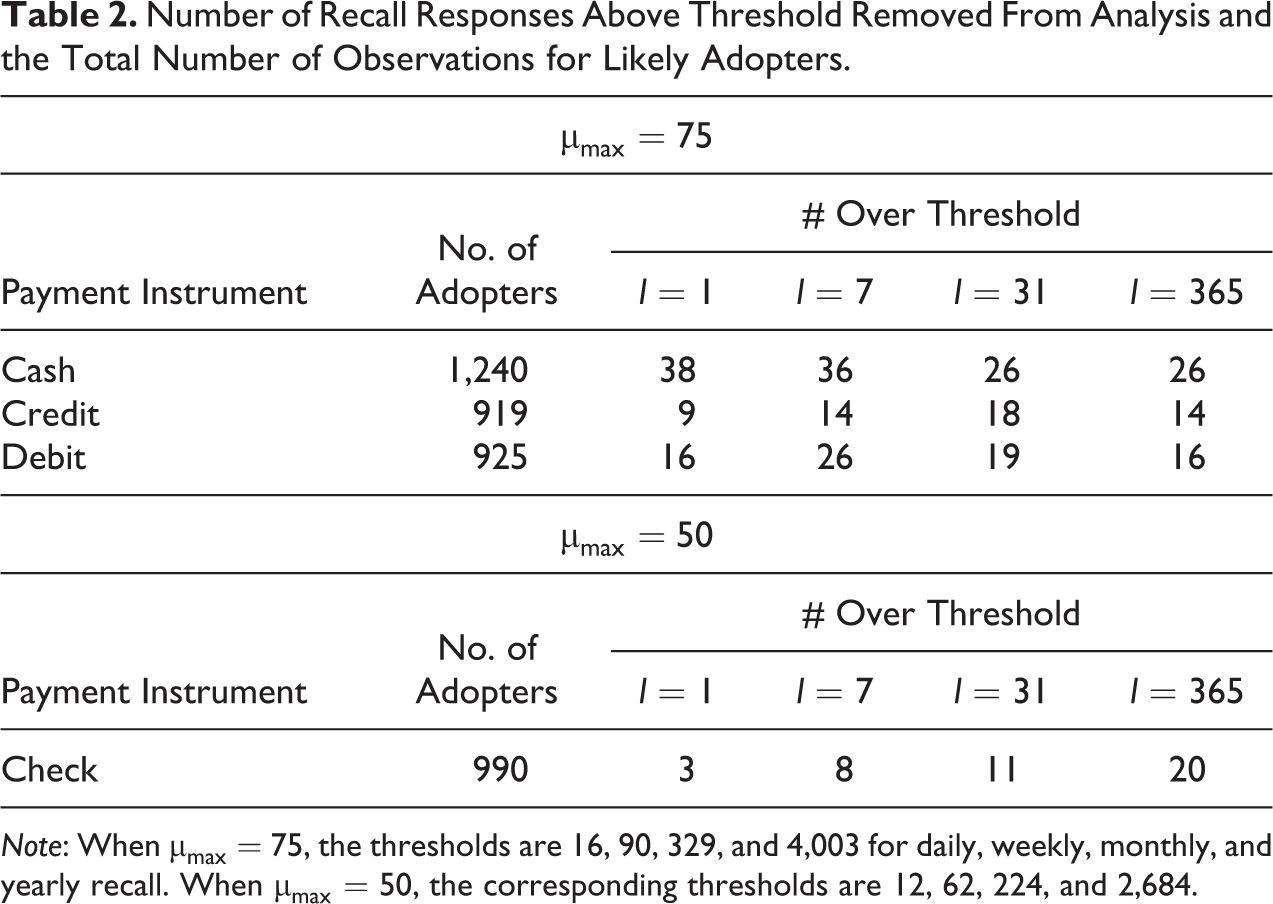
Note: When
Recall data: Likelihoods
Letting
Daily recall
Because it seems plausible that the survey lag in daily recall affects the quality of recall (Sudman and Bradburn 1973), we incorporate its potential effect into the daily count model given in equation (3). We define

The model in equation (6) assumes that reported recall corresponds to the true behavior when the survey lag is zero and that the effect of the survey lag effect is monotonic. While more complicated dynamics may be more realistic, it is counterintuitive that they are nonmonotonic or that greater accuracy comes from a longer survey lag.
Weekly/monthly/yearly recall
For longer recall periods the survey lag is zero, and we define the Poisson mean by

In the case of monthly and yearly recall, the form in equation (7) is an approximation of the true rate. Let
where
Parameter Estimation
Estimation details
To ease interpretation of parameters, all three demographic variables are centered and standardized by dividing by twice the standard deviation of the observed values in the sample of all diarists, as advocated by Gelman (2008). The priors taken for the primary parameters of interest,

For analysis that involves accounting for day-of-week effects, namely, the diary data and the daily recall, parameter estimation is simpler without a restriction on the sum of day-of-week effects. In that case, the weekly rate is not represented by

The daily recall model, given in equation (6), also estimates the survey lag effect, for which we use the prior

All models are estimated via a Markov Chain Monte Carlo (MCMC) algorithm, implemented in R-STAN, with four chains of 3,000 iterations each and a burn-in period of 1,500 iterations. To estimate posterior distributions for each parameter, we thin by drawing every
Results
In comparing the estimated dynamics based on different data sources, we focus on the demographic means. These are characterized by the slopes in equation (5),

Parameter estimates and 95 percent intervals based on diary (gray bars), daily (d), weekly (w), monthly (m), and yearly (y) recall.
The diary results show some interesting results regarding how demographics affect payment instrument use. Credit cards are used more frequently with increasing age, though it seems that higher income and education levels are the greater driving force behind use. Conversely, check use is primarily driven by age, with older individuals using checks more frequently. Debit card use decreases with age, and there is generally more homogeneity across social strata. Finally, the use of cash is generally steady across demographic groups.
In comparing the recall-based estimates to those based on the diary, perhaps the most obvious finding is that the base mean is poorly estimated by all four recall surveys. Estimates based on daily recall are especially poor, even when accounting for the effect of survey lag, which has a minor impact: Posterior means range from
On the other hand, the three longer recall periods do reasonably well at estimating the marginal demographic effects. Of the 12 slopes estimated, the credible intervals based on recall data overlap with the diary interval all but once each for monthly and yearly recall and in all cases for weekly recall. For daily recall, there is overlap in only eight cases. Subsequently, the posterior mean based on recall falls within the diary-based interval six to eight times for the longer recall periods and only three times for daily recall.
Comparisons between the diary and recall data are not perfect. Some fraction of the discrepancies in the findings can be attributed to seasonal differences between observation periods or the methodology used to define likely adopters or clean the data, but these seem unlikely to fully explain the observed inconsistencies. Thus, if one assumes the diary as accurate, it follows that recall data yield fundamentally incorrect inferences about population dynamics, most notably regarding the baseline number of weekly payments. Moreover, different recall periods yield the most accurate results for different payment instruments. Although we are unaware of other analyses comparing diary and recalled payments data specifically, the observed inconsistency across recall periods is to be expected based on more general research on consumption (Ahmed et al. 2010; Deaton and Grosh 2000; Hurd and Rohwedder 2009; NSSO Expert Group on Sampling Errors 2003).
Alternative Survey Design: Simulation Study
In this section, we use a simulation framework to study the potential benefits of a survey design in which diary data, assumed to be unbiased, are supplemented with possibly erroneous recall survey data. The basic methodology is to directly model and estimate the discrepancy between diary and recall rates within the process of estimating
Simulation
We consider a simulation framework similar to that of the case study. Thus, weekly means are defined by the following identities:

A hypothetical researcher is interested in estimating

Alternatively, the researcher can rely on recall for the past month (

The nuisance parameters are
We consider simulations for eight different scenarios defined by two different models of the truth and four different models for recall error, the details of which are specified in left-most column in Table 3 With respect to true behavior, model 1 is roughly based on the parameters corresponding to cash use, while model 2 is based on those of check use. The average weekly rate for the former is about
Parameters Used in Simulations: Two Defining True Distribution of Weekly Means and Four Defining Recall Error.
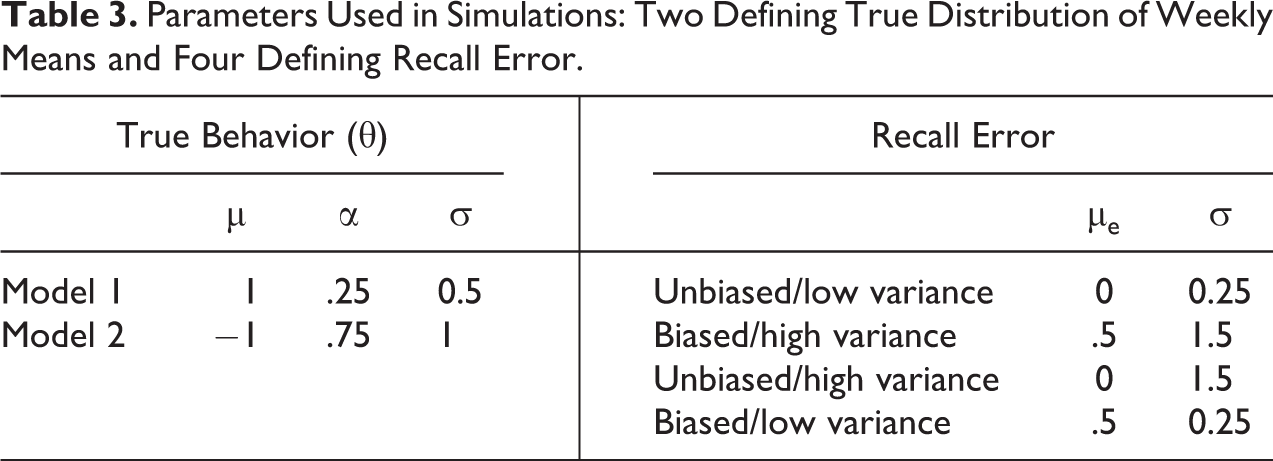
The four types of recall are defined by degree of bias and variance and are shown in the right-most table in Table 3. A useful measure in assessing the quality of recall is the ratio of
Analysis
There are many possible survey designs, but we focus on one in which

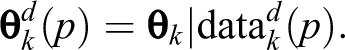
represent the corresponding diary data.


will have exactly

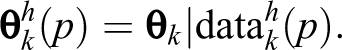
represent the corresponding hybrid data set.


Results
The roots of the individual
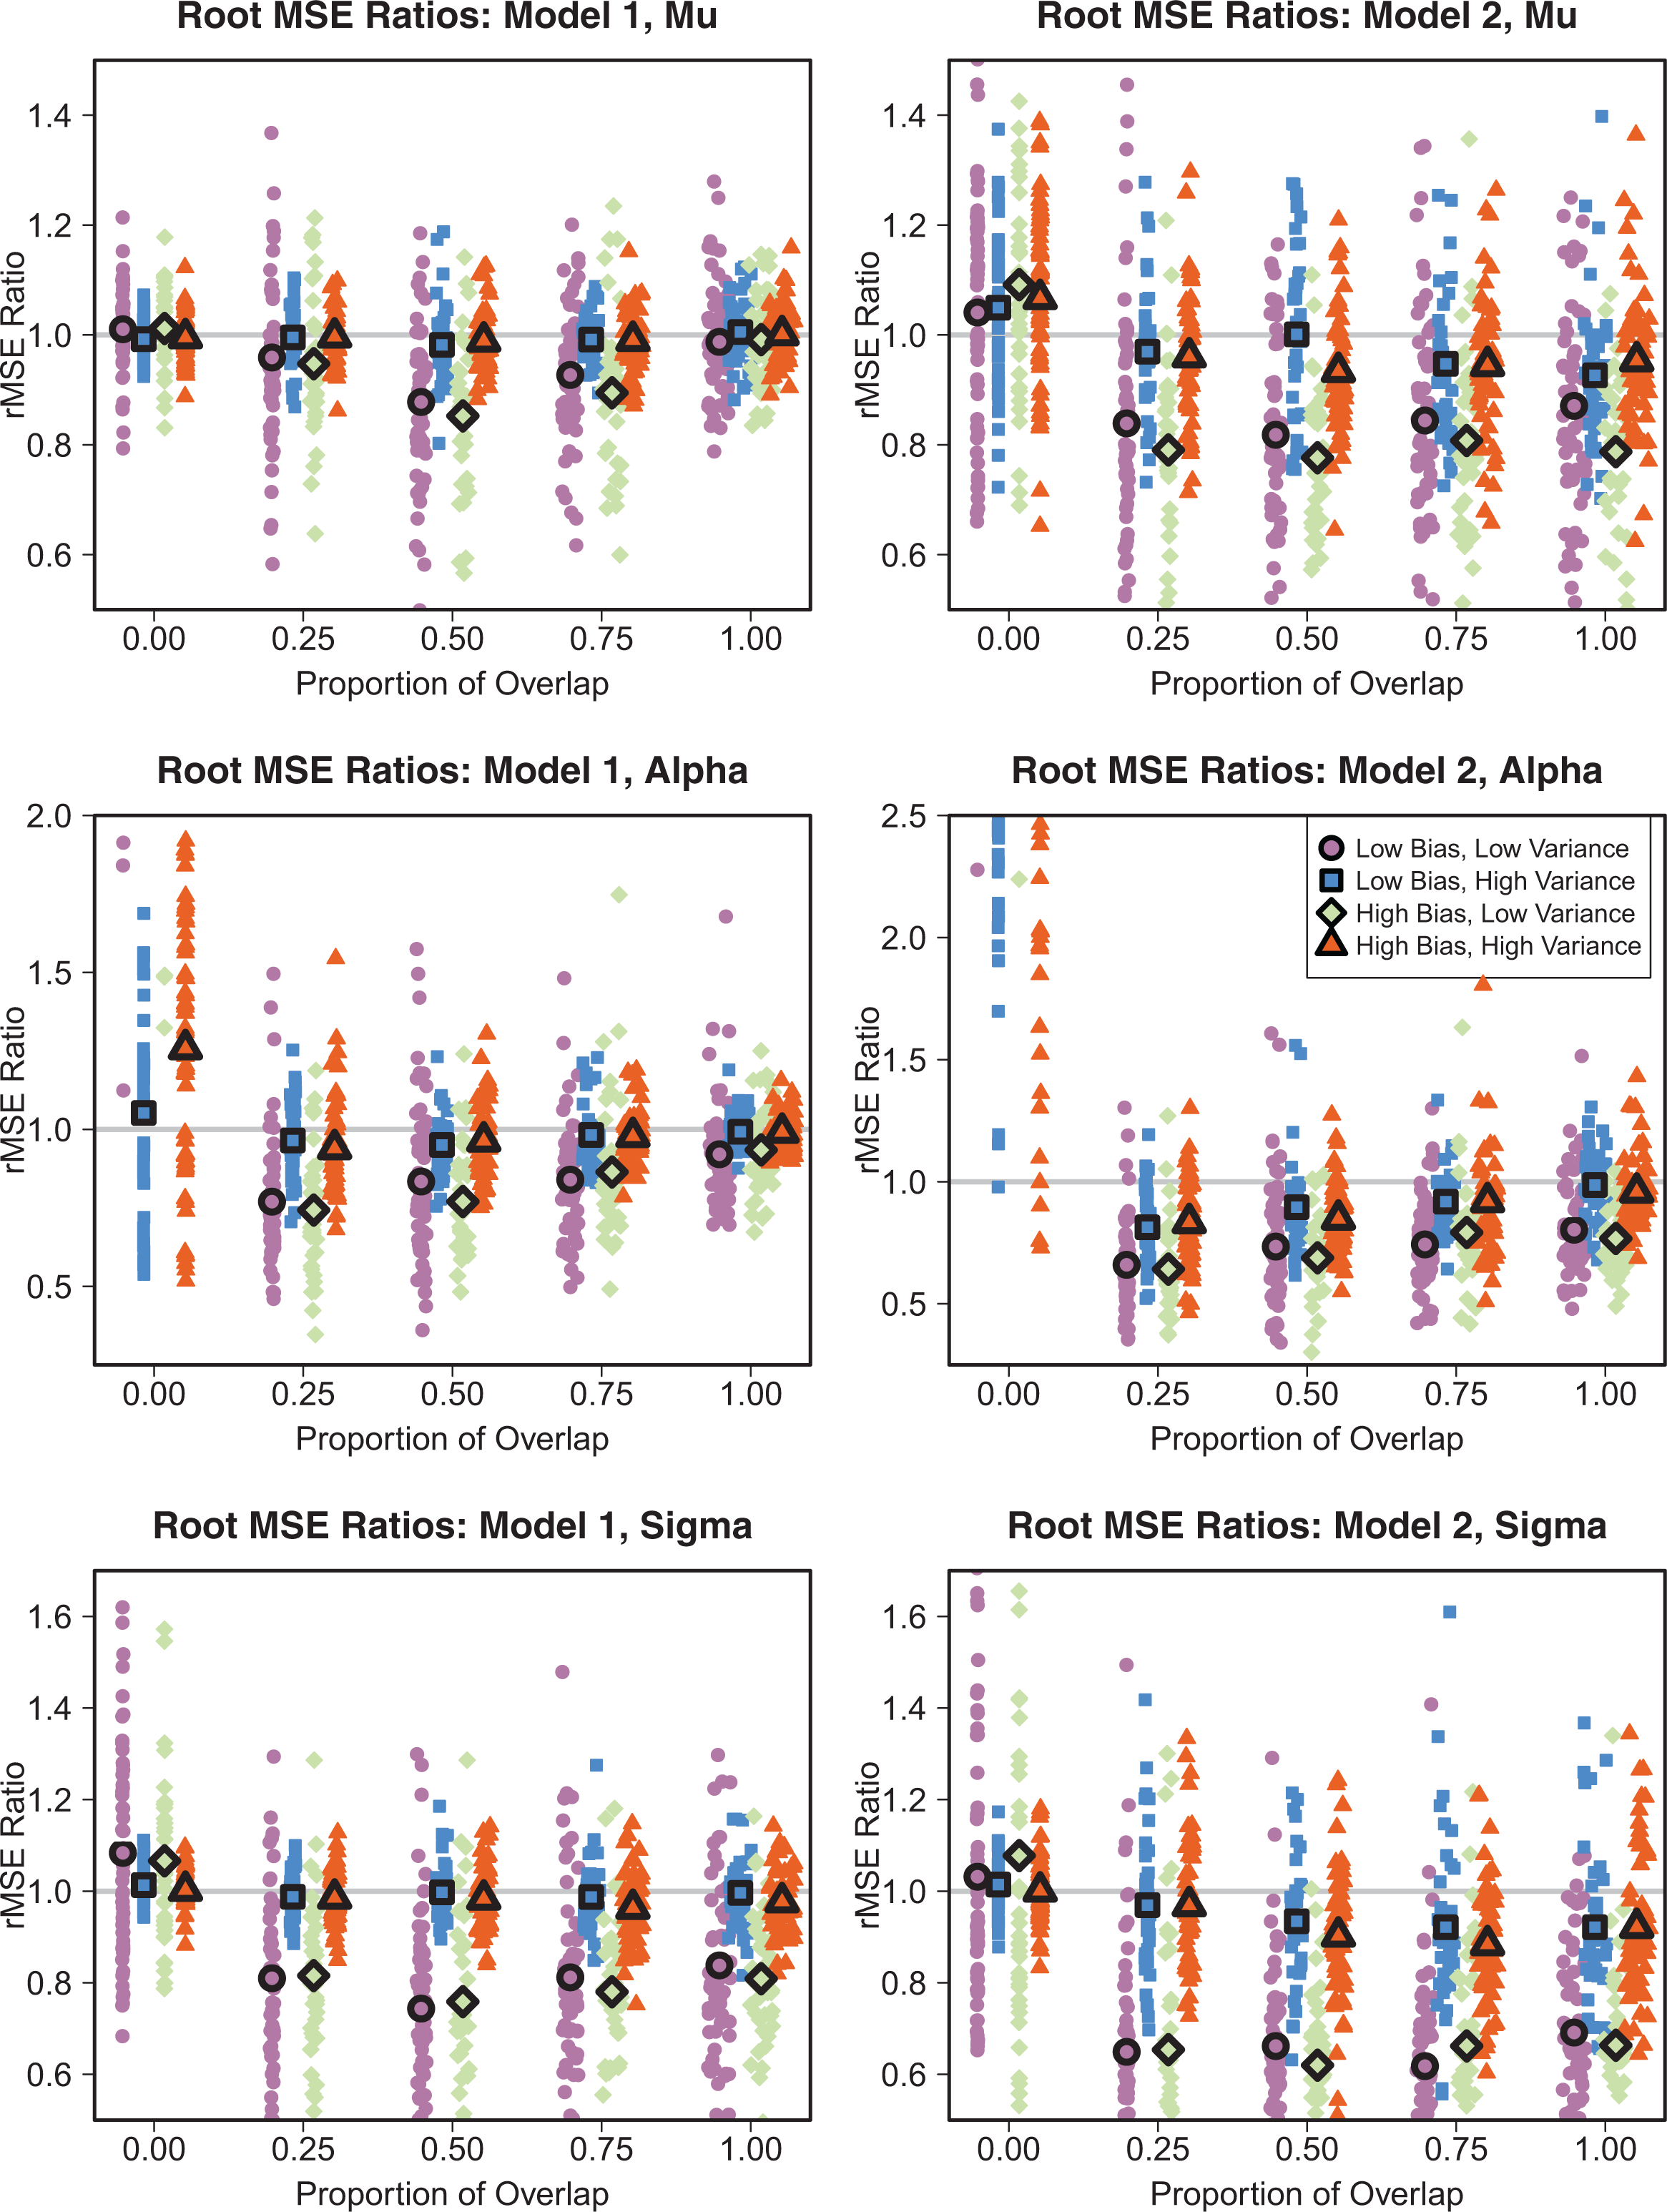
Observed values of
An interesting phenomenon occurs when there is no overlap in the recall and diary samples. Then, the values of

Posterior means and standard deviations of α based on diary data only (blue square) and hybrid data (red circle) for different degrees of overlap, p, for model 1 and two different recall errors. “Good Recall” refers to the low-bias and low-variance recall error and “Bad Recall” refers to the high-bias and high-variance recall error as defined in Table 3.
Implications for Survey Design
Up to this point, all analysis has ignored the costs of various survey designs, an essential factor in determining allocation of resources. In considering the practical implications of our simulation results, we again consider a researcher with a binary choice: collect
The framework developed in this paper naturally allows a comparison of the two survey designs by determining the benefits of each relative to a base design,

Based on theory outlined in the section titled “Framework” above and validated by simulations with
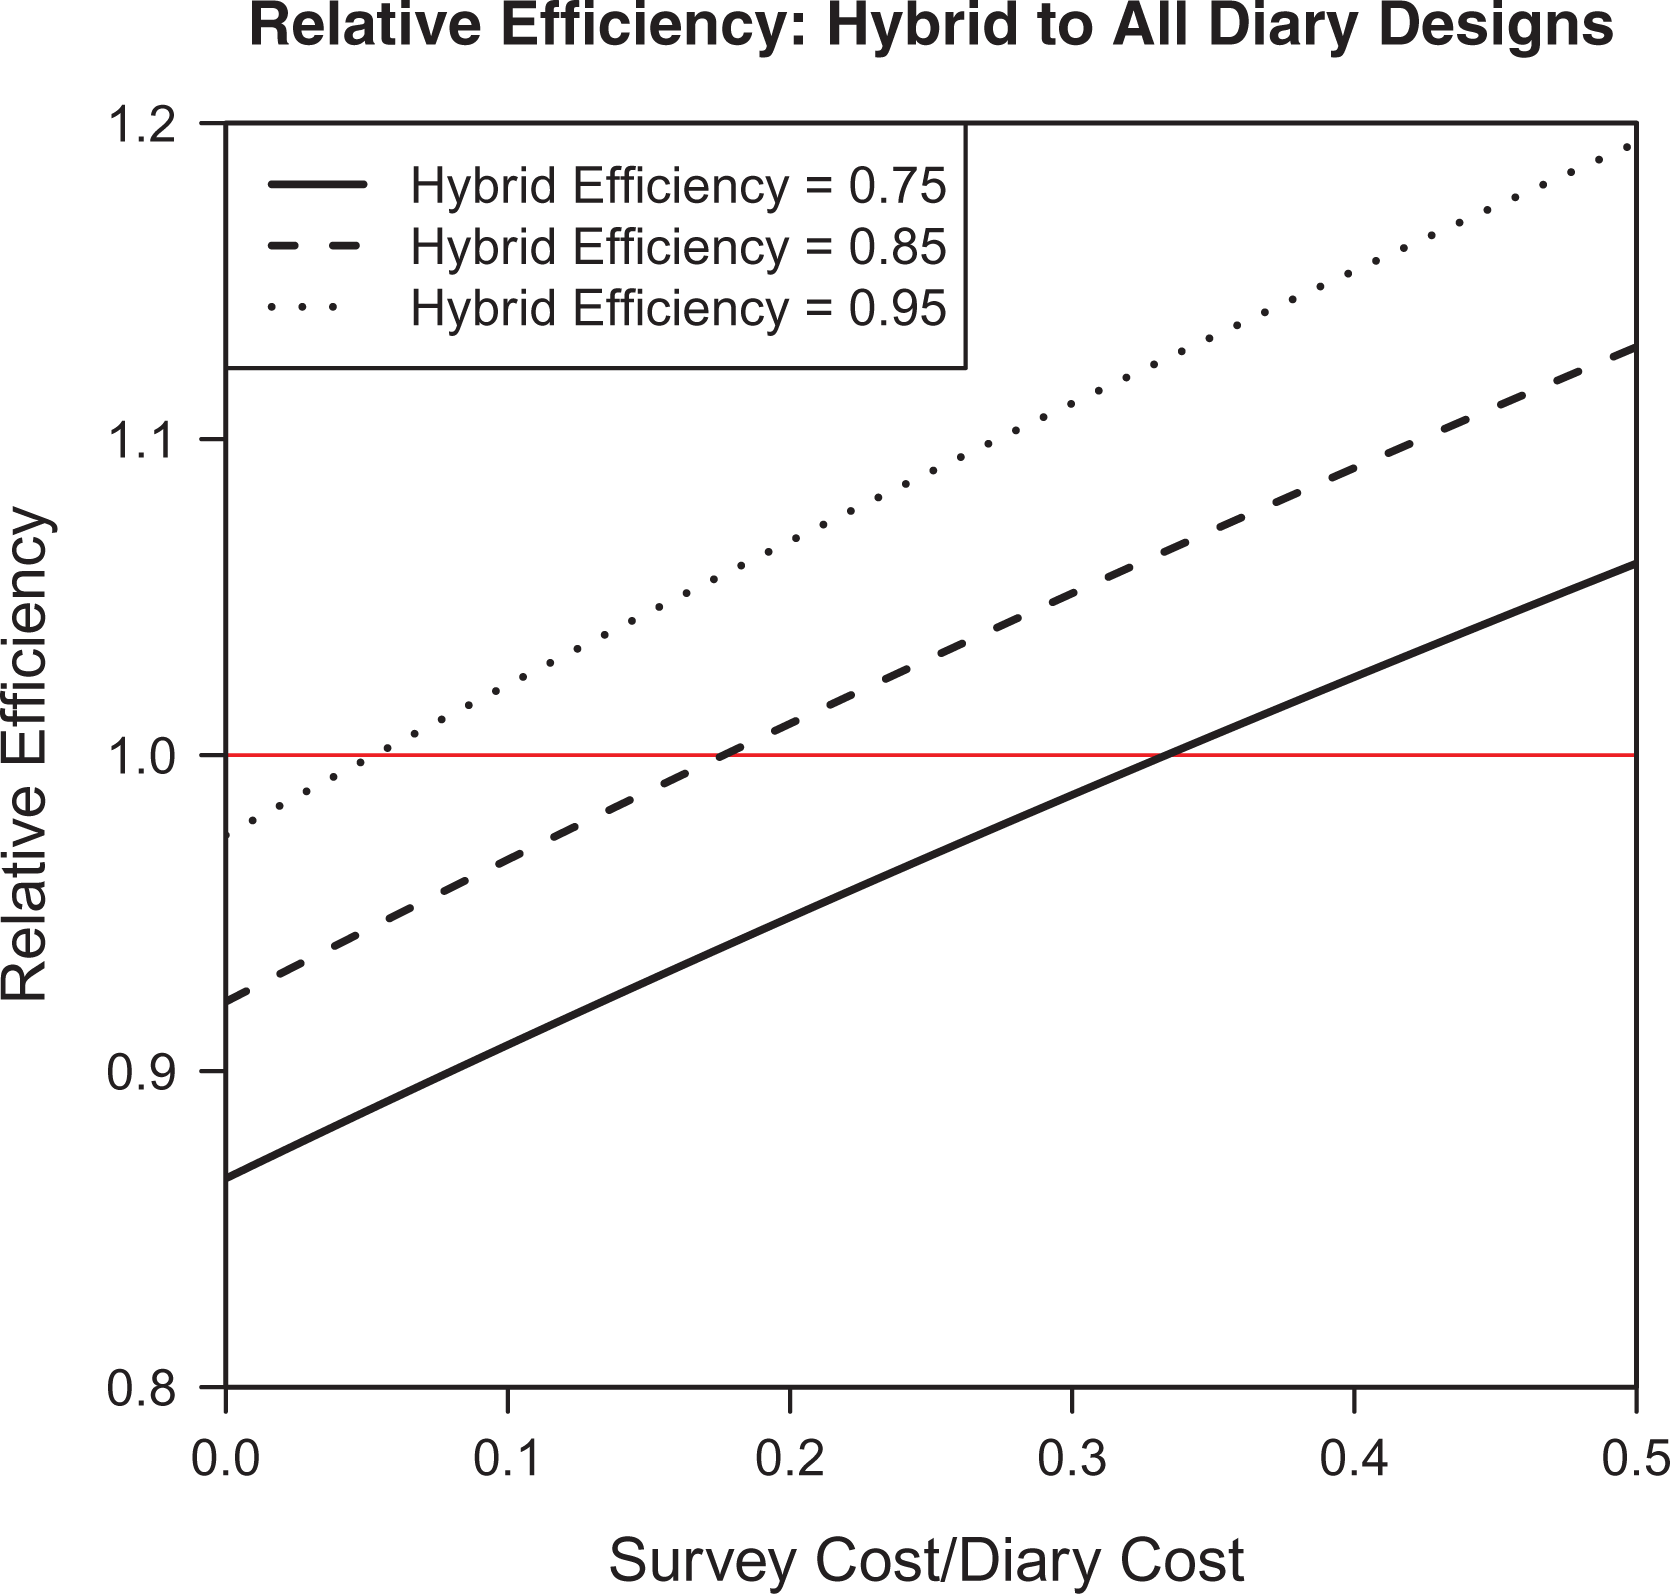
The relative efficiency of using a hybrid design to one in which only diaries are used based on the relative cost of the recall survey to the diary.
We note that the case where
Discussion
Overall, our simulation study suggests that if the quality of recall is reasonable and the cost of recall surveys is not too great, supplementing diary observations with recall surveys, as long as there is nontrivial overlap in the samples, provides for more efficient estimators of population dynamics than an all-diary design. In such cases, the sheer amount of information contained in the additional surveys outweighs that in the replaced diaries. Of course, the simulations in this article represent a relatively narrow range of possible survey designs, and more varied analyses would be informative in understanding how to best allocate resources.
Consolidating diary and recall data requires assumptions about the nature of the recall error. While we believe the model introduced in this article is adequate for many settings, extensions that further recognize subsets of the sample for which recall is of high quality can generate greater efficiency gains. For example, Battistin and Padula (2015) suggest that the levels of discrepancy depend on observable demographics such as income and education, in which case the bias and variance associated with recall can be made to differ according to demographic strata. A second possible development, based on the idea that lower-frequency events are more salient and, thus, better recalled, links individual recall error rates, now defined by
The cost analysis developed in this article is a simplified one intended to demonstrate the potential benefits of the hybrid design. In practice, researchers can use a similar approach to determine the number of diaries and surveys as well as degree of sample overlap that minimizes mean-squared error for a given budget, as long as the cost of each survey design can be calculated and the relative efficiency of a hybrid design can be approximated. An even more sophisticated approach might be an adaptive survey design, in which results are analyzed as data come in. Thus, the relative value of the surveys is actively evaluated, and, based on this, the number of additional surveys and diaries that should be administered in the future is determined. If recall is proving to have no value, all future resources can be used for diaries before the entire budget is exhausted. Alternatively, unbiased recall surveys suggest using them exclusively.
Footnotes
Author Note
The views expressed in this article are those of the author and do not necessarily represent the views of the Federal Reserve Bank of Atlanta or the Federal Reserve System.
Declaration of Conflicting Interests
The author(s) declared no potential conflicts of interest with respect to the research, authorship, and/or publication of this article.
Funding
The author(s) received no financial support for the research, authorship, and/or publication of this article.