
Abstract
Body temperature monitoring in most healthcare institutions is limited to checking the presence or absence of fever. Our present study evaluated the 24h continuous tympanic temperature pattern in patients with fever in order to detect typical patterns seen in tuberculosis (TB). This observational study was conducted on 81 undifferentiated fever patients whose recordings were stored using the TherCom device. Unique temperature patterns were analysed and compared. TB patients exhibited a unique temperature pattern, namely a slow temperature elevation followed by slow temperature fall seen in 78.5% (22/28) compared to 24.52% (13/53) of non-TB patients. Recognition of this pattern may therefore be useful as a valuable diagnostic aid in the early diagnosis of TB.
Introduction
Undifferentiated fever in patients present a major cause of morbidity, mortality 1 and economic burden for poor-resource countries such as India. The diagnosis of undifferentiated fever is a challenging task for clinicians:2,3 it is time-consuming and usually requires extensive diagnostic work-up which stretches resources where these are limited.
Tuberculosis (TB) is a major global health problem and India has the second highest number of TB patients in the world. 4 Most rural health clinics have inadequate laboratory resources and few trained clinicians to make early diagnoses of TB. A negative sputum smear test often results in repetitive hospital visits and encourages the use of non-specific antibiotics which obviously delays the true diagnosis of tubercular disease.
Fever is a cardinal symptom of many diseases from viral infections to neoplasms. It is considered to be a specific response of the host to an external insult. This fever response has specific patterns for particular diseases and thus provides an early diagnostic clue. 5 Such patterns in malaria, or enteric fever, and the Pel-ebstein fever in lymphoma are known. 6 A continuous temperature recording method is needed to capture and analyse a fever response, but is seldom used, except where existing diagnostic tests fail to arrive at a diagnosis. Conventional fever recordings every 6–8 h may regularly miss important fluctuations.7,8
A century ago, Woodhead et al. reported on the prognosis and diagnosis of quasi-continuous temperature recordings in TB patients. 9 Rectal probes were used and were therefore cumbersome and inconvenient for the patient; the lack of advanced hardware probably contributed to further studies not being done. Nonetheless, an abnormal body temperature curve analysis in febrile, critically ill patients was found to be significant with regard to the outcome from sepsis. 10 However, no studies were conducted with 24-h continuous temperature monitoring to analyse patterns among hospitalised patients with undifferentiated fever.
We hypothesised that such recording might give diagnostic clues. The aim of our study was to record and evaluate these patterns in patients with a diagnosis of TB.
Material and methods
Ours was an observational study conducted from April 2014 to August 2017 in a tertiary care hospital. A total of 81 patients aged 18–65 years presenting with undifferentiated fever were included in the study. Study participants were grouped into two groups, with tuberculous (n = 28) and non-tuberculous diseases (n = 53), based on final diagnosis by laboratory tests. Individuals with a history of hyperthermia or malignant hyperthermia, hypo- or hyperthyroidism, and ear-related problems were excluded from the study. During temperature recording, patients were instructed not to take any kind of antipyretic medications on their own, other than the antibiotics prescribed by their physician. participants were also instructed to abstain from taking a shower or bath over a period of 24 h and needed to be free of antipyretic medication 8 h before monitoring was started.
Informed consent was taken after explaining the detailed procedure of the study and risks associated with the experiment. The study was approved by the institutional ethics committee.
Demographic data including height, weight, erythrocyte sedimentation rate (ESR), body mass index (BMI), blood pressure, pulse and age of the study participants were noted before the temperature recording. An intact tympanic membrane was confirmed in all study participants and 24-h continuous tympanic temperature was recorded, using the tympanic thermistor probe (Mono-a-Therm Tympanic Temperature Probe, Mallinckrodt) which was inserted gently into the external auditory canal projecting towards the tympanic membrane and connected to the temperature monitoring device (TherCom, Innovatecsc).8,11 The tympanic thermistor probe has outer sponge material which covers the ear canal and nullifies the effect of external temperature. Although, oesophageal temperature is considered representative of the core body temperature in humans, it is not routinely measured owing to its impracticality. 12 However, tympanic probes give comparable results. 13
Among TB patients, 12 had sputum smear positive acid-fast bacilli (AFB), six had positive Gene expert tests and ten were diagnosed based on high-resolution CT scans. Among the non-TB group, there were cases of enteric fever (n = 24), brucellosis (n = 2), leptospirosis (n = 1), systemic lupus erythematosus (n = 4), aortoarteritis (n = 2), pancreatitis (n = 1), Still’s disease (n = 3), Kikuchi disease (n = 3), thyroiditis (n = 2), rheumatic fever (n = 2), ulcerative colitis (n = 1), hepatitis (n = 1), acute myeloid leukaemia (n = 2), non-Hodgkin’s disease (n = 2), Hodgkin’s disease (n = 2) and T-cell lymphoma (n = 1) confirmed by positive serology tests.
The recorded 24-h temperature data were visually inspected to detect any missing readings and were examined visually with following points: time of peak temperature; maximum temperature; early morning moderate surge; and peak characteristics (slow rise, steep rise, slow fall and steep fall). Inspected temperature data were filtered by the Savitzky-Golay filter without altering the original signal using MATLAB software (version R2015b).
The early morning moderate surge is defined as the secondary minimal temperature surge <1.0℃ occurring between 01:00 and 05:30, which is less prominent than the major peak temperature.
Slow temperature elevation is defined as a slow rise of temperature <2℃, where the peak temperature is reached within 8 h.
Slow temperature fall is defined as temperature fall from the peak temperature as it reaches the baseline temperature over ≥6 h.
Data were expressed as mean ± standard deviation or median, interquartile range (IQR). Statistical package for Social Sciences (SPSS) version 16 (Chicago, IL, USA) was used for data analysis.
Results
Summary of demographic details of participants.
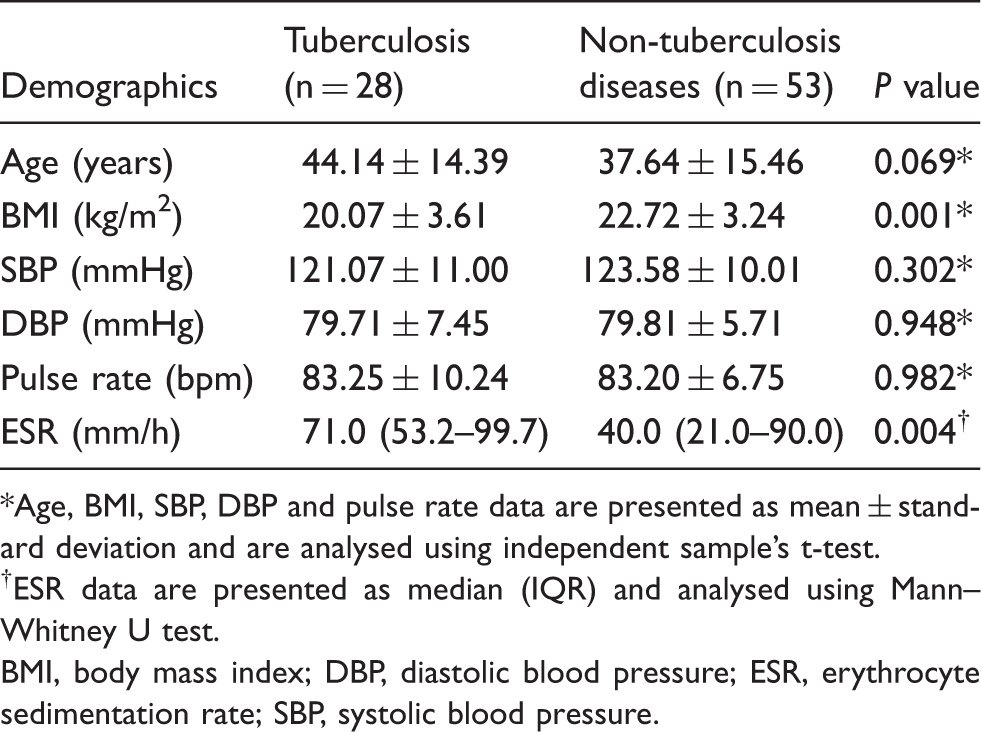
Age, BMI, SBP, DBP and pulse rate data are presented as mean ± standard deviation and are analysed using independent sample’s t-test.
ESR data are presented as median (IQR) and analysed using Mann–Whitney U test.
BMI, body mass index; DBP, diastolic blood pressure; ESR, erythrocyte sedimentation rate; SBP, systolic blood pressure.
Visually important characteristic features were noticed in 24-h continuous tympanic temperature pattern of TB and non-TB patients. In the former, 78.5% (22/28) showed slow temperature elevation and slow temperature fall compared to 24.52% (13/53) among the latter (Figure 1). Correspondingly, 82.14% (23/28) of the former exhibited early morning moderate surge in temperature, whereas only 9.42% (5/53) among the latter did so. Only 5.6% (3/53) of non-TB patients observed similar temperature patterns as those of TB patients.
Individual temperature patterns of TB and non-tuberculous diseases.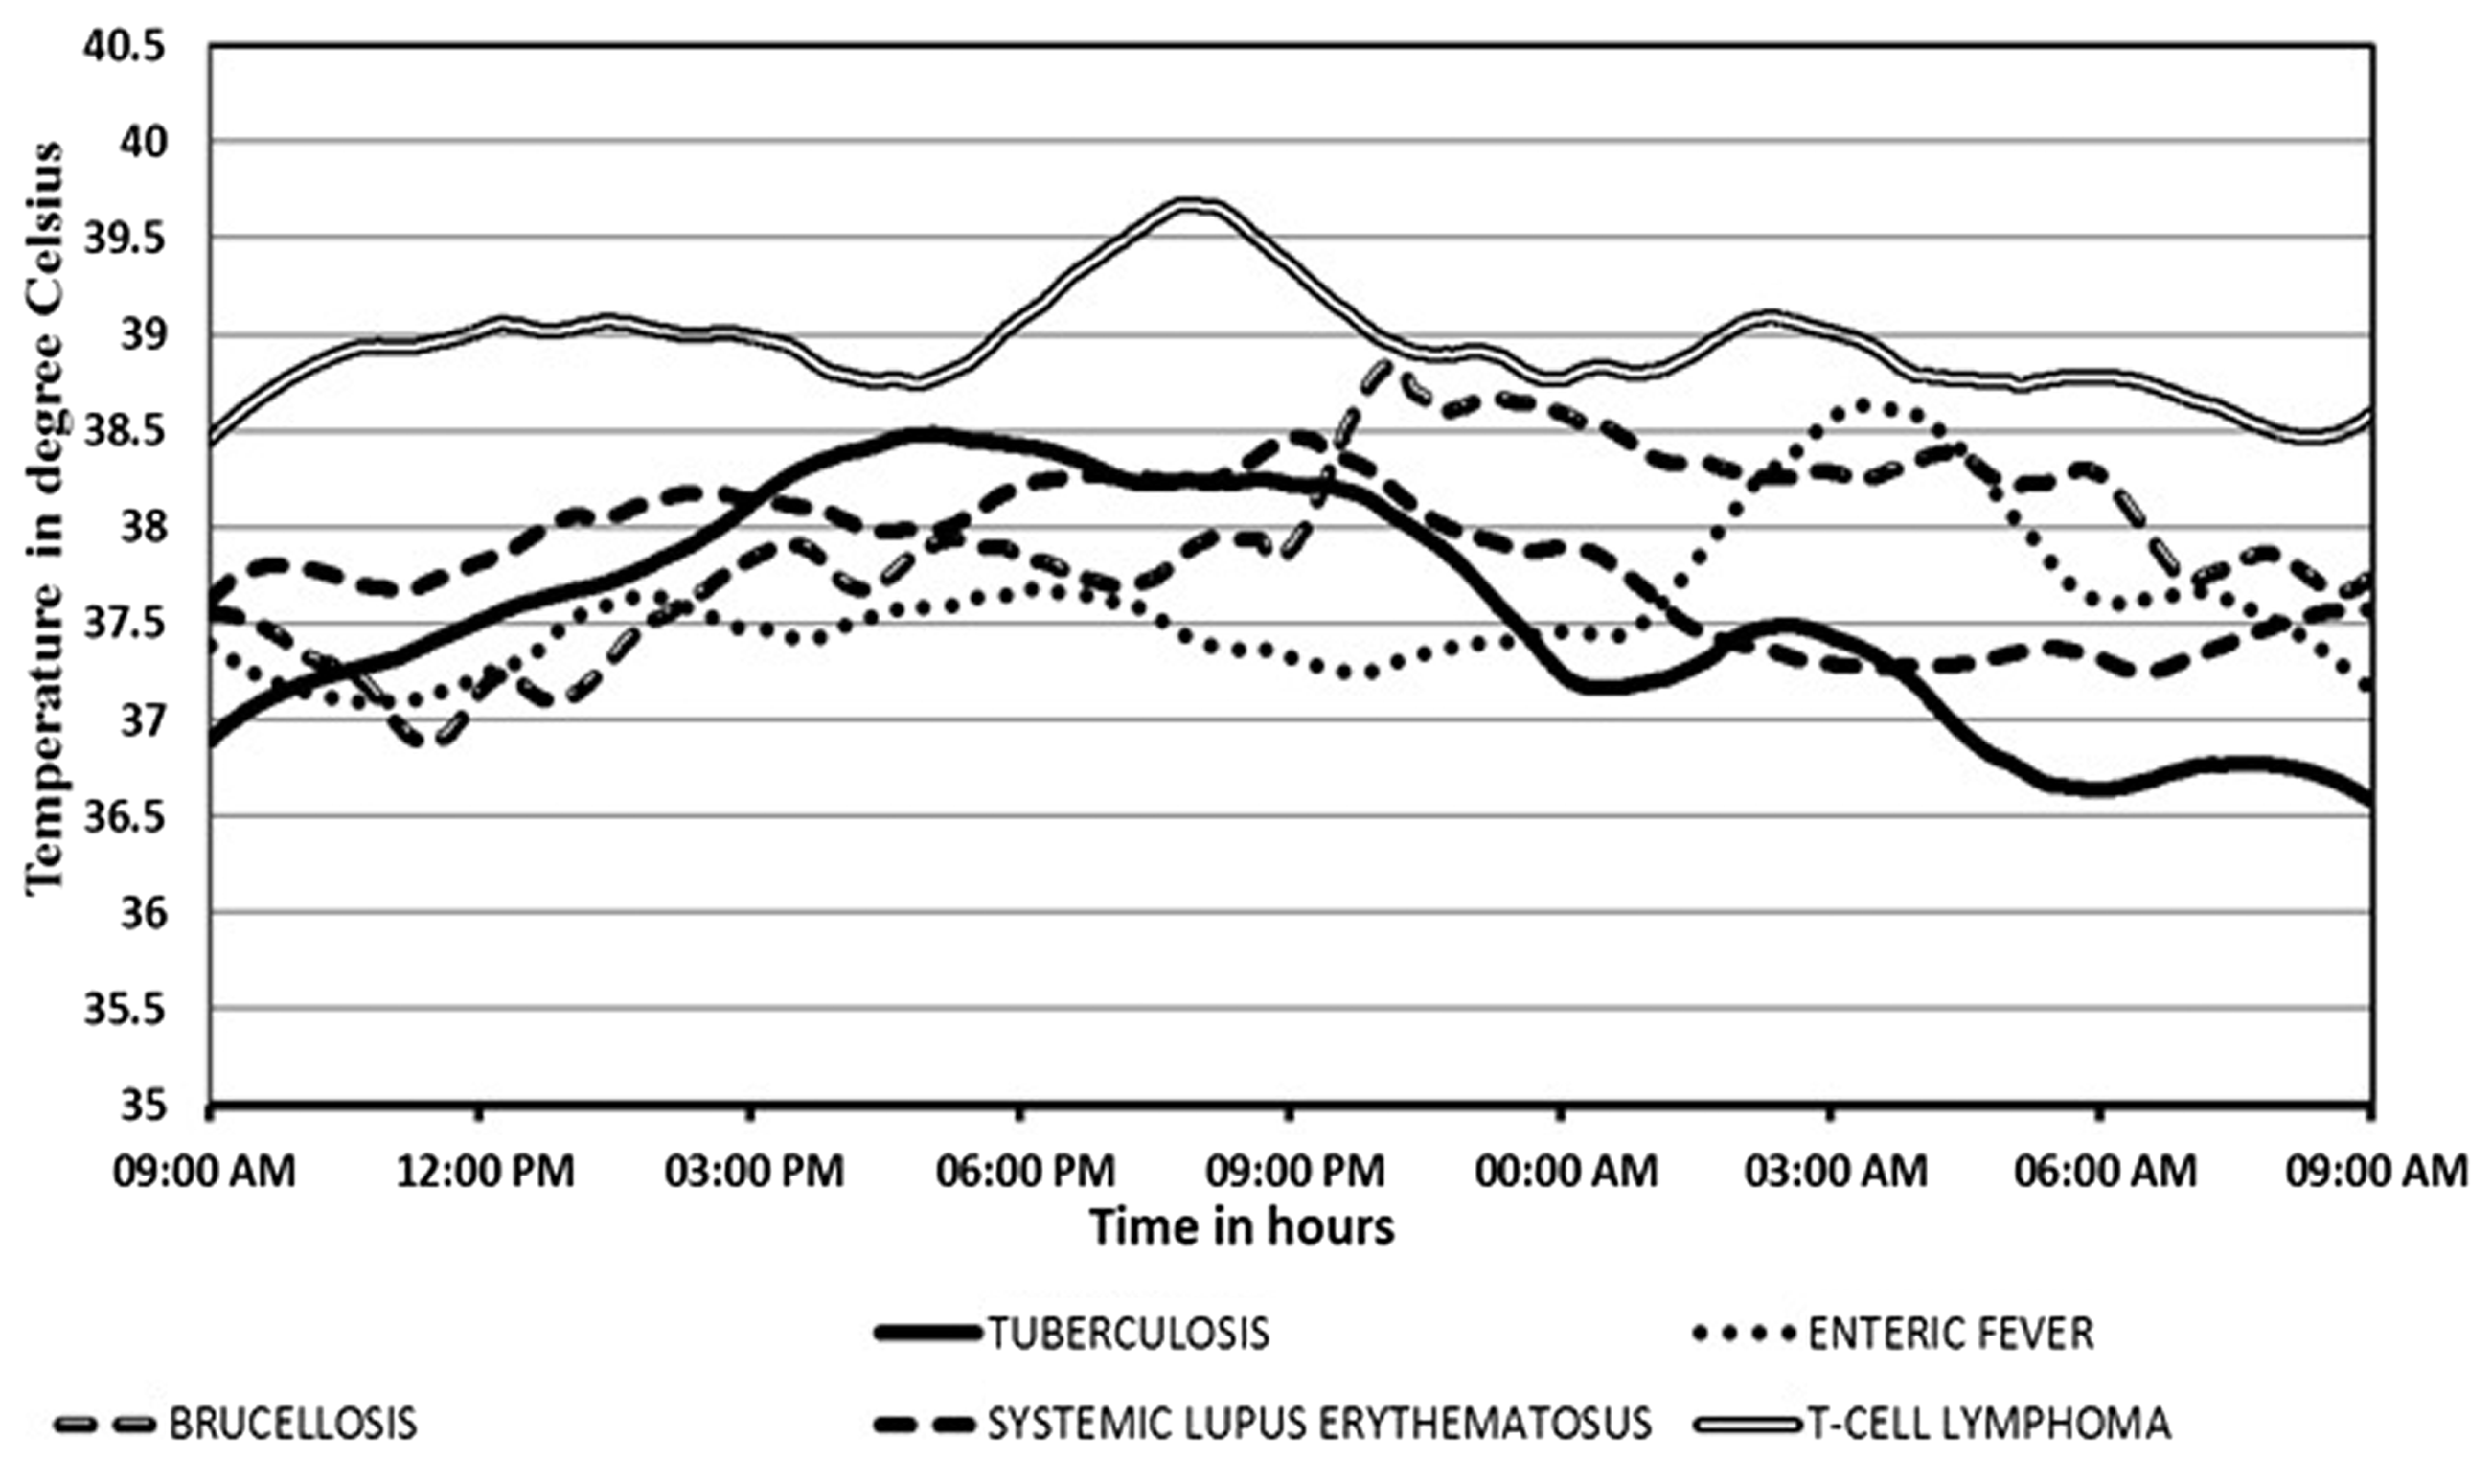
The average peak temperature of tuberculosis patients was found to be 39.02℃ (±0.68) and the average time of peak temperature was at 21:10 (±4.10). In the non-tuberculous group, these were found to be 38.94℃ (±0.69) and 22:10 (±3.42), respectively.
Discussion
Our observations from this study provide further evidence that continuous 24-h temperature monitoring and visual analysis of temperature patterns of TB have unique fever patterns (Figure 2), which give significant clues to suggest pathological or microbiological test for diagnostic confirmation.
Individual temperature patterns of TB patients (n = 10).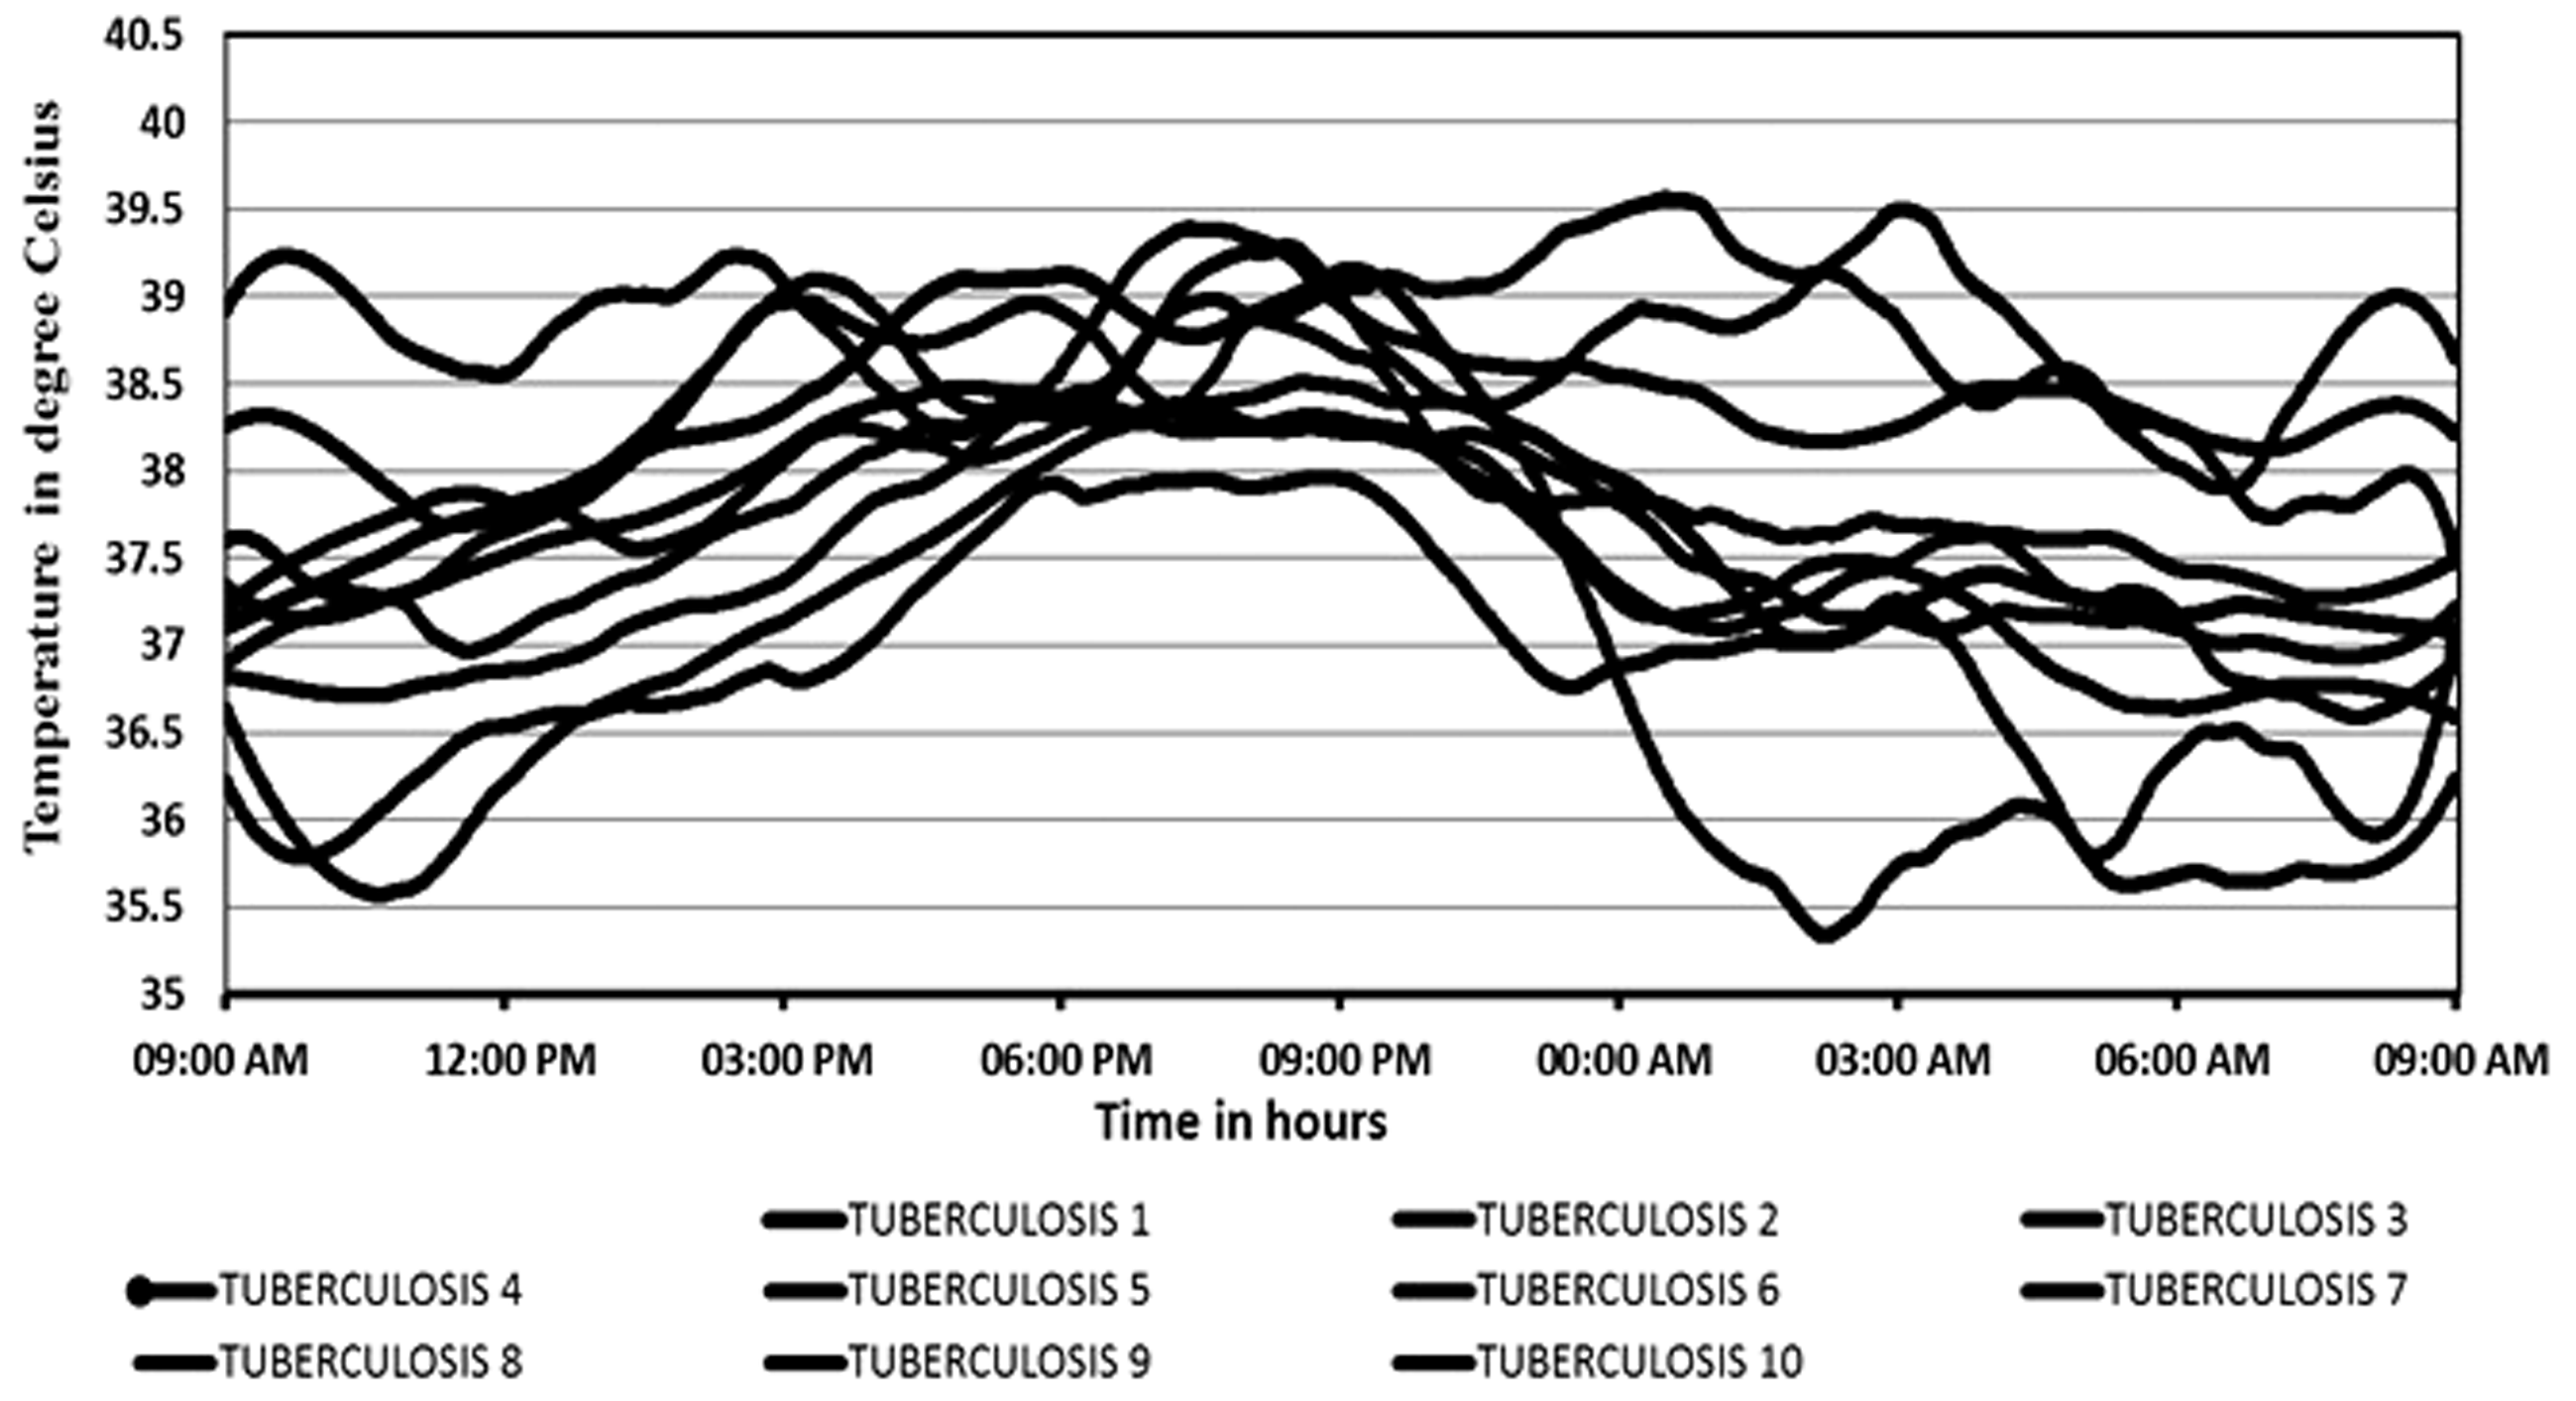
We found typical TB temperature patterns different from those of the non-tuberculous group. In resource-limited clinical settings, this simple method of visual temperature pattern analysis could aid in diagnosis and even in recommending empirical treatment.
Our study used a simple, patient and user-friendly recording device which is both sophisticated and reliable.7,14 We found characteristic visual temperature features in tubercular patients, which were originally observed by Woodhead et al. 9 Almost all had a steady temperature fall after reaching a plateau, lasting for 8–10 h. 9 In agreement with Woodhead et al.’s seminal study, we also found that a gradual rise with small jerky variation is more prominent in inflammatory disease and less so in TB. The steadily rising temperature reaching a plateau between 21:00 and 00:00, then steadily falling to reach a nadir over 6–8 h with small moderate temperature surges, was typical. In addition, the early morning moderate surge in temperature was a distinctive feature.
Previous reports showed that a morning temperature spike gives an early diagnosis of diseases, especially in miliary TB. 15 We found that, by continuous recording, such fever patterns (an early morning moderate temperature surge between 01:30 and 05:30) may be found in a majority of TB patients, even without miliary disease. The literature typically describes temperature defervescence followed by night sweats,9,16 and this is corroborated by our temperature recordings, providing visual corroborative evidence of such phenomena for diagnostic purposes.
If avoiding unnecessary expensive diagnostic tests is possible by simple 24-h temperature monitoring, this would be a major advance.
Our study has some limitations. First, it was conducted using a small sample size. Second, visual interpretation of temperature patterns was performed. Computerized analyses would give a more accurate appraisal and raise the validity and reliability of read temperature patterns.
Conclusion
Fever pattern analysis is an ancient tool, but with modern application, can serve as a critical method for the diagnosis of febrile diseases. Significant differences in fever pattern have been demonstrated and this subject needs broader application and interpretation.
Footnotes
Declaration of conflicting interests
The author(s) declared no potential conflicts of interest with respect to the research, authorship, and publication of this article.
Funding
The author(s) disclosed receipt of the following financial support for the research, authorship, and/or publication of this article: Resources for this study were provided by Kasturba Medical College, Mangaluru, Manipal Academy of Higher Education, Manipal.