



Abstract
We are interested in the psychometric properties of the South African Personality Inventory, a personality measure developed to apply equally to speakers of all official languages in South Africa, by testing for measurement invariance across the four ethnocultural groups in South Africa. We conducted an exploratory structural equation modelling analysis to eliminate any restrictions on the variables and to allow them to covary. While measurement invariance was found on configural and metric levels, scalar invariance was not found. The results advance the aim of the South African Personality Inventory to comply with stipulations in South Africa’s Employment Equity Act regarding fair and unbiased assessments.
Keywords
Psychological testing and assessment practices in South Africa have a history of using measuring instruments imported from Western countries (mainly Europe and America), often without adaptations to increase the suitability of the instrument for multicultural South Africa (Blokland, 2016; Kekae-Moletsane, 2004; Moletsane, 2016; Valchev et al., 2011; Vogt & Laher, 2009). In addition, practitioners in South Africa have been trained mainly in Western psychological measures and theories, yet find themselves working with people from both Western and non-Western cultures (Blokland, 2016). Most available psychological approaches and instruments are referred to as emanating from ‘W.E.I.R.D’ (Western, educated, industrial, rich, and democratic) contexts (Henrich, Heine, & Norenzayan, 2010). Attempting to apply these Western psychological principles and training in cultures outside the country of origin can bring about challenges for psychologists and researchers since adapted psychological measures nevertheless exclude most people residing outside the countries of origin (Laher & Cockcroft, 2013), raising issues relating to test bias and equivalence (Foxcroft, 1997; Meiring, van de Vijver, Rothmann, & Barrick, 2005; van de Vijver & Rothmann, 2004). It is therefore difficult to make valid cross-cultural comparisons (Welkenhuysen-Gybels & van de Vijver, 2001).
Applying imported and adapted psychological measures in a multicultural context such as South Africa has raised debate regarding bias, measurement invariance, and fair assessment (Visser & Viviers, 2010). Most psychological measuring instruments used in South Africa could be culturally biased (Moletsane, 2016), might not adequately capture a construct such as personality in a language different from the country of origin (Blokland, 2016), and may produce inconsistent results when comparing ethnocultural groups 1 in South Africa (Foxcroft, 2004; Meiring, van de Vijver, & Rothmann, 2006; Meiring et al., 2005; Valchev et al., 2011; van de Vijver & Rothmann, 2004; Vogt & Laher, 2009).
To minimise and ultimately eliminate biased and discriminatory psychological measuring instruments, the government included legislation in the Employment Equity Act (EEA) 55 of 1998, Section 8 as adapted (No 47 of 2014) which requires that testing and assessment practices be unbiased, be done with valid and reliable measuring instruments, and be applicable in all groups (Government Gazette, 2014). The law also refers to equitable test use, which implies that the test should be unbiased and fair to all groups, but also that statements based on test scores should not discriminate in favour of or against any group. The compliance of an assessment with EEA legislation can be tested by investigating whether an instrument is equally predictive across ethnocultural groups. An example of such a procedure is the test of whether regression lines that predict job performance on the basis of school performance is the same for all ethnocultural groups. This legislation thus tasks researchers and assessment agencies with developing instruments that emphasise the fair and equitable use of tests in the multicultural South African society.
Changing the approach to the development of psychological assessment is in line with the recent focus on the decolonisation of psychology in the African context (Barnes, 2018; Barnes & Siswana, 2018; Laher & Cockcroft, 2014; Long, 2016; Macleod, 2018; Pillay, 2017; Ratele, 2017; Ratele et al., 2018). Barnes (2018) states that ‘The (decolonisation) movement attempts to disrupt the universal ideas about the human condition and gives voice to those who have been historically overlooked or deliberately marginalised’ (p. 380). Decoloniality challenges the dominating force of monoculturalism, Eurocentrism, and Western epistemologies by foregrounding the knowledge domain in the production of pluriversality and epistemic justice (Glover, 2019).
However, developing psychological assessments that cater for all components of society remains challenging. Various researchers have indicated that the reasons for developing psychological assessments that will be valid, reliable, fair, and unbiased towards all South Africans include unequal education and employment conditions (Laher & Cockcroft, 2017), Black people being poor and ‘unpsychologised’ (Long, 2016), and poverty and income inequality (Barnes & Siswana, 2018). The South African Personality Inventory (SAPI) project set out to contribute to developing an inclusive personality assessment (Laher & Cockcroft, 2014), which is in line with the stance of the movement for the ‘decolonisation of psychology’.
The SAPI project developed a culturally informed measuring instrument that aims to create a personality model and measuring instrument that covers concepts of personality as found in the 11 official spoken languages in South Africa (Hill et al., 2013). The SAPI project involved both a qualitative and a quantitative phase (Fetvadjiev, Meiring, van de Vijver, Nel, & Hill, 2015; Hill et al., 2013; Nel, 2008; Nel et al., 2015; Valchev, 2012; Valchev et al., 2012, 2011). The project commenced with interviews conducted with individuals from all walks of life as well as from the 11 official language groups (Cheung, van de Vijver, & Leong, 2011). These interviews yielded personality descriptors that were translated into English to form the initial nine-factor structure of the SAPI (Fetvadjiev et al., 2015; Hill et al., 2013). The initial SAPI factors were conscientiousness, emotional stability, extraversion, facilitating, integrity, intellect, openness, relationship harmony, and soft-heartedness (Nel, 2008; Valchev et al., 2012). Thus, by including a very diverse and representative sample of the South African population in identifying an indigenous personality structure, the SAPI project has interrogated conventional notions about what personality represents (Barnes, 2018).
Next, a qualitative analysis was provided for the item clustering which formed the initial nine-factor structure of the SAPI. This served as the basis for developing a preliminary questionnaire to investigate the psychometric properties of the factors in the individual clusters (Hill et al., 2013). All of the questionnaire items representing the nine factors were translated from English into the remaining 10 official South African languages, which, according to Iliesco (2017), represent ‘. . . the simultaneous development of different-language versions of the tests’ (p. 6).
The simultaneous development of an assessment in multiple languages contributes to the development of a personality assessment representing the entire South African population. Its constructive implications include the following: (1) translation quality and comparability are addressed at the beginning of the project, (2) issues in instrument design and translation can be resolved early in the measurement development process, and (3) cross-national implementation will be more appropriate given the early detection of possible complications by examining the translated items as part of a quality check process (International Test Commission [ITC], 2019).
The SAPI went through a thorough process of refinement using substantive and psychometric criteria (Fetvadjiev et al., 2015; Hill et al., 2013) and concluded with a six-factor personality structure. The factors were labelled Conscientiousness, Extraversion, Neuroticism, Openness, Positive Social-Relational Disposition, and Negative Social-Relational Disposition. They consisted of 170 items and represented 20 facets (Fetvadjiev et al., 2015; Morton, Hill, Meiring, & de Beer, in press) The next step in the project was to determine the comparability of the English version of the SAPI’s (SAPI-E) factor structure across the four main ethnocultural groups in the South African context.
However, this article needs to address the nuances of South Africa’s diverse population. In the South African context, culture is generally defined along racial lines, as is also indicated in the EEA, although culture can also be equated with different languages (Laher & Cockcroft, 2013). It could be argued that the four main ethnocultural South African groups would be very distinct in their respective approaches to life. However, post-1994, acculturation has been noted between White South Africans and African South Africans, whereby the different groups absorb aspects of one another’s culture (Laher & Cockcroft, 2013). Ratele et al. (2018) also state that when establishing an Africa(n)-centred psychology, it is essential to acknowledge and value the shared and diverse experiences of the people being researched.
The initial SAPI dimensions were based on personality descriptors as relayed by South Africans who differed in terms of gender, ethnicity, language, age, and environment (urban vs rural) (Nel, 2008). It is therefore believed that the SAPI will prove to be comparable across ethnocultural groups. This was investigated by looking into the measurement invariance of the overall SAPI model using the English version of the instrument. Measurement invariance is said to exist when individuals from different language and ethnocultural groups that completed the model (in this case, the SAPI) understand, interpret, and respond to the same items and factors in a similar way (Meade & Wright, 2012; Milfont & Fischer, 2009; Reise, Widaman, & Pugh, 1993), and thus obtain scores that can be compared across groups (Schmitt & Kuljanin, 2008).
According to the ITC (2018), researchers should strive to ‘minimise the influence of any cultural or linguistic differences that are irrelevant to the intended use of the test in the population of interest’ (p. 10). This amounts to eliminating any factors that might prevent the instrument from measuring anything other than personality in different ethnocultural groups. This study aimed to investigate the configural (also referred to as structural or functional), metric (also referred to as measurement unit), scalar, and full invariance in the SAPI-E.
Configural invariance refers to the SAPI-E measuring personality in each of the four South African ethnocultural groups (He & van de Vijver, 2012), and whether these groups understand the structure and its constituents in a similar way (Riordan & Vandenberg, 1994). Configural invariance serves as the basis for making cross-cultural comparisons (He & van de Vijver, 2012).
Metric invariance relates to the SAPI-E having the same measuring units (response scales) but different origins (He & van de Vijver, 2012). Therefore, individuals from the four ethnocultural groups complete the same questionnaire, speak different languages, yet may conceptualise personality in a similar way. For example, two persons from the same ethnocultural group with the same score on extraversion can be taken to be equally extraverted, whereas the same conclusion could not be drawn if persons from different ethnocultural groups had the same score (all in the case of metric invariance).
Scalar invariance refers to a measuring instrument having similar origins and measurement units for each of the groups in focus (He & van de Vijver, 2012). Equal extraversion scores would then refer to the same standing on extraversion, both within and across ethnocultural groups.
Van de Schoot, Lugtig, and Hox (2012) indicated that testing for measurement invariance requires constrained structural equation models being analysed and inspected for significant differences. Exploratory factor analysis (EFA) and confirmatory factor analysis (CFA) models are most frequently chosen when researchers want to determine whether a latent construct (personality) in one culture is found to be similar to the same latent construct in another culture (van de Vijver & Poortinga, 1994). However, CFA has become the default method of analysis (Milfont & Fischer, 2009) as measurement invariance cannot be accurately examined when using traditional EFA models (Marsh, Morin, Parker, & Kaur, 2014).
In addition, researchers tend to examine the goodness-of-fit indices of the latent construct (Marsh et al., 2014) when assessing for measurement invariance. In recent years, exploratory structural equation modelling (ESEM) has gained popularity as a test of invariance (Asparouhov & Muthén, 2009). Marsh et al. (2014) identified ESEM as an innovative approach in psychological research as it integrates the techniques associated with EFA, CFA, and structural equation modelling (SEM), and has the potential to overcome the limitations inherent in an EFA model and the restrictions associated with CFA. ESEM has been found to be the best analysis method when working with a complex psychological model such as the SAPI-E (Morton, 2018). An ESEM procedure would allow all the facets in the SAPI-E to covary for researchers to determine whether the SAPI facets measure personality in each ethnocultural group. Using ESEM allows researchers to inspect a richer set of a priori models from which it is easier to evaluate the hypothesised psychological model in focus (Marsh et al., 2010). The analyses used in an ESEM model and its clear output makes it easier for researchers to determine the invariance of the measure and to assess the degree to which the groups in focus have similar standings on the latent construct of personality.
Method
Participants
The participants included tertiary students, job-seekers, and working adults from various industries in the South African labour market, operating at various levels in their organisations (N = 3202). Table 1 contains more details of the participants. Most of the participants were female (56%), with the African (21%) and White (35%) ethnocultural groups being well represented (Coloured and Indian ethnocultural groups represented fewer than 10% of the participants in the study). Most of the participants obtained qualifications after leaving school (74%) and rated themselves as having a very good English reading ability (78.5%).
Characteristics of the participants (N = 3202).

Instrument
SAPI-188-E
According to Fetvadjiev et al. (2015), the English version of the SAPI consists of six factors, 18 facets, and 146 items. 2 We added two facets: empathy (positive social-relational disposition) and arrogance (negative social-relational disposition), re-introducing these items from the existing SAPI item bank. These items were deemed relevant for the South African population, were also present in other personality inventories, and were insufficiently covered by other facets within the SAPI-E. Their addition aimed to cover personality more comprehensively. The final instrument used in this study, therefore, contained 170 items and 20 facets that represented the six SAPI-E factors. The questions are rated on a 5-point Likert-type scale with responses ranging from 1 (Strongly Disagree) to 5 (Strongly Agree).
Fetvadjiev et al. (2015) found Cronbach alpha coefficients ranging between .61 and .86 for the SAPI-E questionnaire that contained 18 facets. Studies that used the SAPI-E questionnaire containing 20 facets and 170 items generated Cronbach alpha coefficients ranging between .70 and .90 (Morton, Hill, & Meiring, 2018; Mouton, 2017) and McDonald’s omega coefficients ranging between .73 and .90 (Morton et al., in press).
Procedure
Using convenience sampling, we invited the participants to complete an online version of the SAPI-E. University students (post-graduate) were asked to complete the questionnaire as part of their programme, while participants working in companies were invited to follow the online questionnaire link posted on the CAREERS 24 website.
Ethical considerations
Prior to participation, all participating individuals were assured of (1) the questionnaire being used to collect information regarding personality only, (2) the security of the data being ensured, (3) the study incurring no psychological risk, (4) the research project results being kept confidential, and (5) the data being used in an aggregate manner and not individualised. Participants were asked to sign the online consent form before proceeding with the online questionnaire. The ethics clearance for the study was obtained from the relevant university.
Data analysis
Mplus Version 8.0 was used for data analysis (Muthén & Muthén, 1998–2017). An ESEM model was fitted to the facet data of the four main South African ethnocultural groups, establishing configural, metric, and scalar models. 3 While conducting the ESEM procedure, maximum likelihood estimation with robust standard errors (MLR) and an oblique target rotation were used for the analysis. In target rotation, loadings of items on their intended facets (Fetvadjiev et al., 2015) are maximised, whereas all loadings on non-target factors are minimised.
The model fit was investigated by inspecting the following fit indices: chi-square (Hu & Bentler, 1999), root mean square error approximation (RMSEA) (<.05–.08; Byrne, 1988; van de Schoot et al., 2012), standardised root mean square residual (SRMR) (⩽.10; Chen, 2007), Tucker–Lewis Index (TLI) (⩾.95; Bentler, 1990; van de Schoot et al., 2012), and the Comparative Fit Index (CFI) (⩾.95; Hooper, Coughlan, & Mullen, 2008; van de Schoot et al., 2012). It should be noted that, to conduct a chi-square difference test, the chi-square value for MLR (robust maximum likelihood estimation) cannot be used (Muthén & Muthén, 1998–2017). The Satorra–Bentler scaled chi-square difference test was used instead. The Satorra–Bentler statistic allows for a better approximate chi-square statistic for data that are not normally distributed (Dimitrov, 2010; Satorra & Bentler, 1994), with the Satorra–Bentler scaled chi-square difference test following a standard chi-square distribution and scaling the difference between two models (Dimitrov, 2010).
Furthermore, when testing for measurement invariance, the differences between the CFI values are inspected since Cheung and Rensvold (2002) found that the ΔCFI is a robust statistic for testing between-group invariance. Cheung and Rensvold (2002) and French and Finch (2006) stated that ΔCFI ⩽ –.01 is indicative of invariance. However, Chen (2007) indicated that ΔCFI needs to be interpreted in conjunction with the ΔRMSEA (⩾–.015) when testing for measurement invariance across more than two groups where the sample size across groups is ⩽300 and unequal. Van de Schoot et al. (2012) indicated that no preferred value exists for the Akaike information criterion (AIC) model; however, the model with the lowest value tends to be accepted as it yields the most parsimony of all tested models (cultural groups). Dimitrov (2010) suggested that, when examining all relevant fit indices, the possibility should be considered that an instrument could be partially invariant when all the parameters do not display perfect invariance but also do not display full inequality.
The unstandardised estimates of the model were reported, as standardised coefficients cannot be computed when measurement invariance testing is done with multiple models (Muthén & Muthén, 1998–2017). These authors indicated that inspecting these coefficients allows researchers to determine the amount of change the independent variable is responsible for in the outcome of the dependent variable, more generally referred to as regression analysis. In this study, the researchers inspected the contribution each facet makes to the respective factors and the extent to which one facet explains the underlying behaviours of a factor. Analysis was thus carried out at the facet level of the SAPI-E.
Results
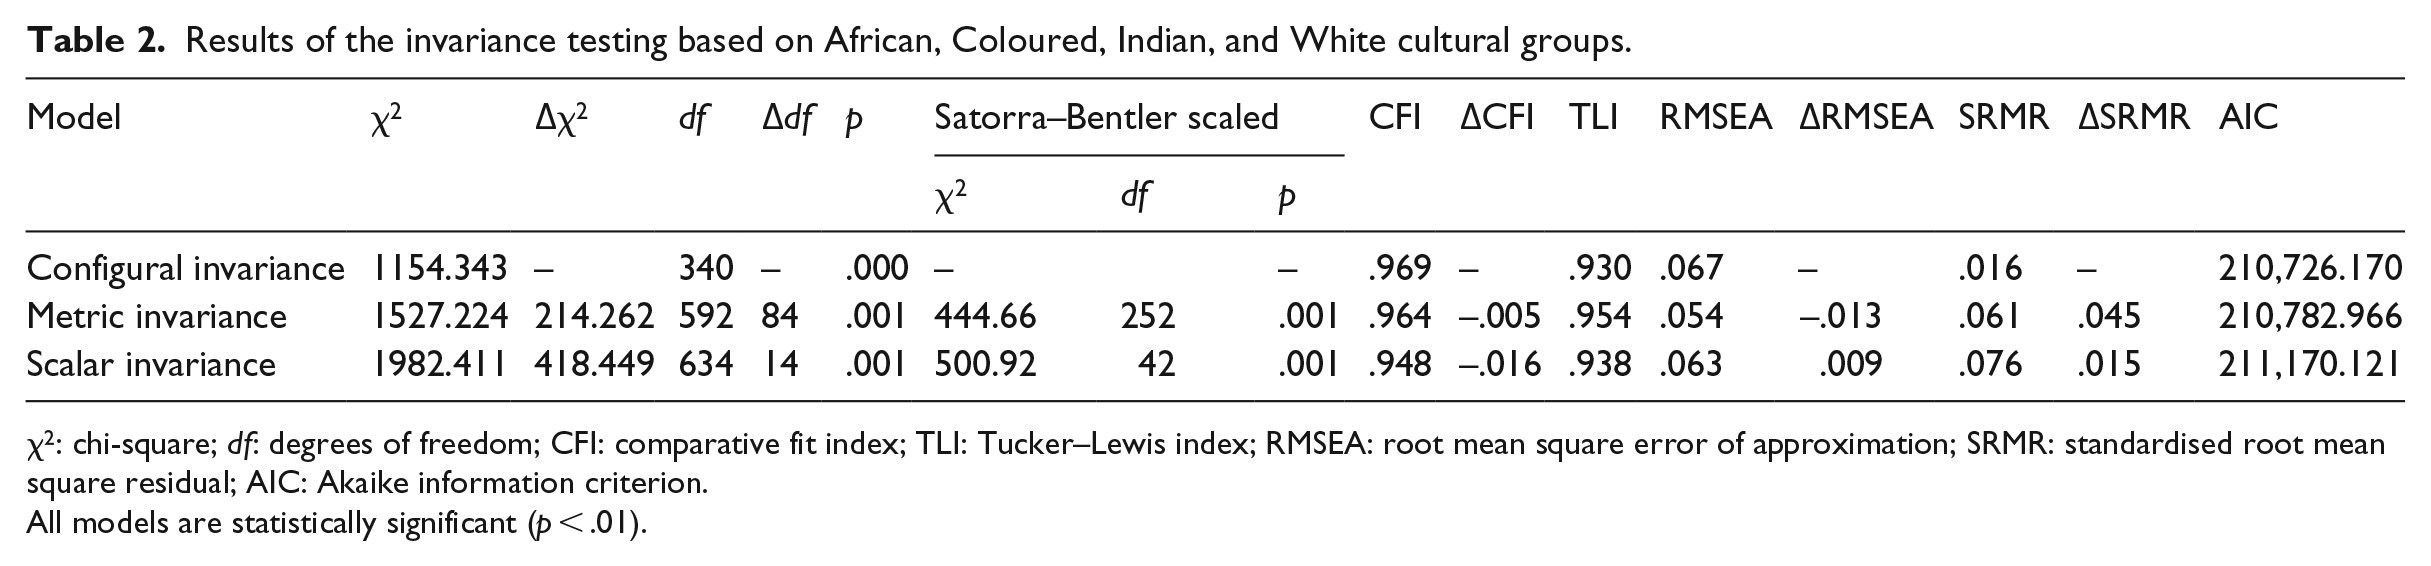
Measurement invariance was tested between the African (n = 669), Coloured (n = 199), Indian (n = 150), and White ethnocultural groups (n = 1127). The results of the three invariance levels for the respective ethnocultural groups are presented in Table 2.
Results of the invariance testing based on African, Coloured, Indian, and White cultural groups.
χ2: chi-square; df: degrees of freedom; CFI: comparative fit index; TLI: Tucker–Lewis index; RMSEA: root mean square error of approximation; SRMR: standardised root mean square residual; AIC: Akaike information criterion.
All models are statistically significant (p < .01).
In terms of configural invariance, the χ2 proved to be significant, which suggests that the data deviated significantly from the model. Various researchers noted, however, that sample size influences the χ2 and should, therefore, not be evaluated in isolation (Cheung & Rensvold, 2002; Dimitrov, 2010; van de Schoot et al., 2012). The goodness-of-fit statistics showed the presence of moderate configural invariance since χ2/df was 3.40 (the recommended cut-off < 5), CFI was ⩾.95, and the RMSEA and SRMR were ⩽.08, although the TLI was slightly less than .95. In conclusion, a configural invariance model was attained, indicating that the various groups link the same subsets of items with the same facets.
Since configural invariance was obtained across the four ethnocultural groups, the metric invariance of the model was assessed. Again, the χ2 proved to be statistically significant, as did the Δχ2. However, the χ2/df was 2.58, the CFI and the TLI were ⩾.95, the RMSEA ⩽ .06, and the SRMR ⩽ .08, which proved to be satisfactory. Evaluating the ΔCFI (.005) and the ΔRMSEA (.013) in conjunction, the change in both fit indices was greater than expected, serving as additional confirmation for metric invariance; the ΔRMSEA actually improves the metric invariance model compared to the configural invariance model. Thus, although the fit measures did not provide a consistent pattern (the SRMR and AIC supported the configural model whereas CFI, TLI and RMSEA and their related values suggested support for the metric model), the metric model seemed largely supported, suggesting that the factor loadings were equal across the groups.
The results for the scalar invariance test were similar to those of the metric invariance test since the χ2 was statistically significant; the significant change in the Satorra–Bentler scaling correction likelihood ratio test also substantiated that scalar invariance could not be upheld. While the χ2/df (3.13) was in the acceptable range of <5, not all of the delta goodness-of-fit indices were within the acceptable ranges. The ΔCFI was slightly above the cut-off score (ΔCFI was >.01), indicating that not all mean scores could be compared across groups. However, the change in RMSEA (<.010) actually supported scalar invariance. Therefore, for scalar invariance the two most important relative fit measures disagree: the ΔRSMEA points to scalar invariance, while the ΔCFI does not. The researchers could, therefore, not with confidence establish measurement invariance at the lowest level, and chose not to explore it further by freeing any of the parameters during analysis.
Table 3 reflects the unstandardised coefficients of the respective SAPI-E factors. Negative social-relational disposition (arrogance, b = 2.86; conflict-seeking, b = 3.03; hostility-egoism, b = 5.89), conscientiousness (achievement orientation, b = 3.39; orderliness, b = 5.44), and positive social-relational disposition (facilitating, b = 2.96; warm-heartedness, b = 3.06) were found to be the best represented factors in the SAPI-E model, having two or more facets explaining more than 30% of the factor, respectively. The remaining factors had only one dominant facet accounting for the most variance in the factor. Neuroticism was mostly explained by negative emotionality (b = 5.59), openness by broad-mindedness (b = 2.93), extraversion by sociability (b = 4.88), and conscientiousness by orderliness (b = 5.44). All computations were statistically significant (p < .01).
Model results of the SAPI factors for the metric model.

SAPI: South African Personality Inventory; SD: standard deviation; SE: standard error.
The biggest contributing facets for the respective factors are indicated in bold. All loadings and mean scores obtained are statistically significant (p < .01).
Discussion
The primary objective of the study was to establish measurement variance within the SAPI-E model by examining its configural, metric, and scalar invariance. The existence of invariance in a model is said to reflect the model’s replicability across the ethnocultural groups in focus, not favouring one culture above another, thus allowing researchers and practitioners to make unambiguous inferences and predictions about individuals (Meade & Wright, 2012; Milfont & Fischer, 2009; Reise et al., 1993; Schmitt & Kuljanin, 2008).
The Satorra–Bentler scales chi-square was used in the analysis to counter any problems that could have arisen from small samples and data not being normally distributed (Dimitrov, 2010; van de Schoot et al., 2012). All the values proved to be significant, indicating that the invariance models do not fit the data and that the SAPI-E ultimately contains bias. However, van de Schoot et al. (2012) found chi-square values to be dependent on sample size, resulting in the researchers having to inspect other indices or coefficients from the analyses instead of relying only on the scores produced by the χ2. The researchers determined the goodness-of-fit for each invariance level before inspecting the representativeness of each factor.
First, the configural invariance of the SAPI-E was inspected to establish whether the SAPI assesses the same personality constructs for all individuals in the South African context, irrespective of ethnocultural background. Despite the significance of the χ2, the goodness-of-fit indices proved that the SAPI model has configural invariance since the chi-square cannot be evaluated in isolation and is sensitive to sample size (Rutkowski & Svetina, 2014). The configural invariance demonstrates that individuals from different ethnocultural groups tend to ascribe the same meaning to personality characteristics exhibited in the South African context. Consequently, there is a high probability of similar behaviour patterns emerging among South African ethnocultural groups when referring to a particular SAPI factor. The Van der Bank (2019) study on configural invariance on the SAPI factors also demonstrated it for both males and females in South Africa.
Reviewing the metric and scalar invariance of the SAPI-E model yielded similar results to the configural model, with the χ2 being significant. However, as previously mentioned, the chi-square statistic is dependent on sample size, and researchers should thus evaluate the model-fit indices to assess the invariance of the model (van de Schoot et al., 2012). Acceptable model-fit indices were also found for the metric model, indicating that invariance has been obtained. The inference can thus be made that, with the different ethnocultural groups having a similar notion regarding the manifestation of personality, different scores on the various facets can be meaningfully compared across the ethnocultural groups (see Hong, Malik, & Lee, 2003).
In the scalar model, the ΔCFI and the TLI fell outside the range of acceptable values, indicating that scalar invariance is not present in the SAPI model. The lack of scalar invariance in the measurement instrument indicates that even though all the participants were asked to complete the same standardised questionnaire, individuals from different ethnocultural groups may have interpreted the items differently (Davidov, Meuleman, Cieciuch, Schmidt, & Billiet, 2014) because they might have reacted differently to the test items (Johnson, 1998). Item intercepts are therefore not equivalent across the four groups, implying that aspects such as developmental differences or cultural norms may affect participants’ responses to SAPI-E items (Bialosiewicz, Murphy, & Berry, 2013). A possible explanation could be that inherent cultural differences genuinely exist in the four main ethnocultural groups in South Africa (Eaton & Louw, 2000; Vogt & Laher, 2009).
Valchev et al. (2013) found evidence in their South African study for their hypothesis that ‘. . . Coloureds and Indians have an intermediate position between Whites and Blacks with respect to individualism–collectivism, and (that this position is) displayed in the characteristics of their personality descriptions’ (p. 1080). For example, individuals from individualistic cultures may differ from members of collectivistic cultures in the differing levels of emphasis they place on facets such as traditionalism-religiosity or negative emotionality (Davidov et al., 2014). Invariance analysis on item level to test for latent score invariances at the facet level might shed some light on this.
Van der Bank (2019) examined the measurement invariance of the SAPI across gender groups in South Africa and, similarly to this study, found the presence of configural and metric variance and a lack of scalar invariance. It can thus be expected that the SAPI may measure the same personality constructs in both ethnocultural and gender groups. However, there seems to be possible measurement bias within the SAPI, given that the items were understood differently by the ethnocultural and gender groups.
Given the obtained metric invariance, it was important to examine the SAPI-E factors in determining the representativeness of the model in the four main ethnocultural groups. Conscientiousness, negative social-relational disposition, and positive social-relational disposition appeared to best represented, indicating that South Africans tend to be ambitious and goal-driven while managing relationships in a positive manner and yet at times approaching relations with others more unfavorability. Fetvadjiev et al. (2015) found all six factors to be equally represented among the main ethnocultural groups; we confirmed their findings in a much larger sample.
However, there are some limitations to applying the above descriptions to the broader context of South Africa. The Indian and Coloured ethnocultural groups were underrepresented in the study, leaving the researchers with minimal data to analyse while having an incremental effect on the results. It is recommended that further studies be done to re-examine the invariance of the SAPI model, using stratified sampling methods to target the underrepresented groups, the guidelines proposed by Rutkowski and Svetina (2014), and the alignment-within-CFA (AwC) approach proposed by Marsh et al. (2018). Byrne and van de Vijver (2017), in their article titled ‘The maximum likelihood alignment approach to testing for approximate measurement invariance: A paradigmatic cross-cultural application’ in Psicothema, stated that The impracticality of using the confirmatory factor analytic (CFA) approach in testing measurement invariance across many groups is now well known. A concerted effort to addressing these encumbrances over the last decade has resulted in a new generation of alternative methodological procedures that allow for approximate, rather than exact measurement invariance across groups. (p. 539)
It is therefore suggested that in future studies, the SAPI uses Byrne and van de Vijver’s proposed method of testing for approximate measurement invariance using the novel technique of alignment when examining measurement invariance in a unique setting like South African where ethnocultural differences may cause a lack of invariance.
Conclusion
While South African modern-sector psychologists (regardless of ethnocultural background) are attracted to the psychological approaches of the Western world, the need remains for them to engage critically with their local culture in order to establish a psychological episteme that is applicable in the South African context (Dawes, 1998; Mashegoane, 1998), and as such will not simply replace ‘. . . Western individualisms with notions of persons and self in cultural contexts . . .’ (Makhubela, 2016, p. 5). Using an etic-emic approach during the development of the SAPI, therefore, complies with the call to avoid substituting one viewpoint and understanding of personality with another, but rather to use a marriage between universal and more culture-specific models of personality (Cheung et al., 2011). However, an important part of developing an indigenous assessment is to investigate to what extent the scores obtained in the SAPI can be compared across the ethnocultural groups that were used during its development.
This study showed configural and metric invariance for the groups whereas scalar invariance was not achieved. The lack of scalar invariance implies that the four ethnocultural group differences in the means of the SAPI items may not originate from variations in the means of the SAPI facets and factors. It is therefore possible that measurement bias exists in the SAPI. However, since Byrne and van de Vijver (2017) maintain that contrasting a large number of groups’ latent means is becoming progressively more difficult in cross-cultural settings, it will be expedient to analyse the SAPI using the approximate invariance approach of alignment.
Footnotes
Acknowledgements
The authors thank Dr Velichko Fetvadjiev, Prof Leon de Beer, Prof Pieter Schaap, and Prof Callie Theron for their expert advice.
Dedication
The authors want to dedicate this article in honour of one of the co-authors, Prof Fons van de Vijver, who sadly passed away on 1 June 2019 while this article was under review. Prof Fons van de Vijver has been a main collaborator in the South African Personality Inventory (SAPI) since 2005 and made significant contributions towards the project. His wisdom and guidance will be greatly missed.
Funding
The authors disclosed receipt of the following financial support for the research, authorship, and/or publication of this article: Herewith a formal acknowledgement of the research funding was provided by the National Research Foundation (NRF) (grant no. 111764). The conclusions derived and opinions expressed are those of the authors and should not be ascribed to the NRF.
