
Abstract
Forensic practitioners are regularly called on to conduct highly consequential evaluations of risk for recidivism and violence. Accordingly, numerous specialized risk assessment measures have been developed to evaluate an array of relevant variables. As one conceptual approach, the Psychological Inventory of Criminal Thinking Styles (PICTS) assesses criminal thinking as a dynamic criminogenic need with predictive validity beyond historical factors. Because of its high reading level, however, a simplified version (PICTS-SV) was recently developed. The current investigation sought to (a) examine the two versions’ direct concurrence and (b) test the PICTS-SV’s vulnerability to risk minimization (RM). Two separate studies recruited 150 participants from a court-mandated substance use treatment facility. Study 1 established the PICTS-SV’s concurrent validity with the PICTS, especially at the composite level. Study 2 observed its robust resistance to RM distortion, although some validity scale revisions appear warranted. Overall, these results support the PICTS-SV’s utility for informing effective interventions and accurate risk determinations.
Within the realm of criminal forensic practice, psychologists are often expected to evaluate the future risk for recidivism and violence. These decisions are arguably among the most consequential for both evaluees and their communities to ensure appropriate treatment, management, and sentencing (Desmarais, Johnson, & Singh, 2016; Taxman, Rhodes, & Dumenci, 2011). Classification errors pose serious negative ramifications for legally involved individuals regarding either unnecessary confinement or premature community release. Accordingly, risk assessment measures have undergone extensive development and research (Andrews, Bonta, & Wormith, 2006; Douglas, Cox, & Webster, 1999; Singh et al., 2014). Yet, debate remains about the utility and validity of different approaches (e.g., clinical judgments vs. statistical predictions, static vs. dynamic risk factors; Ægisdóttir et al., 2006; Andrews et al., 2006; Desmarais et al., 2016; Finch, Gilligan, Halpin, & Valentine, 2017; Meehl, 1954; Singh, Grann, & Fazel, 2011).
Approaches to Risk Assessment
Traditionally, determinations of risk were based on unstructured clinical judgments relying largely on professional experience (Meehl, 1954). However, the 1980s saw a shift in response to a growing call for empirically supported risk assessments in forensic and clinical contexts. Reflecting this shift in focus, several large-scale longitudinal investigations (e.g., the MacArthur Risk Study; Monahan et al., 2001) began to identify relevant risk factors and develop accompanying specialized assessment measures. Such research resulted in a wide variety of actuarial (statistically based) and structured professional judgment (based on standardized clinical ratings) assessment methods, which have increased the reliability and predictive validity of risk determinations (Douglas et al., 1999; Singh et al., 2011).
Risk-relevant predictors are often subdivided conceptually into two categories—static and dynamic—both of which may be incorporated into risk determinations. Static factors represent unchangeable data based on historical information that may be reported by evaluees or obtained from record review. Numerous highly robust static predictors of criminal recidivism have been identified, including gender, age, and criminal history (e.g., prior arrests, past incarcerations, and type of crime or victim; Monahan et al., 2001). In contrast, dynamic factors include individual characteristics or behaviors that are subjected to change. Examples include successful treatment participation and increased homicidal ideation, either of which likely reflects a concomitant change in risk level (Douglas & Skeem, 2005). Proponents of a shift toward focusing on dynamic variables (e.g., Andrews & Bonta, 2010; Nonstad et al., 2010) emphasize that modifiable criminogenic needs provide guidance for intervention and risk management that static variables cannot. Confirming their practical utility, meta-analytic findings (Bonta, Blais, & Wilson, 2014; Gendreau, Little, & Goggin, 1996) show these dynamic factors are as strongly associated with recidivism and outcome as historical clinical variables.
Antisocial cognitions represent an important dynamic risk factor which has particularly interested practitioners and researchers alike, due to its suitability to intervention through cognitive behavioral approaches (Walters, 2009). At a broad level, antisocial cognitions comprised attitudes, beliefs, and values that support a criminal lifestyle. These cognitions are often aligned with emotions of anger and defiance that contribute to the development of a criminal identity (Andrews & Bonta, 2010). Yochelson and Samenow’s (1976) seminal model of criminal thinking identified 52 “thinking errors” (e.g., lack of empathy, concrete thinking, possessiveness of others, and fear of fear), which they believed reflected reliable differences in the ways that individuals who do and do not commit criminal offenses rationalize their actions.
Building on Yochelson and Samenow’s (1976) work, Walters (1990) outlined a two-dimensional model of proactive and reactive criminal thinking, which consists of eight distinct thinking style sub-factors. Proactive thinking drives planned and purposeful harm motivated by gain, whereas reactive thinking is distinguished by more impulsive and emotionally driven actions. Walters (1995a) subsequently developed the Psychological Inventory of Criminal Thinking Styles (PICTS) to empirically assess these constructs.
Evaluating Criminal Thinking With the PICTS
As research has consistently demonstrated, the PICTS adds predictive validity over and above traditional static risk factors in prison (e.g., Walters, 2012b), jail-based substance use treatment (e.g., Scott, Grella, Dennis, & Funk, 2014), and community-supervised probation (e.g., Walters & Lowenkamp, 2016) samples. Outside of prison settings, PICTS scores have also been shown to predict institutional and community adjustment (Walters, 2002). More generally, a meta-analysis by Walters (2012a) illustrated that the overall General Criminal Thinking (GCT) score incrementally predicts recidivism (M odds ratio = 1.27), even after robust historical predictors (i.e., age and criminal history) were partialed out. Although the observed effect sizes are typically modest in size, their incremental validity contributes important information to high-stakes risk assessment decisions.
Clinically, targeting criminal cognitions as a dynamic risk and criminogenic needs factor aligns well with the Risk–Needs–Responsivity (RNR; Andrews & Bonta, 2010) model widely implemented in forensic settings (Brooks Holliday, Heilbrun, & Fretz, 2012). Cognitive behavioral interventions can be targeted toward those with high levels of criminal thinking to modify maladaptive cognitions and increase reasoning skills, presumably resulting in a decreased risk of reoffending. As a result, directly addressing criminal thinking patterns has become an increasingly common component of interventions in forensic settings, including the Federal Bureau of Prisons’ residential substance use programming (Pelissier et al., 2001). Different patterns of initial criminal thinking (e.g., higher reactive versus proactive scores) can also help to inform treatment strategy, such as by guiding clinicians to emphasize behavioral management strategies to decrease impulsivity for an individual high in reactive criminal thinking (Varghese, Charlton, Wood, & Trower, 2014).
A serious methodological oversight in the development of the PICTS centers on its high reading requirement of a 9th grade reading level (Walters, 2002). This level far exceeds many adult detainees’ limited literacy (i.e., 68% perform in the two lowest literacy levels; see the National Adult Literacy Survey; National Center for Education Statistics, 1994). Moreover, Walters (2014) openly acknowledged the negative effects of limited education—presumably constrained by poor reading comprehension—on the PICTS’ predictive validity.
Disabato and colleagues (2016) addressed the challenging reading level of the PICTS through Lexile analysis to develop a PICTS–Simplified Version (PICTS-SV). The PICTS-SV maintains comparable item content at a markedly lower reading level, with a Flesch–Kincaid grade level of 5.5 compared with the original’s 8.5. As expected, Disabato et al. found the PICTS-SV produced a similar bifactor structure to the original PICTS in their initial validation. Clearly, the next step involves a direct comparison of the PICTS and PICTS-SV in a forensic sample.
Deception and Risk Assessment
In high-stakes contexts such as sentencing evaluations, some examinees may be strongly motivated to appear nondangerous when administered risk assessment measures. This response style involving simulated adjustment is referred to here as risk minimization (RM). The motivation for RM is clearly understandable from evaluees’ perspective in reducing what they view as restrictive—if not punitive—actions. For those already detained, early release may be the primary motivator (Edens, Buffington, Tomicic, & Riley, 2001; Edens & Ruiz, 2006; Gillard & Rogers, 2015; Walters, 2006).
Risk assessments are often perceived as relatively immune to response distortion due to the inclusion of record review (Knight, Simpson, & Hiller, 2002). Yet, there are little empirical data to support this assumption. Rather, the limited available research (Gillard & Rogers, 2015; Rogers, 2018) indicates that risk assessments, like virtually all psychological measures, are susceptible to positive impression management. The collateral data provided by records are undoubtedly useful; however, records are often incomplete or rely on questionable sources that may constrain their usefulness (Dyck, Campbell, & Wershler, 2018; Gillard & Rogers, 2015). Moreover, some of the risk factors clinicians evaluate such as criminal attitudes and treatment motivation are, by their very nature, subjective and require self-report (Walters, 2006).
The effects of RM on risk-relevant measures is rarely investigated empirically (Edens et al., 2001; Gillard & Rogers, 2015; McEwan, Davis, MacKenzie, & Mullen, 2009). Initial investigations provide strong evidence that inmates engaging in RM can markedly decrease their report of numerous risk factors, including antisocial traits (Edens & Ruiz, 2006) and psychopathic features (Edens et al., 2001; Kelsey, Rogers, & Robinson, 2014; Rogers et al., 2002). In addition, examinees can suppress related issues, such as anger management problems (McEwan et al., 2009) and substance use (Knight et al., 2002). The effects of RM are highly consequential, because they can completely invalidate predictive validity (Edens & Ruiz, 2006; McEwan et al., 2009).
Gillard and Rogers (2015) conducted the only systematic evaluation of RM utilizing both interview and self-report risk measures with an inmate sample. Using a within-subject experimental design, participants dramatically decreased risk scores (Total d = 1.20) on the interview-based Historical–Clinical–Risk Management-20 (HCR-20; Douglas, Hart, Webster, & Belfrage, 2013), the most commonly used structured professional judgment measure (Singh et al., 2014). In stark contrast, the PICTS was comparatively less susceptible to RM for the total score (GCT d = 0.61) and individual thinking style scales (range = −0.10 to 0.76). Gillard and Rogers (2015) concluded that the PICTS was less susceptible to positive impression management than other risk-relevant measures, potentially because thinking styles content is less face-valid to examinees. Similar work is needed for the PICTS-SV to determine its effectiveness with RM.
Objectives of the Current Investigation
A critically important issue is whether the PICTS’ well-established validity and clinical utility are retained by the PICTS-SV. Toward this end, the current studies investigate two important aspects of the validity of the PICTS-SV. Study 1 examines the concurrent validity of the PICTS-SV (Disabato et al., 2016) with the PICTS. As the distinct focus of Study 2, the simplified language of the PICTS-SV raises several core questions regarding the potential for response distortion that would negate the validity of responses. As noted, the original PICTS has shown relative resistance to RM (Gillard & Rogers, 2015), a major benefit for practitioners evaluating risk-relevant factors. Do the PICTS-SV’s easily understood items increase their transparency, making it easier to suppress scores under RM simulation conditions? With the ultimate clinical goal of accurate risk classification, are participants who are able to meaningfully reduce their GCT score (i.e., ≥10T) successfully detected by the embedded Defensiveness–revised (Df-r) validity scale? These questions highlight important concerns for the PICTS-SV’s practical application.
Common Methods for Study 1 and Study 2
Participants
All participants were recruited from a court-mandated residential substance use treatment facility in Texas. Recruitment for the two studies was conducted separately, with no overlap in participants. Diversion to the treatment facility typically occurs through a rehabilitation court when an individual is facing drug-related charges or is referred for substance use treatment while on probation. Very high prevalence rates of substance use are seen in forensic settings (Karberg & James, 2005; Mumola & Karberg, 2006), making this an important clinical sample. To maximize the representativeness of the sample, only minimal inclusion criteria were utilized. All individuals 18 years or older and who spoke and read English fluently were eligible to participate. The procedures and measures differed between Study 1 and Study 2 and are outlined below in separate sections.
Measures
PICTS
The PICTS is an 80-item multiscale inventory rated on a 4-point Likert-type scale: 1 = disagree, 2 = uncertain, 3 = agree, and 4 = strongly agree. Scores produce a total GCT score, as well as two higher order scales of Proactive (P) and Reactive (R) criminal thinking (Walters, 1995a). Eight thinking style subscales comprised Mollification (Mo), Cutoff (Co), Entitlement (En), Power Orientation (Po), Sentimentality (Sn), Superoptimism (So), Cognitive Indolence (Ci), and Discontinuity (Ds). In addition, two validity scales (Confusion–revised [Cf-r] and Defensiveness–revised [Df-r]) and one special scale (Fear of Change [FOC]) are scored. Based on factor and content analyses, four supplemental scales (Problem Avoidance [PRB], Infrequency [INF], Self-Assertion/Deception [AST], and Denial of Harm [DNH]) and two general content scales (Current Criminal Thinking [CUR] and Historical Criminal Thinking [HIS]) are also calculated. For interpretation, the manual provides gendered T-score conversions normed on a sample of 450 male federal prison inmates and 227 state and federal female prison inmates (Walters, 2010).
The PICTS exhibits overall satisfactory reliability, with marginal-to-excellent internal consistency (αs = .55 to .93) and good-to-excellent test–retest reliability (rs = .73 to .96; Walters, 2002). Factor analytic examination confirms the construct validity of the PICTS’ superordinate GCT score, as well as of the proactive and reactive factors (see Walters, 2010). Walters’ (2002) psychometric review illustrates the PICTS scales’ convergence with other measures of criminality as well as criminal history indicators (e.g., number of prior arrests and age at first arrest). Moreover, the PICTS consistently shows incremental predictive validity beyond that explained by common static predictors (Walters, 2002, 2012a; Walters & Cohen, 2016).
PICTS-SV
The PICTS-SV reading level was reduced from a Flesch–Kincaid grade level of 8.5 to 5.5 while maintaining all item content, allowing for the calculation of all equivalent scale scores (Disabato et al., 2016). As an example, Item 16 was reworded from the original version, “I am uncritical of my thoughts and ideas to the point that I ignore the problems and difficulties associated with these plans until it is too late” to “I do not stop and think about the problems I could cause until it is too late.” The Likert-type scoring remains the same, except that the description of a “2” was simplified from uncertain to not sure. In the present sample, the PICTS-SV exhibited overall acceptable reliability comparable to that seen for the original version (αs = .56 to .94). For construct validity, the PICTS-SV showed a similar bifactor structure to the PICTS, with distinct proactive and reactive criminal thinking factors contributing to a superordinate GCT score (Disabato et al., 2016).
Study 1
Procedure
For this initial study, a within-subject approach was used to examine the concurrent validity of the PICTS-SV with the original PICTS. This relationship was evaluated for the total score, higher order scales, and thinking style scales. For recruitment, the study was announced in the common areas of the facility and any interested individuals were invited to participate. Participants completed both versions of the measure, counterbalanced to combat order effects, in a small group format. Afterwards, demographic information was collected. Participants were given time to ask any questions and offered a baked good to thank them for their participation.
Results and Discussions
To refine the sample, four individuals were removed for missing too many items (e.g., accidentally skipping an entire page). In addition, Walters (2010) provides cut-score recommendations to identify invalid protocols. Accordingly, participants were excluded from further analyses if they produced a PICTS Cf-r score > 81T (n = 4) or a Df-r score > 65T (n = 5). 1 This produced a final sample of 77.
Overall, the sample was predominantly male (58.4%). Approximately half of participants self-identified as European American (49.3%), with most others identifying as Hispanic American (28.0%) or African American (16.0%). The majority (56.2%) were not high school graduates, reporting on average having completed the 11th grade (M = 11.26 years, SD = 1.80, range = 6-16). While currently placed in a residential treatment facility, participants also acknowledged a significant history of other arrests and institutionalizations. Reported legal involvement included an average of 6.00 prior arrests (SD = 5.16, range = 1-21) and a total of 18.75 (SD = 22.94, range = 0-120) months spent incarcerated. In contrast, participants reported relatively fewer experiences with psychiatric intervention: 28.6% disclosed previous hospitalization for substance use treatment (range = 1-10) and 15.6% for mental health treatment (range = 1-4). Extensive hospitalization histories were rare, with only a single previous hospitalization being the most common for both substance use (40.9%) and mental health (41.7%) treatment.
As noted in the introduction, the PICTS has shown reduced predictive validity for inmates with limited education and presumably lower levels of reading comprehension (Walters, 2014). Reading comprehension data were not available for participants, so education level was utilized as a proxy to first investigate potential differences in concurrent validity. Presumably, the reduced reading requirement of the PICTS-SV would be expected to most affect the comprehension of examinees with lower reading levels, resulting in less alignment in responses across versions. However, no significant differences in scores were seen between examinees who were high school graduates (n = 32) and those with less than 12 years of education (n = 41) on the original or simplified PICTS, nor did any consistent pattern of differences in the strength of concurrence emerge. As a result, concurrent validity analyses included the full sample. The lack of group differences was likely affected by the low variability in education levels observed for the present sample. That is, approximately two-thirds (65.7%) reported having completed either 11 or 12 years of school. With such a tightly clustered distribution of education levels, large differences are unlikely to emerge. Further investigation utilizing reading comprehension levels would permit a more thorough exploration of this important question.
It was anticipated that the PICTS-SV would demonstrate concurrent validity with the original PICTS. As illustrated in Table 1, the observed bivariate correlations strongly support this hypothesis, with all Pearson’s rs > .70 except for INF (r = .66). Especially strong relationships were found for the P (r = .83), R (r = .89), and GCT (r = .90) higher order scales, consistent with expectations that their larger size and scope produce more stable scores than the individual thinking style scales. Since practitioners are encouraged to interpret composite scores first (Walters, 2010), this pattern is particularly encouraging in demonstrating the concurrent validity of the PICTS-SV. Within the thinking style scales, subscales associated with reactive criminal thinking (M r = .83, range = .83-.84) overall yielded slightly stronger and more consistent convergence than those aligned with the proactive thinking factor (M r = .80, range = .73-.87).
Bivariate Correlations Between Corresponding PICTS and PICTS-SV Scales Compared With PICTS Test–Retest Correlations
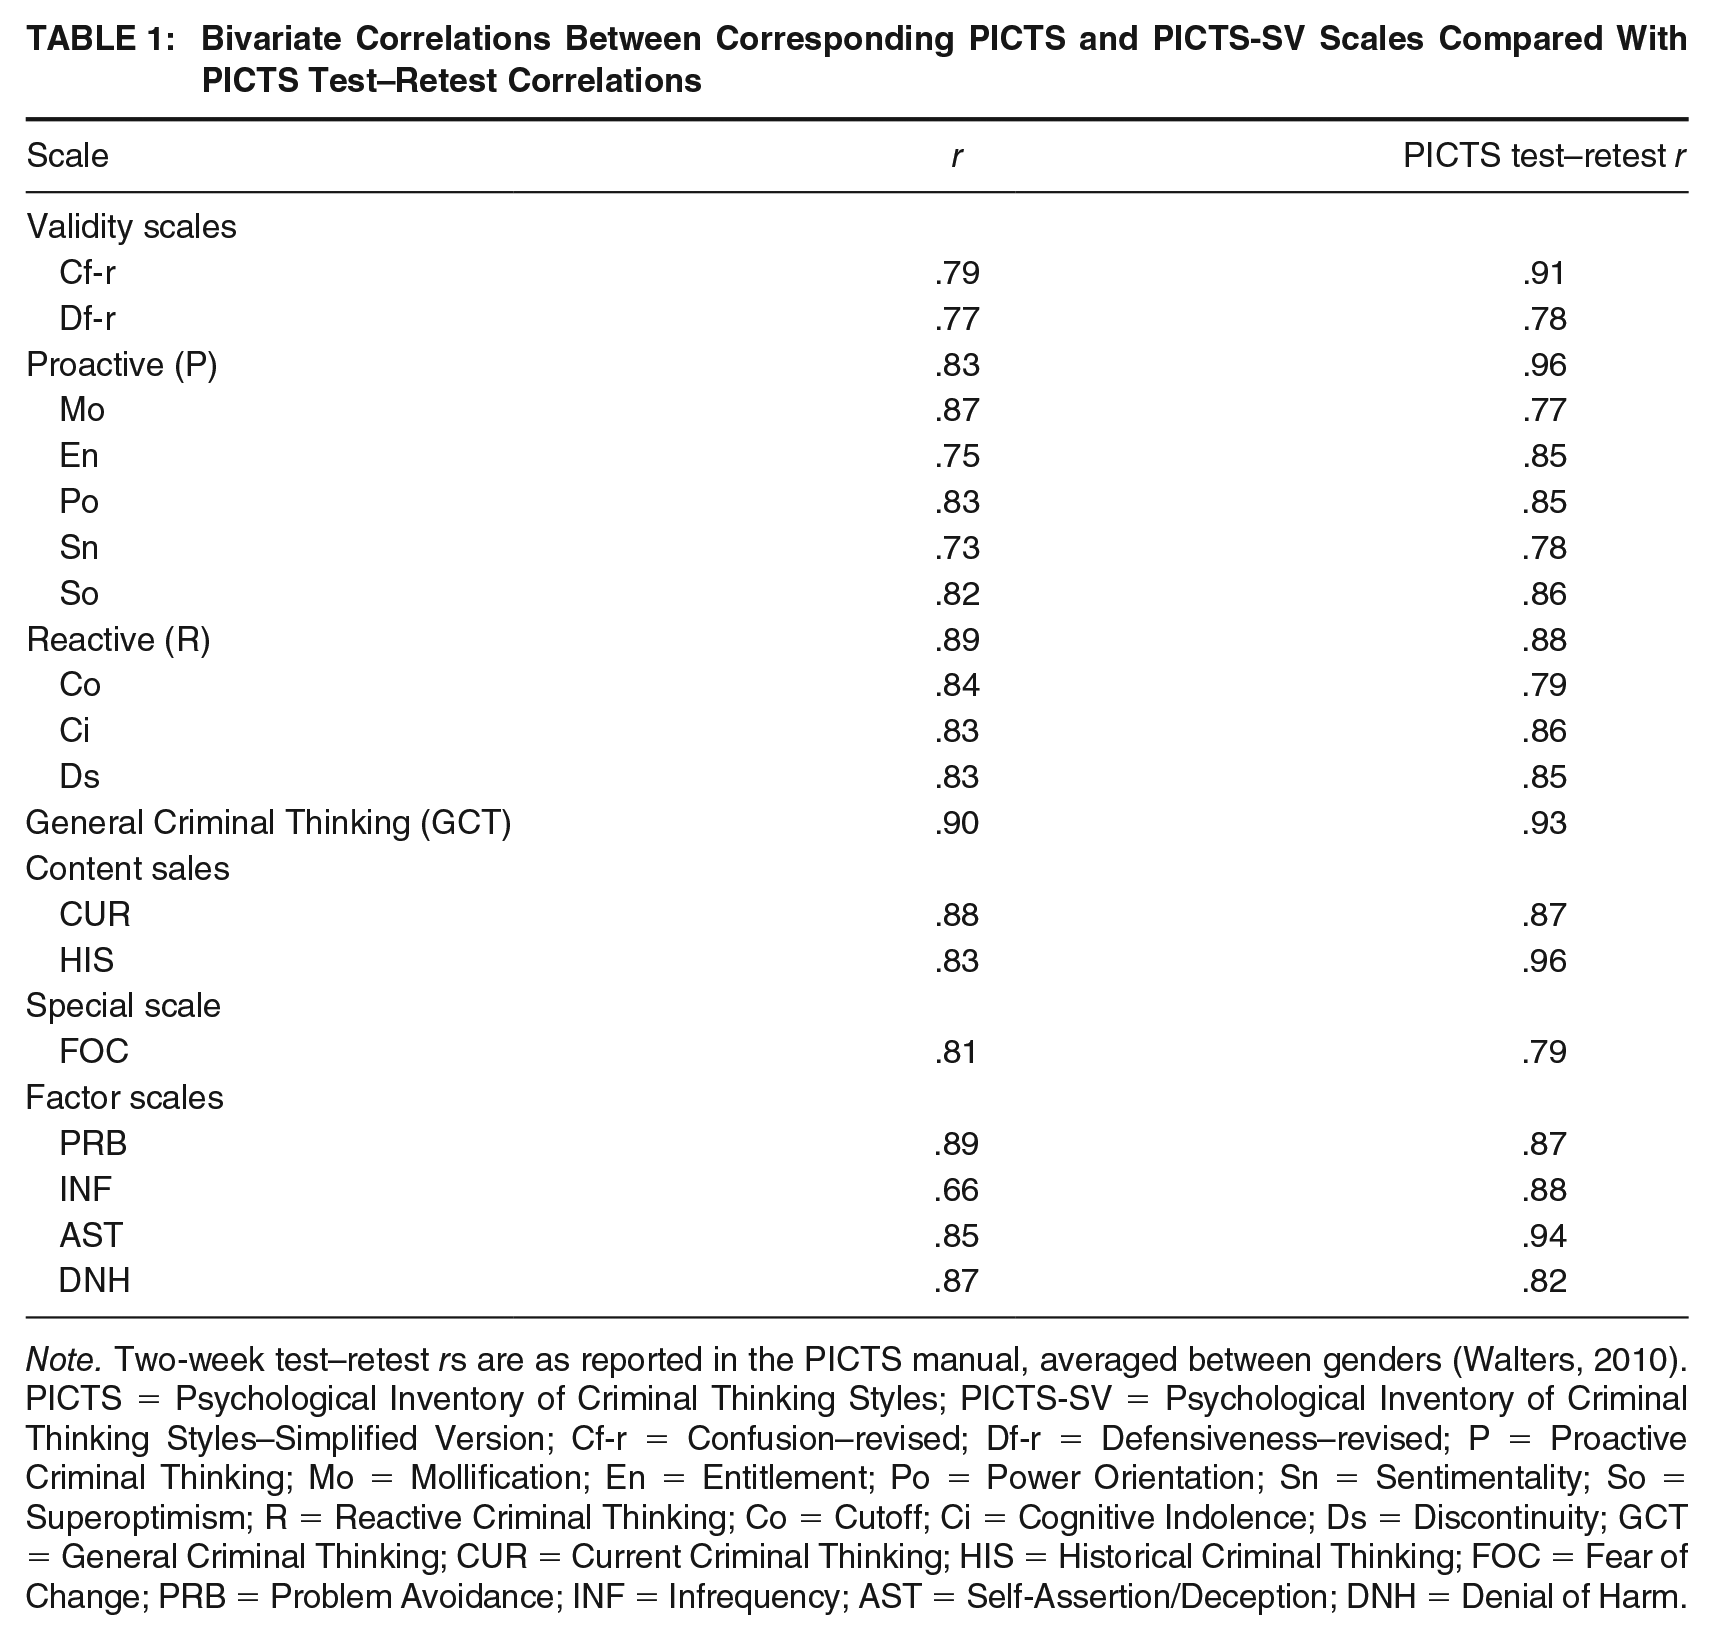
Note. Two-week test–retest rs are as reported in the PICTS manual, averaged between genders (Walters, 2010). PICTS = Psychological Inventory of Criminal Thinking Styles; PICTS-SV = Psychological Inventory of Criminal Thinking Styles–Simplified Version; Cf-r = Confusion–revised; Df-r = Defensiveness–revised; P = Proactive Criminal Thinking; Mo = Mollification; En = Entitlement; Po = Power Orientation; Sn = Sentimentality; So = Superoptimism; R = Reactive Criminal Thinking; Co = Cutoff; Ci = Cognitive Indolence; Ds = Discontinuity; GCT = General Criminal Thinking; CUR = Current Criminal Thinking; HIS = Historical Criminal Thinking; FOC = Fear of Change; PRB = Problem Avoidance; INF = Infrequency; AST = Self-Assertion/Deception; DNH = Denial of Harm.
As the single exception, INF showed only moderate concurrence (r = .66) between the two versions. This pattern is interesting given the development of the INF scale, which includes items rarely endorsed by genuine respondents and is interpreted as reflecting “either extreme hostility towards others or a careless, confused, and perhaps even a ‘fake bad’ response style” (Walters, 2010, p. 56). The expected low rates of endorsement were generally seen in the present investigation, with all but three of the items marked “disagree” by more than 75% of examinees. The largest discrepancy emerged for item 41, which was denied by 76.6% of respondents on the PICTS compared with only 58.4% on its PICTS-SV equivalent. The change in reading level from the original (Flesch–Kincaid = 8.2) to the simplified (5.1) item illustrates a potential explanation for this change that may account for the scale’s lower concurrence. That is, certain simplified items may be less confusing to respondents or be interpreted differently, leading to higher rates of endorsement. Although no significant difference was seen in INF concurrence for high school graduates versus nongraduates in this sample (z = 0.55, p = .29), analyses based on reading comprehension levels would be needed for a more nuanced investigation of this potential explanation. Future factor analytic investigation in a larger sample may be warranted to create a revised PICTS-SV INF scale based on new typical patterns of endorsement. Moreover, the relatively lower concurrence (rs < .80) seen across the validity scales may suggest a need more broadly for modifications to the criteria used to determine whether a PICTS-SV protocol is valid.
To further contextualize the scales’ correspondence, Table 1 also lists the 2-week test–retest reliability rs for the PICTS (Walters, 2010, p. 19) so that PICTS versus PICTS-SV comparisons can be contrasted with PICTS administered twice. The correlations obtained for the PICTS-SV with the original version are largely comparable or even superior to those for repeated administration of the PICTS, particularly for scales related to reactive criminal thinking. Although strong relationships were seen between the PICTS-SV and PICTS versions of P (r = .83) and HIS (r = .83), they did not attain the near-perfect levels of test–retest reliability reported for the PICTS (rs = .96). Within the domain of proactive thinking, En’s correlation was also notably lower than its reported test–retest reliability. Participants’ comprehension of the items associated with proactive thinking scales may have been more varied, leading to lower rates of endorsement on the simplified version. In this case, some differences in scores would be expected for examinees with low literacy, highlighting the need for a simplified version.
Of note, females tended to produce stronger correlations than their male counterparts on multiple scales. In particular, the En thinking style scale’s moderate concordance (r = .56) among males starkly contrasted that seen for females (.85). The supplementary INF factor scale also evidenced weaker concordance for males (.52) than for females (.75). Pending replication, these results suggest the need for gender-specific modifications in interpretation for these scales. An alternative hypothesis is that these patterns reflect the impact of the PICTS-SV’s simplified reading level. That is, improved comprehension may have prompted changes in endorsement across measures, particularly among male examinees.
Taken together, these results provide strong initial support for the concurrent validity of the PICTS-SV with the PICTS, particularly at the composite scale level. More variation between measures and across genders was observed at the thinking style level; therefore, examiners are encouraged to prioritize interpretation of the higher order composite scales, which produce the most stable data (Walters, 2006, 2010). This investigation provides compelling data that examinees who complete the simplified version will produce generally equivalent composite scores that evaluators can utilize in treatment planning and risk management.
Study 2
Procedure
The second study utilized within-subject analyses to compare participants’ honest baseline report on the PICTS-SV with their responses under RM simulation conditions to determine its vulnerability to distortion. Again, participants were recruited through announcements in the common areas, and any interested individuals were invited to participate. Measures were administered individually. 2 With regard to the measure of interest, participants first completed the PICTS-SV under honest conditions to avoid potential confusion about responding honestly after exposure to the simulation. Participants were then given the RM instructions. They were asked to paraphrase the scenario to ensure comprehension and given an opportunity to ask any questions before completing the PICTS-SV a second time under RM conditions. Upon completion, a manipulation check was administered to ensure adherence with the simulation instructions. Demographic information was then collected and participants were offered a baked good to thank them for their participation.
Materials
Honest Condition
Participants were given the following instructions prior to beginning any study measures to encourage accurate reporting for criminal thinking: Please respond to all of the following questions openly and honestly. Remember, this information will not have your name on it. It cannot be connected to you. It is for this study only. For this research, it is important that you show us who you really are.
Simulation Condition
Detailed RM instructions were developed to enhance examinee involvement. The reading level for the simulation is 5.6, comparable to that of the PICTS-SV. Instructions asked participants to minimize or deny risk and were modeled after prior simulation research on positive impression management in correctional settings (e.g., Gillard & Rogers, 2015; Kelsey et al., 2014). Consistent with recommendations (Rogers & Gillard, 2011), the simulation scenario contains fundamental components including relevant and plausible context, connections to real-world application, and a caution to “be believable” to minimize extreme responding. Specifically, participants were told the following: Imagine that you hurt someone badly in a fight. You have already been found guilty of aggravated assault. Now the court will decide your sentence. First, a sentencing evaluation will be done. If the report says you are dangerous and will probably be violent again, you could be sentenced to prison for 5 to 10 years. You want to look like a safe, non-violent person so you can get a shorter sentence. You might get only probation. Please pretend this is a sentencing evaluation. How can you downplay or hide your criminal traits and thoughts? How can you look like a calm, non-violent person? Can you hide any risk for future crime? Keep in mind that if you seem “too good to be true,” the psychologist will think that you are lying. Then you will get an even longer sentence. Please be believable when answering the questions, even though you will be hiding some things. For example, you might try to admit to small problems but hide the big ones.
Manipulation Check
After completing the study, a manipulation check was administered to confirm free-recall comprehension of the RM instructions and assess self-reported level of effort on a 10-point scale (i.e., “1” meaning they “did not try at all” to follow the instructions and “10” meaning they “tried [their] hardest”). Respondents’ data were excluded from analyses if they (a) failed to accurately recall basic details of the scenario or (b) reported exerting poor to marginal effort (i.e., ratings less than 5).
Results and discussions
Prior to analyses, two participants were removed as a result of the manipulation check. Specifically, one examinee reported inadequate effort on the simulation (i.e., “4” on a scale of 1-10), and another inaccurately recalled the simulation instructions. After these exclusions, the final sample consisted of 73 participants.
The demographic makeup of Study 2 closely mirrored that of Study 1. A majority of participants were males (54.8%) who had not completed high school (M = 11.40 years, SD = 2.43, range = 6-18) and self-identified primarily as European American (38.4%), Hispanic American (31.5%), or African American (19.2%). However, Study 2’s sample overall endorsed moderately more extensive legal involvement than participants in Study 1. To illustrate, participants reported an average of 11.14 (SD = 13.70, d = 0.50) prior arrests with wide variability, with most (56.2%) reporting fewer than 10 arrests, whereas 2.8% disclosed an extremely high number (i.e., >50). The typical participant had spent 33.14 (SD = 42.54) months incarcerated, with a large range from 1 month to more than 20 years. As with Study 1, though, a history of clinical intervention remained much less common. Approximately one-quarter (27.4%) endorsed previous psychiatric hospitalization (range = 1-3), whereas one-fifth (21.9%) reported inpatient substance use treatment (range = 1-4).
As the primary aim of this study, the PICTS-SV’s resistance to response distortion was assessed through a repeated-measures multivariate analysis of variance (MANOVA) to examine changes in scores between honest and RM conditions. As expected in an forensic population, participants’ baseline scores (see Table 2) reflect that they frequently endorsed elevated levels of criminal thinking, with less than 10% of examinees scoring in the “low” range (i.e., T-scores < 40; Walters, 2010) for any of the thinking style scales.
Within-Group Differences From Honest to RM Conditions for PICTS-SV T-Scores

Note. Cut score denotes the T-score at which the scale is considered elevated, per Walters’ (2010) recommendations for the PICTS. RM = risk minimization; PICTS-SV = Psychological Inventory of Criminal Thinking Styles–Simplified Version; Cf-r = Confusion–revised; Df-r = Defensiveness–revised; R = Reactive Criminal Thinking; Ci = Cognitive Indolence; Co = Cutoff; Ds = Discontinuity; P = Proactive Criminal Thinking; En =Entitlement; Mo = Mollification; Po = Power Orientation; Sn = Sentimentality; So = Superoptimism; GCT = General Criminal Thinking; CUR = Current Criminal Thinking; HIS = Historical Criminal Thinking; FOC = Fear of Change; PRB = Problem Avoidance; INF = Infrequency; AST = Self-Assertion/Deception; DNH = Denial of Harm; PICTS = Psychological Inventory of Criminal Thinking Styles.
The omnibus test proved significant, Pillai’s Trace F(20, 52) = 5.03, p < .001, indicating a significant change in the overall score profile. Table 2 illustrates that at a scale level, however, only four thinking styles proved statistically vulnerable to RM distortion despite the more easily understood content. Moreover, these changes in scores produced only small-to-moderate effect sizes (ds ≤ |0.43|). Simulators modestly decreased scores for thinking style scales reflecting elements of both reactive (i.e., Co) and proactive (i.e., En) thinking. This pattern suggests examinees attempting to look low-risk suppressed their report of impulsive behavior and entitlement. Df-r validity scale scores, which reflect “fake good” responding (Walters, 2010), also showed an expected increase under RM simulation. Interestingly, Mo and Sn scores also increased under RM conditions; participants apparently attempted to enhance their self-images by exaggeratedly externalizing blame for criminal involvement and emphasizing their good deeds to negate any harm caused.
As a particular psychometric strength, participants were unable to significantly decrease overall report of risk at the broader composite level, resulting in small, nonsignificant changes for P (d = 0.24), R (d = 0.15), and GCT (d = 0.21) scores. Regarding clinical interpretation, only a small proportion of examinees were able to shift their scores from the elevated to the nonelevated range for both P (5.4%) and R (5.5%). For GCT, a very slight increase occurred in the rate of elevations from 58.9% to 61.6%, plainly underscoring the stability of PICTS-SV composite scores in response to RM.
These findings are impressively positive, as they differ markedly from the large to very large effects typically found in simulation research on response styles (Rogers, 2018). To explain the difference, Gillard and Rogers (2015) postulated thinking errors may be more difficult for evaluees to recognize and distort than content related to overtly antisocial behaviors or symptoms of mental disorders. Thus, the PICTS’ and PICTS-SV’s success may be attributable to the resulting lesser face validity. Their focus on criminal thinking processes (e.g., sentimentality) rather than solely thought content may also further complicate examinees’ attempts to identify socially desirable responses. Overall, these findings provide encouraging support that the PICTS-SV maintains effectiveness despite intentional RM, particularly at a composite scale level.
As a second research aim, empirical evaluation of the PICTS-SV’s Df-r validity scale is needed to assess its accuracy for classifying genuine and RM respondents. Of course, given the PICTS-SV’s general resistance to response distortion, the impact of the small degree of change in participants’ scores must be acknowledged. That is, large changes in Df-r scores are not expected when the vast majority of examinees were unsuccessful at significantly decreasing their report of criminal thinking. As a result, utility analyses were restricted to include only those participants who were able to meaningfully decrease their overall report of GCT by ≥ 10T (i.e., one standard deviation), resulting in a subset of only 13 individuals. Various cut-score values were then tested for the simplified Df-r scale at base rates of 15% and 25%, per previous estimates (Rogers, Gillard, Wooley, & Kelsey, 2013) of denied psychological symptoms in clinical and forensic settings.
With very preliminary data, Table 3 highlights that Walters’ (2010) recommended cut scores for elevated (T ≥ 55) and invalid (T > 65) Df-r evidence high levels of specificity. A T-score above 65, for example, identified RM examinees with perfect specificity (1.00), meaning that no honest examinees would be mistakenly labeled as engaging in response distortion. The simplified reading level of the PICTS-SV likely makes high Df-r scores especially unlikely for honest examinees, as it reduces the risk of random or idiosyncratic responding. However, this cut score showed virtually no sensitivity (0.08). Pending additional research, Df-r may best serve as a screen; elevations ≥ 55 on Df-r should be considered extremely unlikely for genuine respondents and warrant further assessment of response distortion with more extensively validated measures.
Preliminary Data on Optimized Utility Estimates for the PICTS-SV Df-r Scale

Note. Analyses were restricted to examinees (n = 13) who meaningfully decreased GCT scores by ≥ 10T. Walters (2010) recommends interpreting Df-r T ≥ 55 as elevated and T > 65 as invalid. PICTS-SV = Psychological Inventory of Criminal Thinking Styles–Simplified Version; Df-r = Defensiveness–revised; PPP = positive predictive power; NPP = negative predictive power; OCC = overall correct classification.
General Discussion
The ever-increasing referrals for risk assessment in forensic settings necessitate accurate evaluation to guide consequential decisions (Desmarais et al., 2016). Dynamic risk factors have been shown to correlate as strongly with recidivism outcomes as static factors (Bonta et al., 2014; Gendreau et al., 1996; Pedersen, Rasmussen, & Elsass, 2010; Walters, 2002), while also offering the practical benefit of being modifiable through interventions. As noted, criminal cognitions have garnered particular attention as a risk-relevant factor due to their suitability to evidence-based treatments such as cognitive-behavioral approaches (Landenberger & Lipsey, 2005). Accordingly, the importance of comprehensive risk evaluation that considers criminal thinking is readily apparent. Establishing the utility of the recently developed PICTS-SV has wide-ranging implications for informing decisions about the required level of supervision, treatment intensity, and types of interventions (Bonta et al., 2014).
Concurrence Between the PICTS and PICTS-SV
Across forensic settings, the PICTS has garnered significant support for its psychometric properties and utility for risk-relevant decision-making (Scott et al., 2014; Walters, 2002, 2012a). With its reduced reading level, the PICTS-SV makes a major contribution to increasing practical utility for the significant proportion of legally involved individuals who read below the PICTS’ 9th grade level. Disabato et al.’s (2016) initial validation research provided strong support that the simplified version mirrors the factor structure of the original PICTS (Walters, 2010). As two limitations, however, Disabato et al. (2016) did not directly assess its concurrence with the PICTS and their sample utilized exclusively male inmates from a sex offender treatment program. This latter point raises important questions about the generalizability of results to female and general forensic populations (Taxman et al., 2011).
Thus, the present results provide important initial evidence of the PICTS-SV’s concurrent validity with the PICTS in a very different forensic sample. Moreover, the very strong relationships observed at the composite scale level were largely comparable or superior to those reported for PICTS test–retest values (Walters, 2010). The PICTS offers the advantage of validated T-scores, but when reading comprehension is a concern, these findings indicate that the PICTS-SV can be effectively implemented with examinees of varied reading levels.
The Vulnerability of the PICTS-SV to RM Response Distortion
Accurate risk classification represents a tantamount clinical concern for forensic professionals, with wide-ranging consequences. Historically, clinical professionals have generally viewed risk assessments as immune to response distortion because they incorporate collateral records (e.g., Douglas et al., 2013; Knight et al., 2002); however, this assumption is simply not empirically supported. Illustrating the potential constraint of incomplete record data, the extensiveness of file information varied dramatically for the current sample. Some files included comprehensive evaluation reports detailing background and criminal history, risk and needs factors, and psychological diagnoses. Others, in contrast, contained only a list of current and prior charges. Moreover, the facility’s records consisted primarily of information specific to treatment and probation compliance for charges acquired in Texas, which may not fully reflect the extent of the individual’s legal involvement. This limitation reflects a practical reality of clinical settings: in many short-term or diversion facilities, it is unlikely that practitioners gain access to comprehensive substance use, mental health, and criminal records. Over-reliance on record review can subsequently lead to serious underestimations of risk, which may be highly detrimental to accurate classification.
The potential for response distortion is compounded by the fact that some important risk factors, including criminal thinking, require examinees’ report. Despite this, research on the impact of RM on risk-relevant measures remains limited and primarily correlational. For example, McEwan and colleagues (2009) observed lower reported anger expression for forensic patients with higher levels of impression management, but utilized a measure of general social desirability unrelated to risk. Edens and Ruiz (2006) found that higher impression management scores on the Personality Assessment Inventory (PAI) were associated with higher rates of institutional misconduct. However, the authors could not definitively identify RM respondents or clarify whether these attitudes directly caused problematic behavior. In the only systematic evaluations of RM among inmates, Gillard and Rogers (2015) demonstrated that examinees were able to effectively decrease risk scores on the HCR-20 and a self-report risk assessment (i.e., the Self-Appraisal Questionnaire [SAQ]; Loza, 2005). Moreover, the effect sizes were moderate to large (i.e., ds = 0.36-1.32, M = 1.00), countering the assumption that risk-relevant measures are exempt from concerns about response distortion. In contrast, Gillard and Rogers’ (2015) study found the original PICTS to be relatively less susceptible to RM, with small-to-moderate effect sizes for its scales ranging from 0.10 to 0.76 (M = 0.47).
The current study builds on these prior findings, demonstrating that the PICTS-SV mostly maintains effectiveness against RM distortion. Moreover, the observed effect sizes were even smaller than those reported for the PICTS at both the thinking style (i.e., M d = 0.20 vs. 0.47, respectively) and the composite (0.20 vs. 0.67) scale level despite the use of virtually identical simulation scenarios (i.e., minimize risk for a sentencing evaluation after an aggravated assault charge). Differences may be attributable to the samples used in each investigation. The current sample included both males and females facing drug charges, whereas Gillard and Rogers (2015) utilized a sample of male jail inmates. The generally lower baseline scores produced by female participants likely contributed to the smaller effect sizes seen here.
Scale-level comparisons highlight themes in examinees’ strategies for RM. For example, the two PICTS-SV scales (Co and En) that decreased under simulation conditions were also among those significantly decreased on the PICTS (Gillard & Rogers, 2015). This finding suggests that impulsive behavior and an entitled attitude are consistently perceived as particularly risky or undesirable. Interestingly, though, participants in Gillard and Rogers’ (2015) sample did not produce the concomitant increase on Mo and Sn. Nonetheless, the authors found that Mo was the only scale that did not change significantly under simulation conditions and Sn showed the smallest change in scores (d = 0.29). This pattern appears to corroborate that Mo and Sn scale content is generally perceived as less risky or detrimental to examinees, potentially due to its focus on minimizing one’s own blameworthiness (Walters, 2010). The criminal attitudes targeted for minimization may also be influenced by the treatment emphases of a given program. For example, the substance-focused treatment received by the current participants included elements of cognitive-behavioral therapy and Alcoholics Anonymous programming, approaches which emphasize strategies to reduce impulsive responding and promote humility as an essential quality for recovery.
Overall, the present results corroborate that examinees are able to produce only small-to-moderate decreases in PICTS-SV scores. The higher order composite scales (i.e., GCT, P, and R) are especially robust to manipulation. Accordingly, practitioners are encouraged to focus primarily on interpretation of those scales when concerns exist about the veracity of an examinee’s responding.
Evaluating and Refining the Df-r Validity Scale
The original Df validity scale’s items were rationally developed and then refined through field testing with male prisoners (Walters, 1995a). However, Df failed to successfully differentiate genuine versus positive simulation groups in a subsequent investigation (Walters, 1995b). A later factor analytic investigation (Walters, 2001) led to several items being removed and replaced to create the Df-r scale, which showed promise for differentiating simulators from honest respondents with a large effect size (d = −0.92). Although the generalizability of the revision benefited from development in a larger clinical sample of male and female inmates, it has received no subsequent research attention. The lack of replication warrants particular consideration given the Df-r is empirically rather than conceptually derived (Rogers, 2018). With this in mind, further evaluating the efficacy of existing cut-score recommendations to detect RM serves as an important step to strengthen the PICTS-SV’s resistance to response distortion.
The current utility estimates evidenced excellent specificity but consistently modest sensitivity, which raises concerns about the practical usefulness of the simplified Df-r scale to alert practitioners to the possibility of RM. These initial findings, although admittedly limited to a small subset of participants, suggest the PICTS-SV version of Df-r warrants revision and refinement to improve its effectiveness. As one approach, the development of items based on conceptual content rather than factor loadings would enhance the theoretical relevance of findings (Rogers, 2018). Alternatively, the finding that Mo and Sn scores tended to increase under RM conditions may point to novel strategies for detection of response distortion. For example, identifying patterns or ratios between these two scales and the other six thinking styles that are seen for RM respondents but unusual among honest examinees may offer utility as a detection strategy.
In summary, the PICTS-SV shows promising utility as a risk-relevant measure whose self-report format makes it a time- and cost-effective use of professional resources. As a particular strength, it demonstrates robust resistance to intentional RM at the composite level most commonly interpreted by clinical professionals. However, concerns about the sensitivity of Df-r remain that warrant further large-scale study and subsequent refinement. These initial findings can contribute to evaluators’ decision-making about when additional validity testing is warranted for the consequential decision of risk classification.
Methodological Considerations
The current study provides important data regarding the effective use of the PICTS-SV. However, some limitations that potentially reduce the generalizability and application of the present findings must also be addressed. As a primary consideration, only very preliminary data are available for examining Df-r cut scores. Regarding the sample, individuals facing drug charges or who have a history of substance use issues are very common in the criminal justice system, but the current findings require further testing and replication. Therefore, a key area of future research should center on continued investigation of the PICTS-SV’s reliability and validity with varied forensic populations, including data on unexamined psychometric properties such as test–retest reliability. Moreover, PICTS research has yet to be conducted with legally involved adolescents (Walters, 2002), likely in part due to its relatively high reading requirements. However, the decreased 6th grade reading level of the PICTS-SV is expected to extend its applicability to juvenile facilities.
Minimization of risk is expected to be the most common form of response distortion in risk assessment evaluations, and it is also feasible that evaluees in some scenarios (e.g., to receive more intensive treatment or be housed in a residential setting) may be motivated to exaggerate or feign certain components of criminal thinking. The present study focused on the Df-r scale, which was designed to evaluate minimized responding. However, the PICTS-SV also contains the Cf-r scale to detect exaggerated or careless response styles (Walters, 2001). As discussed, future research should consider not just refinement of cut scores for the validity scales but also novel detection strategies to identify profiles and indicators of response distortion for different examinee objectives.
With professional applications in mind, future research should also evaluate how criminal thinking can be most effectively incorporated into the RNR model of intervention (Andrews & Bonta, 2010). For example, differences in risk and treatment outcomes could be examined when criminal thinking as measured by the PICTS-SV is directly targeted as a criminogenic needs factor.
Concluding Thoughts
The current investigation builds on the well-established utility of the PICTS (e.g., Scott et al., 2014; Walters, 2012b; Walters & Lowenkamp, 2016) with encouraging initial support for the PICTS-SV (Disabato et al., 2016). Clinical practitioners in forensic settings are encouraged to incorporate the PICTS and PICTS-SV as a way to evaluate the important dynamic risk factor of criminal thinking. Given their observed effectiveness against RM, the PICTS-SV composite scales in particular may be relied on to provide relevant information about criminal cognitions for risk conceptualization and tailored treatment recommendations. It is hoped these findings can contribute to difficult and consequential determinations about future risk for recidivism and violence that have major implications for individuals involved with the justice system and their communities.
Footnotes
Authors’ Note:
Portions of this manuscript were presented at the 2019 annual conference of the American Psychology–Law Society and the 2018 annual conference of the American Academy of Psychiatry and Law. The Psychological Inventory of Criminal Thinking Styles–Simplified Version (PICTS-SV) measure was provided by and used with the permission of MHM Services, Inc.