
Abstract
This study examined the predictive validity of criminogenic needs and strengths as measured by the Youth Assessment and Screening Instrument (YASI) and the Service Planning Instrument (SPIn) within five different samples from Canada and the United States spanning 6,445 justice-involved youths and 46,127 adults (combined N = 52,572). Dynamic strengths consistently increased predictive accuracy beyond dynamic criminogenic needs. Furthermore, in a Canadian community adult sample (N = 20,537), strengths attenuated recidivism rates in lower- and moderate-need-level groups but had no impact among higher-need-level groups. Relatedly, in an American, federal re-entry adult residential sample (N = 23,615), strengths attenuated program completion success rates across all need levels, albeit the effect was slightly more pronounced in the lower- and moderate-need groups. Thus, dynamic strengths are more than merely the absence of dynamic criminogenic needs and should be actively considered during case management.
Risk assessment has evolved considerably since the pioneering work of Ernest Burgess (1928) who created the first actuarial measure to predict parole failure. Since Burgess, the number of justice-oriented risk assessment tools has swelled to 400 worldwide with most characterized by structured professional judgment (SPJ) or actuarial mechanical approaches (Singh et al., 2014). The corresponding evidence base is equally impressive. To date, SPJ and actuarial tools used across a range of justice populations generate area under the curve (AUC) predictive accuracy values in the range of .63 to .78 (Campbell et al., 2009; Hanson & Morton-Bourgon, 2009; Olver et al., 2014; Singh et al., 2011).
However, assessment has been decidedly deficit-based with little attention afforded to the construct of strengths. Furthermore, the correctional literature has been mired in definitional debates regarding what constitutes a “strength” coupled with the introduction of countless strength-based terms that are often used interchangeably (e.g., strengths, assets, promotive factors, protective factors [interactive or risk-based], buffering factors, booster factors). There is evidence that composite strength measures are negatively correlated with criminal justice outcomes. However, less is known about the role of individual strength domains, whether strengths add incrementally to risk, and whether or not strengths can actually exert a genuine buffering or protective effect among higher risk individuals (Wanamaker et al., 2018). Consequently, this study examines the predictive utility of strengths alongside risks in five different data sets comprised of either adult or youthful justice-involved samples from Canada and the United States using the Youth Assessment and Screening Instrument (YASI; Orbis Partners, 2000) and the Service Planning Instrument (SPIn, Orbis Partners, 2003).
Most contemporary risk assessment tools capture both static and dynamic risk factors/criminogenic needs. Although static and dynamic risk factors predict future criminal justice involvement, static factors are immutable, whereas dynamic factors/criminogenic needs can change in response to intervention. Notably, throughout this article, the term risk factor includes both static and dynamic risk factors; as well, the terms dynamic risk and criminogenic need are used interchangeably. Correctional assessment tools have traditionally focused on measuring risk factors (e.g., has many criminal friends, has no employment skills) that increase the probability of criminal conduct rather than strength factors (e.g., has prosocial friends, demonstrates high treatment motivation) that may potentially reduce the probability of criminal conduct. Furthermore, some scholars have argued that strengths are merely the flip side of risks and are already adequately captured during the risk assessment process (Baird, 2009; Harris & Rice, 2015).
However, a paradigm shift has emerged. In 2002, Ward introduced the Good Lives Model (GLM) as a strength-based rehabilitative framework. The GLM was originally developed for individuals convicted of sex offenses, but has since been applied to other populations, including justice-involved individuals with mental illness (Barnao et al., 2016) as well as adolescent detained females (Van Damme et al., 2017). In short, the GLM posits that criminal behavior results when individuals lack internal and external resources to meet their needs using prosocial means. Consequently, rehabilitation efforts should empower justice-involved individuals with the skills, knowledge, and resources required to meet their life goals and values without harming others. Therapeutically speaking, the GLM leads to approach setting/strength-oriented goals (e.g., seek out prosocial activities) as well as risk avoidance goals (e.g., don’t go to the bar with your friends; Ward, 2002). Similarly, the latest version of the Risk-Need-Responsivity (RNR) model of assessment and treatment (Bonta & Andrews, 2017) has actively incorporated the role of strengths; notably, the concept of strength is explicitly embedded within three of the 15 RNR principles: first, in conjunction with criminogenic needs: “move criminogenic needs in the direction of becoming strengths” (p. 176); second, as specific responsivity factors: “when working with the weakly motivated build on strengths . . .” (p. 176); and finally, as a core principle/key clinical issue, “Strength: Assess strengths to enhance prediction and specific responsivity effects” (p. 177).
The fields of resilience, positive psychology, and criminal desistance have also contributed to the emergence of a more balanced approach to correctional risk assessment, one that strives to incorporate strengths as well as risk factors. In the 1970s, developmental psychologists (e.g., Garmezy, 1973) were exploring the role of strengths in resilience outcomes among children living with adversity (e.g., poverty, mothers with schizophrenia). In brief, resilience refers to “a dynamic process encompassing positive adaptation within the context of significant adversity” (Luthar et al., 2000, p. 543). In sum, resilience researchers argue that strengths—personal (e.g., need for mastery), interpersonal (e.g., high-quality parenting), or community (e.g., cohesive neighborhoods)—are the true causal agents of resilient outcomes (Masten, 2013). Relatedly, positive psychology, an inherently strength-oriented model, emerged with Seligman’s (1998) presidential address to the American Psychological Association. Seligman argued that psychology must not only focus on psychopathology, but also subjective well-being and making normal lives more fulfilling. Finally, the study of criminal behavior, historically steeped in understanding the onset and maintenance of criminal behavior, has become increasingly interested in understanding desistance. Briefly, desistance is the process by which individuals stop engaging in criminal conduct. Although the desistance field is characterized by complex theoretical and methodological challenges (see Serin et al., 2016), the field has arguably identified a number of strengths that lead to reduced reoffending such as stable employment, sobriety, strong marriages, prosocial attachments, and cognitive transformations: “deciding to go straight” (Maruna, 2001; Sampson & Laub, 2005; Serin et al., 2016).
Notwithstanding the corrections field’s willingness to embrace the concept of strengths (see Baird, 2009; Harris & Rice, 2015, for exceptions), defining strengths has proved an arduous task (Ward, 2017). In sum, strength definitions fall into two categories: (a) parsimonious conceptualizations grounded in face validity, irrespective of their empirical relationship with criterion measures; for example, Jones et al. (2015) describe a strength as “a positive or prosocial facet of an individual’s life. . .” (p. 323) to (b) more complex definitions that are empirically rooted. Empirical-based definitions minimally require that strengths are negatively predictive of some justice-related outcome in a univariate sense; these are commonly known as promotive factors (Farrington et al., 2016). More stringent empirical litmus tests require that strengths add incrementally to prediction above and beyond risk factors and/or that they interact with overall risk level (e.g., risk-based protective factors) or other risk factors (interactive protective factors). Farrington et al. define risk-based protective factors as factors that attenuate justice-related outcomes in higher risk groups, whereas interactive protective factors are factors that attenuate justice-related outcomes because they interact with a specific risk factor (Farrington et al., 2016). Accordingly, we use the following definitions: (a) strengths are conceptually agreed upon positive attributes of an individual and/or their environment, irrespective of demonstrated empirical associations with justice-related outcomes, (b) promotive factors are strengths that are negatively predictive of a justice-outcome, (c) incremental promotive factors also add over above risk level or other risk factors, and (d) risk-based protective factors are strengths that empirically interact with cumulative risk level such that the presence of protective factors reduces the probability of future justice involvement to a greater degree in higher risk cases than lower risk cases. An examination of specific interactive protective factors (e.g., can a positive adult mentor reduce the negative impact of living in a highly criminogenic neighborhood?) is beyond the scope of this article.
Empirically, there is growing support that at the very least, some strengths can be classified as promotive factors. Scott and Brown’s (2018) meta-analytic review illustrated that the presence of prosocial peers, prosocial values, the rejection/absence of substance abuse, familial support, and education/employment opportunities predicted success among youth-justice samples. Similarly, Wanamaker et al.’s (2018) narrative review of 48 predictive outcome studies involving eight different measures that capture strengths revealed that each measure demonstrated a clear promotive effect. However, the evidence was more tenuous in regard to the ability of promotive factors to illustrate an incremental effect above risk factors. Albeit, preliminary research involving the SPIn (Orbis Partners, 2003) and the YASI (Orbis Partners, 2000) demonstrated that strengths can add incremental predictive validity above and beyond global risk level. Similarly, Jones and Robinson (2018) have also shown that strengths can exert an independent influence on recidivism over and above a global risk level when measured vis-à-vis the SPIn.
Evidence for protective effects has only been investigated in a few studies. Notably, based on a sample of 188 Dutch males released from a forensic psychiatric facility, de Vries Robbe et al. (2013) reported that the Structured Assessment of Protective Factors (SAPROF; de Vogel et al., 2009) demonstrated a risk-based protective effect. Specifically, the presence of strengths exerted a stronger influence on the moderate- and high-risk groups compared with the lower risk group. In accordance with the SAPROF manual, low-, moderate-, and high-risk (or strength) designations were based on SPJ.
Two additional studies have also reported a risk-based protective effect of strengths. Using data from the 35-item, SPIn Pre-Screen (Orbis Partners, 2003; 11 of the 35 items can be scored as risk or strengths) involving 3,656 adults under community supervision in Canada, Jones et al. (2015) reported two buffering effects. First, among the higher risk group, only 23.2% of the higher risk cases (defined via median split) with high strengths (defined via median split) reoffended during an 18-month follow-up versus 36.4% of higher risk cases with low strengths. Second, a buffering effect was also observed among the lower risk cases (defined via median split). Specifically, 6.1% of the high-strength/low-risk cases reoffended in comparison with 12.5% of the low-strength/low-risk cases. Similarly, using data from the 33-item YASI Pre-Screen (seven of the 33 items can be scored as either risks or strengths; YASI, Orbis Partners, 2000) involving 464 youth under community supervision in Canada, a buffering effect was also observed. Specifically, among the higher risk cases (identified via median split), those who were also classified as high strengths (identified via media split) evidenced a 19.7% recidivism rate over 18 months, whereas those classified as high risk/low strengths evidenced a 42.5% recidivism rate. Notably, the recidivism rates in the low-risk group were virtually identical irrespective of the presence or absence of strengths (8.1% vs. 6.9%; Jones et al., 2016).
The extent to which these risk-based interactions will replicate using analyses with stronger statistical conclusion validity, such as conditional process analysis (Hayes, 2018), requires exploration. In addition, these analyses were based exclusively on the YASI and SPIn Pre-Screens; although the prescreens do contain some dynamic content as well as some strengths (see Jones et al., 2015, 2016, for more information), they are predominantly composed of risk items focused on legal history. The full YASI (88 items) and SPIn (90 items) tap considerably more dynamic content—both strengths and criminogenic needs (see “Method” section). Arguably, to demonstrate that strengths are not simply redundant constructs, perhaps a better test is to focus on the contribution of strengths in the presence of pure dynamic risk (i.e., criminogenic needs) only. Presumably, if strengths are redundant measures in the presence of needs, the former would not meet the requirements of inclusion in predictive models. Hence, when a set of strength factors provide incremental contributions to the prediction of recidivism while competing with need factors, the results would furnish support for the notion that strengths are not merely redundant but are important in their own right.
Scott et al. (2019) conducted the only study that has examined whether the composite strength score garnered from the full, 88-item YASI assessment could add incrementally to the prediction of recidivism in a convenient sample of 254 justice-involved youth from central Canada above and beyond the YASI’s composite need score. The results did not reveal an incremental predictive effect of strengths. Whether this finding will replicate using larger more representative samples requires investigation. Furthermore, similar SPIn-based research has not been explored.
Consequently, using the YASI and the SPIn, the study objectives are to determine whether (a) an aggregate measure of dynamic strengths will evidence incremental predictive validity—or an incremental promotive effect—above and beyond an aggregate measure of dynamic criminogenic needs; (b) an aggregate measure of dynamic strengths will interact with an aggregate measure of dynamic criminogenic needs such that the presence of strengths will buffer or attenuate the effect of dynamic criminogenic needs, also known as a risk-based protective effect; and (c) incremental promotive effects vary as a function of specific strength domains.
Method
Measures
The study used the YASI and the SPIn. Based on the same model of assessment and case planning, the assessment protocols measure risk of recidivism, needs for service, and personal strengths in justice-involved populations. The tools are administered in a variety of contexts, including community supervision (e.g., probation), custody (detention, jail, prison), and re-entry. Both tools include prescreen and full assessment components. The prescreen refers to a subset of static and dynamic risk and strength items primarily used at intake for classification of risk of recidivism (low, moderate, high). Risk-level cutoffs are empirically derived (within jurisdictions) to maximize recidivism rate differentials among risk levels (i.e., low-risk recidivism base rate < moderate-risk recidivism base rate < high-risk recidivism base rate).
Prescreen validation data have been reported elsewhere (Baird et al., 2013; Jones et al., 2015, 2016; Jones & Robinson, 2018). We focused on the full assessment components. The full assessment comprises a more comprehensive set of dynamic needs and strength items used to inform case management. In most contexts, full assessments are reserved for justice-involved individuals scoring in the moderate and high levels of the prescreen risk.
YASI
The YASI was adapted from the original Case Management Assessment Protocol (Barnoski, 2003), an assessment tool developed for juveniles by the Washington State Institute of Public Policy in collaboration with the Washington State Association of Juvenile Court Administrators. The full YASI battery consists of 88 items, with 33 items used in calculation of prescreen risk and strength total scores (Orbis Partners, 2000). Full assessment scores incorporate the 33 prescreen items along with the remaining 55 items to form 10 domains—legal history, family, school, community and peers, substance use, mental health, aggression, attitudes, skills (e.g., adaptive skills), and employment and free time. With the exception of legal history and mental health, the full assessment domain scores are based on dynamic content, with seven of the domains (excluding legal history, substance use, and mental health) having both need and strength subscores (i.e., 14 domain scores). The full assessment also generates aggregate dynamic scores for overall needs and overall strengths. Domain scores (for the YASI and SPIn) are calculated by summing individual domain items that have been weighted vis-à-vis the Nuffield Burgess method.
The response formats for YASI items vary, including Likert-type scales (with five response options), and a minimum of dichotomous and frequency items (e.g., number of occurrences of specific events). The full assessment domains are primarily based on Likert-type scales that quantify the presence of needs at one pole (e.g., problem-solving deficits—cannot identify problems or generate solutions) or strengths (e.g., proficiency at problem-solving—can successfully apply appropriate solutions to problems) at the opposite pole of an item. In contrast to instruments such as the Youth Level of Service-Case Management Inventory (YLS-CMI) and the Structured Assessment of Violence Risk in Youth (SAVRY) that rely on global ratings of strength in various domains (Viljoen et al., 2018), YASI strength domains are aggregates of multiple items that refer to specific positive behaviors, attitudes, skills, and supports. This allows case managers to pinpoint specifically the types of strengths that might help the youth in the process of developing a case plan. A web-based application is used to generate YASI scores and develop case plans. The YASI is completed by case managers based on available file information and a semi-structured interview with the justice-involved youth. Users complete 2 days of training on the administration and application of the YASI.
SPIn
Used for assessing adult justice-involved clients, the SPIn is based on the same design principles as YASI, including prescreen and full assessment versions (Orbis Partners, 2003). Information sources for completing the SPIn include file information and a semi-structured interview. The SPIn training requirements are comparable with the YASI.
The SPIn contains 90 items; 35 items are used to calculate prescreen risk and strength scores. The response formats used for SPIn items are similar to those described for the YASI. There are 11 full assessment SPIn domains, including criminal history, response to supervision (e.g., violations, institutional misconducts), aggression, substance use, social influences (e.g., negative and positive peers), family, employment, attitudes, social/cognitive skills, stability (e.g., financial, living skills), and mental health. Apart from criminal history, response to supervision history, and mental health, the full assessment SPIn domain scores are entirely based on dynamic content. Seven of the domains (excluding criminal history, response to supervision, substance use, and mental health) yield both need and strength subscores (i.e., 14 domain scores). Aggregate dynamic scores are also calculated for overall needs and overall strengths. SPIn Re-entry (Orbis Partners, 2003), an abridged variant of the larger SPIn battery, was also developed. SPIn Re-entry is comprised of 39 items. The full assessment domain structure for needs and strengths is identical to SPIn. But, it is measured with fewer items.
Sample 1: YASI Participants
Sample 1 consists of 4,611 youths under probation supervision in a Canadian province for which YASI Full Assessments were completed at intake between 2009 and 2015. Table 1 indicates that a small proportion of cases was classified as low risk according to the YASI Pre-Screen. However, the proportion of cases falling in the low risk category is not representative of all youth probationers as the sample draws from completed full assessments. Most low-risk cases are not administered YASI Full Assessments. New convictions for any offenses were recorded for a fixed follow-up period of 3 years postassessment. See Table 2 for descriptive information on the needs and strengths scores for each sample.
Sample Characteristics for YASI and SPIn Samples
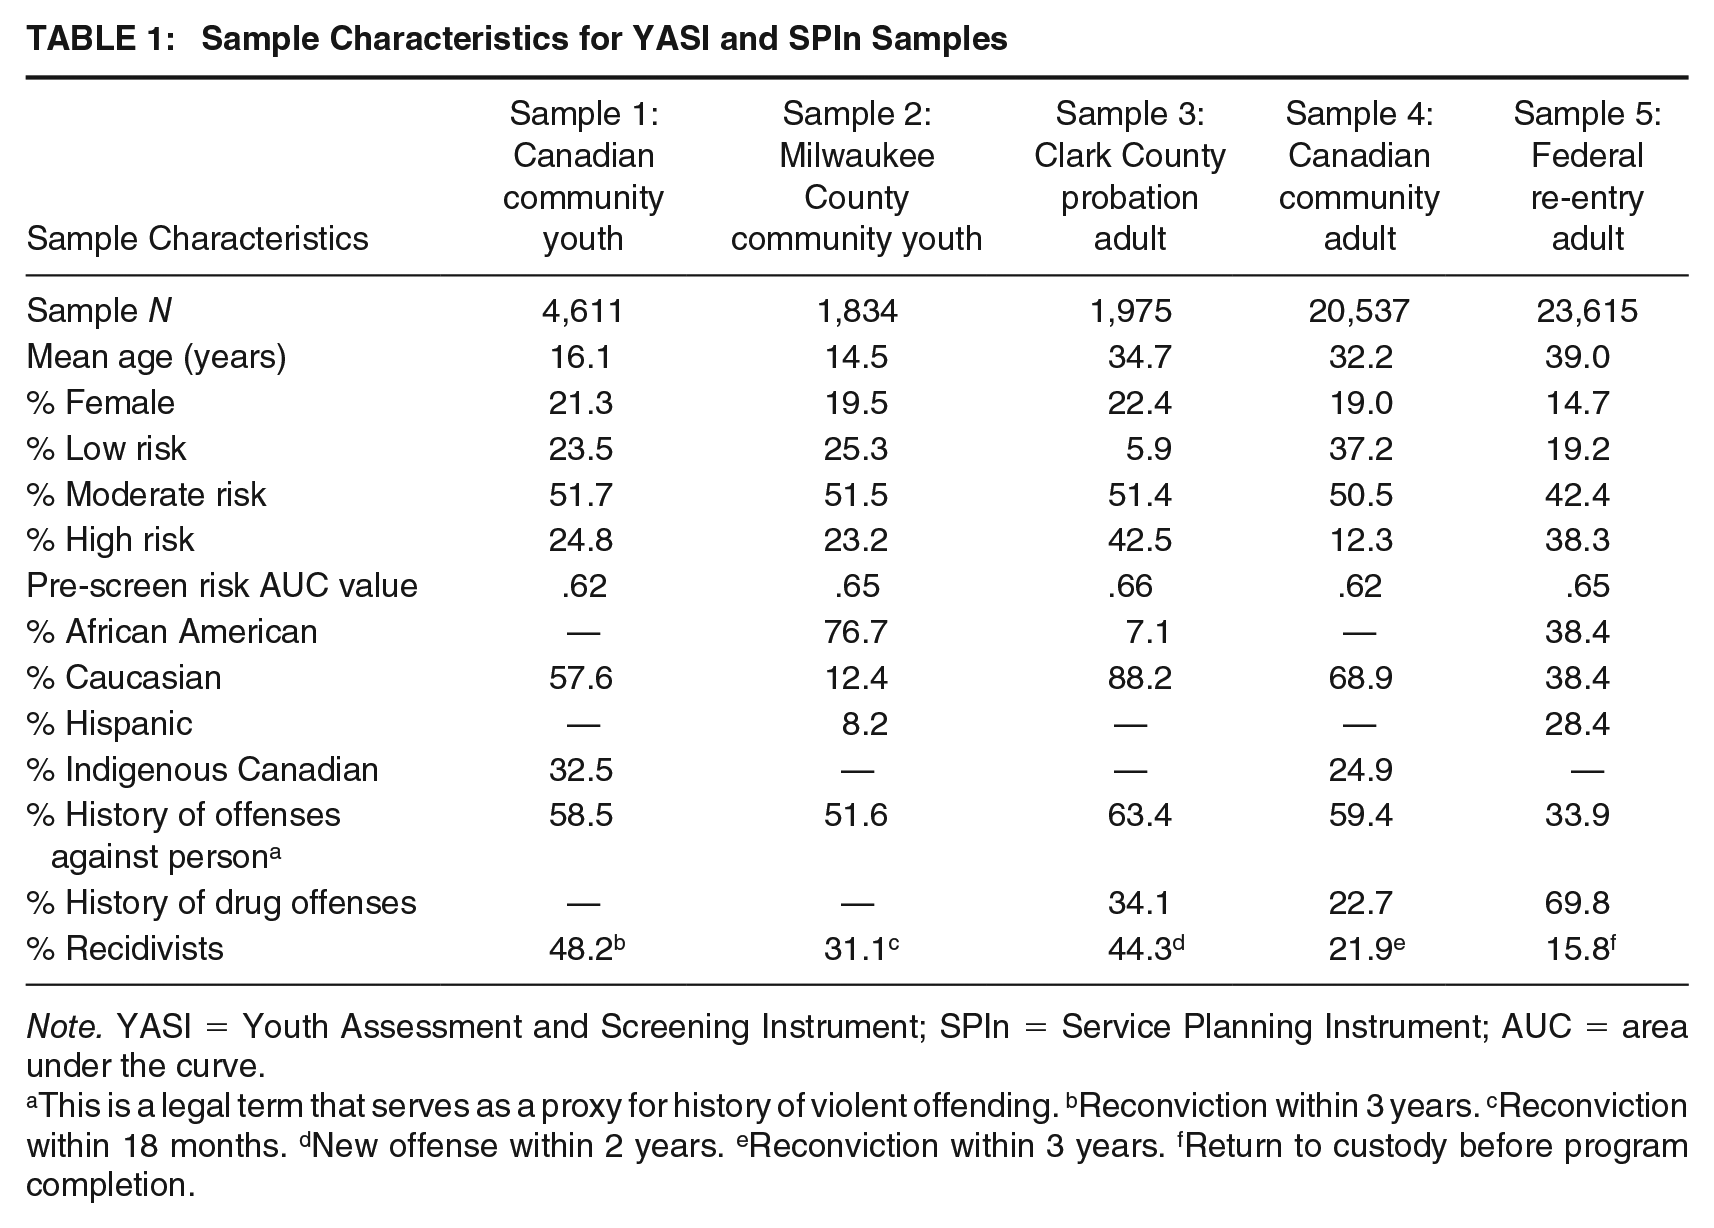
Note. YASI = Youth Assessment and Screening Instrument; SPIn = Service Planning Instrument; AUC = area under the curve.
This is a legal term that serves as a proxy for history of violent offending. bReconviction within 3 years. cReconviction within 18 months. dNew offense within 2 years. eReconviction within 3 years. fReturn to custody before program completion.
Descriptive Statistics for Each Sample

Note. YASI = Youth Assessment and Screening Instrument; SPIn = Service Planning Instrument.
Sample 2: YASI Participants
Sample 2 consists of 1,834 youths who received YASI Full Assessments at service intake between 2013 and 2016. The youth were under community supervision in Milwaukee County Wisconsin. New convictions for any offenses were recorded for a fixed follow-up period of 18 months postassessment. See Table 1 for more demographic and criminal history information.
Sample 3: SPIn Participants
Sample 3 is based on 1,975 adults serving probation sentences for misdemeanor offenses in Clark County Washington. SPIn Full Assessments were conducted at intake between 2010 and 2015 for all members of the sample. The small proportion of low-risk cases reported in Table 1 is likely attributable to a high rate of diversion from formal probation reporting in this jurisdiction, and the fact that low-risk cases are not prioritized for full assessments. Any new offenses (charges and/or convictions) within a fixed follow-up period of 2 years postassessment constituted the measure of recidivism for this study.
Sample 4: SPIn Participants
Sample 4 is based on 20,508 adults under probation supervision in a Canadian province for which full assessments were conducted at intake between 2009 and 2015 (see Table 1). As in the previous samples, the minimal proportion of low-risk cases is not representative of the probation population because lower risk cases are less likely to be triaged for SPIn Full Assessments. Recidivism was defined as any reconviction within a fixed, 3-year follow-up.
Sample 5: SPIn Re-Entry Participants
Sample 5 comprised 23,616 adults who were released from federal custody primarily to 28 residential re-entry facilities operated by a nonprofit service provider in several states across the United States. The sample was under intensive supervised release in the community before being discharged or transitioned to probation. However, 39.2% of the individuals spent some or all of their service time within a private dwelling. Each member of the sample was administered the SPIn Re-entry at the time of re-entry between 2013 and 2018. Recidivism was measured as unsuccessful program completion (i.e., defined as a return to federal custody for breaches of supervision conditions or for new offenses while under re-entry supervision) during the residential or home placement phases of re-entry. The mean number of days that re-entry clients were under the supervision of the service provider was 126 (range = 2–804) days. However, 86% of the sample had been at risk for at least 6 months. Noteworthy, a reanalysis using a fixed 6-month follow-up period based on 86% of the sample rendered similar results. See Table 1 for more details.
Results
The first series of analyses examined (a) whether the overall composite strength score from the YASI and SPIn independently predicted recidivism (scored 0 = no recidivism, 1 = recidivism) in models that included the overall needs composite score (i.e., dynamic risk) and (b) whether strengths would interact with needs. It is important to note that these analyses only included dynamic risk measures and excluded any content related to risk based on static factors. The results of five separate logistic regression analyses conducted independently for each sample are presented in Table 3. In each sample, the results indicated that both the overall need and the overall strength scores from both the YASI and the SPIn contributed independently to predicting recidivism. Importantly, as indicated by the sign of the standardized beta coefficients and corresponding odds ratios (ORs) and confidence intervals, needs were always positively related to recidivism, and strengths were always negatively related to recidivism. Thus, strengths not only evidenced a promotive effect but also an incremental promotive effect over and above needs. At the broadest level, the hypothesis that strengths would be nonredundant when considered alongside needs was supported. Furthermore, despite sample differences in the justice population types and recidivism measures, the individual AUC values for needs (.61–.66) and strengths (.60–.64) were consistent across the five samples with the exception of Sample 4 (Canadian adult SPIn sample) where the AUCs were lower for both needs (AUC = .59) and strengths (AUC = .58).
Predictive Relationship Between Global Need and Strength Scores With Recidivism: Logistic Regression and AUC Results by Sample
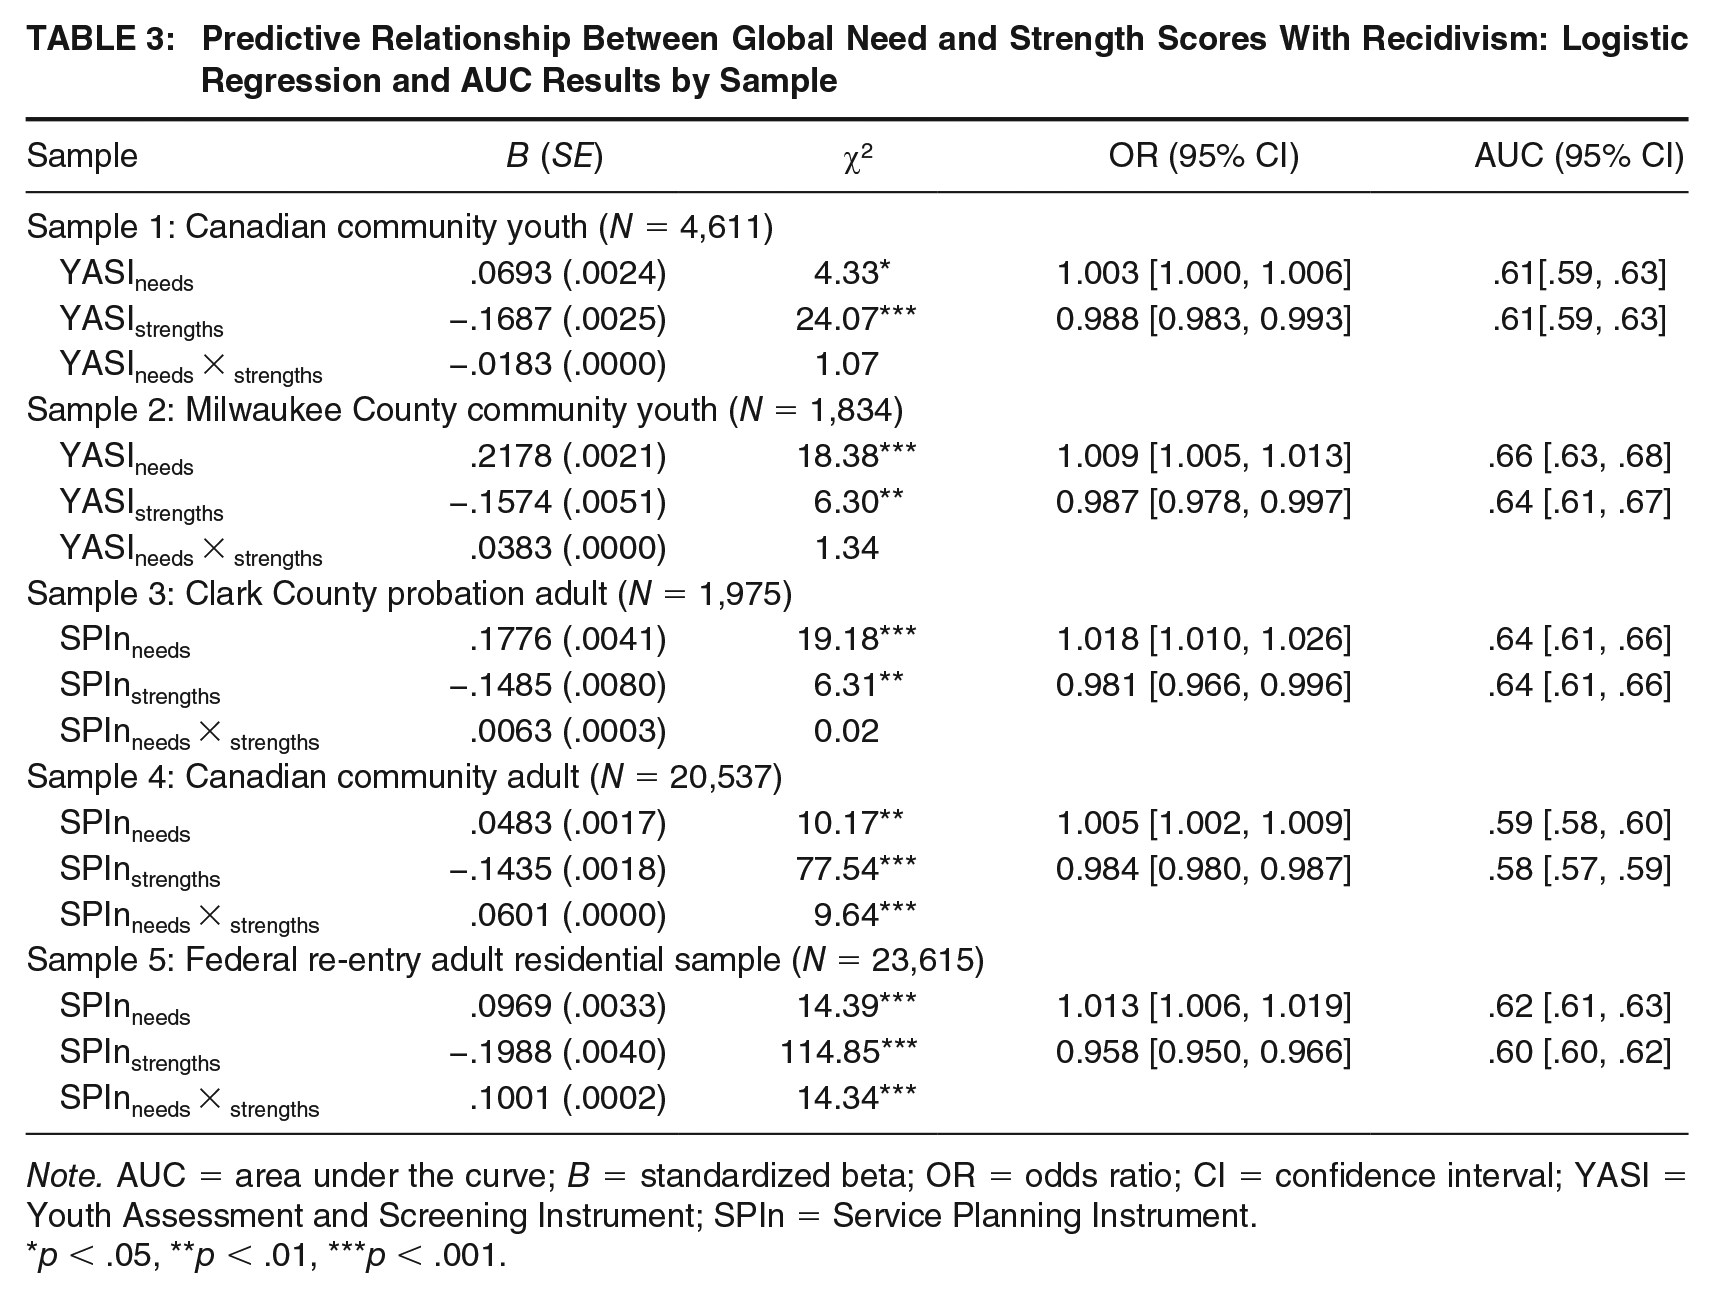
Note. AUC = area under the curve; B = standardized beta; OR = odds ratio; CI = confidence interval; YASI = Youth Assessment and Screening Instrument; SPIn = Service Planning Instrument.
*p < .05, **p < .01, ***p < .001.
Table 3 also illustrated that out of the five logistic regression analyses, two significant interactions emerged, one in Sample 4 (Canadian adult SPIn community sample) and the other in Sample 5 (adult federal American re-entry sample). The interactions were probed using conditional process analysis (Hayes, 2018) for interpretation purposes. As Figure 1 illustrates, in Sample 4, the relationship between overall needs and the predicted probability of recidivism was moderated by overall strengths. Specifically, strengths buffered the impact of needs among those classified as low- (16th percentile) and moderate-need level (50th percentile), but not among those classified as high need (84th percentile). Stated differently, the predicted probability of recidivism among the high-need group remained virtually unchanged regardless of strength level (i.e., the predicted probability of recidivism for the high-strength/high-need group was .28, .28 for the moderate strength/high-need group, and .27 for the low-strength/high-need group). In contrast, the predicted probability of recidivism among the lowest need group did vary as a function of strength level. Specifically, the predicted probability of recidivism among the high-strength/low-need group was .13, .17 for the moderate strength/low-need group, and .21 for the low-strength/low-need group; similar results were also observed for the moderate need group.
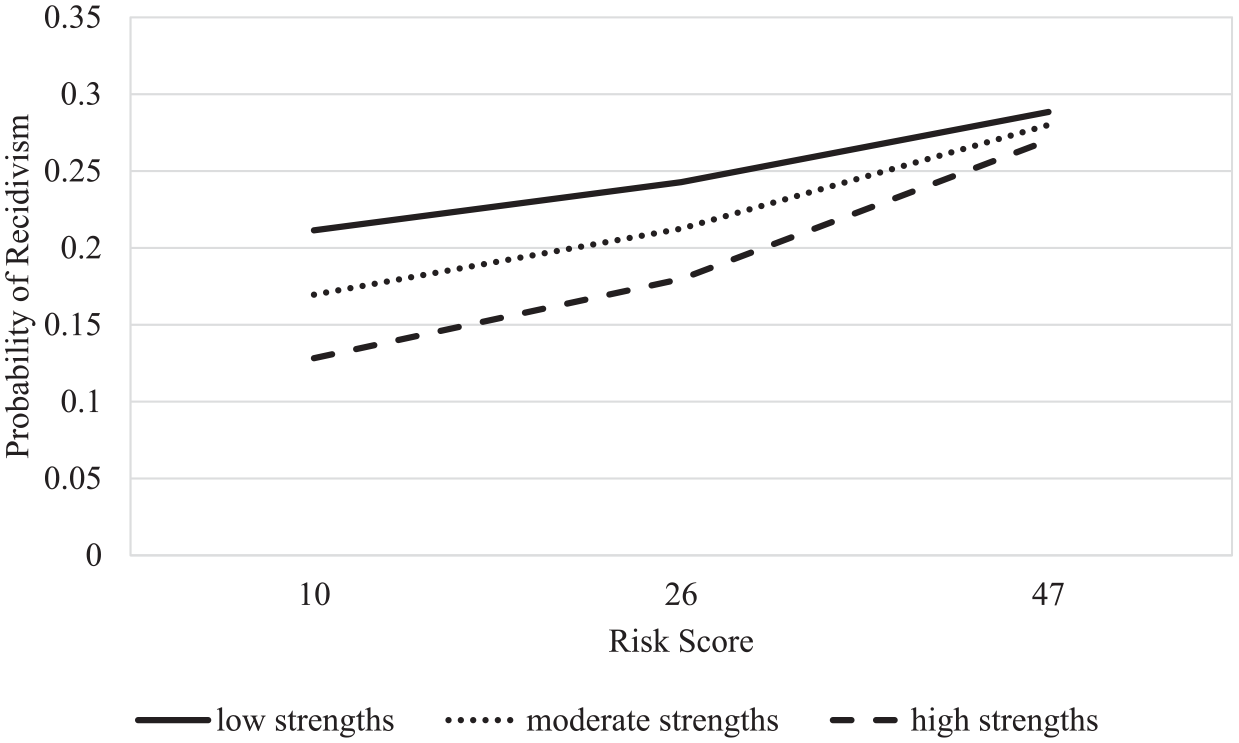
Significant Interaction Effect: Impact of Overall Strengths on the Relationship Between Overall Needs and Probability of Recidivism in Sample 4 (Canadian Community Adult SPIn)
The significant interaction effect for Sample 5 (adult federal American re-entry sample) is plotted in Figure 2. Although the interaction was significant, the graphical representation of the interaction suggests that the strength buffering effect was of similar magnitude regardless of need level, albeit slightly stronger among the low and moderate need groups. For example, the predicted probabilities of success were as follows: (a) among the high-need group: high need/low strength = .74, high need/moderate strength = .79, high need/high strength = .82 (relative improvement in predicted probability of success between high need/low strength and high need/high strength = .10); (b) among the moderate-need group: moderate need/low strength = .82, moderate need/moderate strength = .87, and moderate need/high strength = .90 (relative improvement in predicted probability of success between moderate need/low strength and moderate need/high strength = .09); and (c) among the low-need group: low need/low strength = .86, low need/moderate strength = .91, and low need/high strength = .93 (relative improvement in predicted probability of success = .08). In contrast to the Sample 4 interaction that only evidenced a buffering effect of strengths for the low and moderate need groups, the buffering effect of strengths in Sample 5 spanned all need levels—low, moderate, and high.
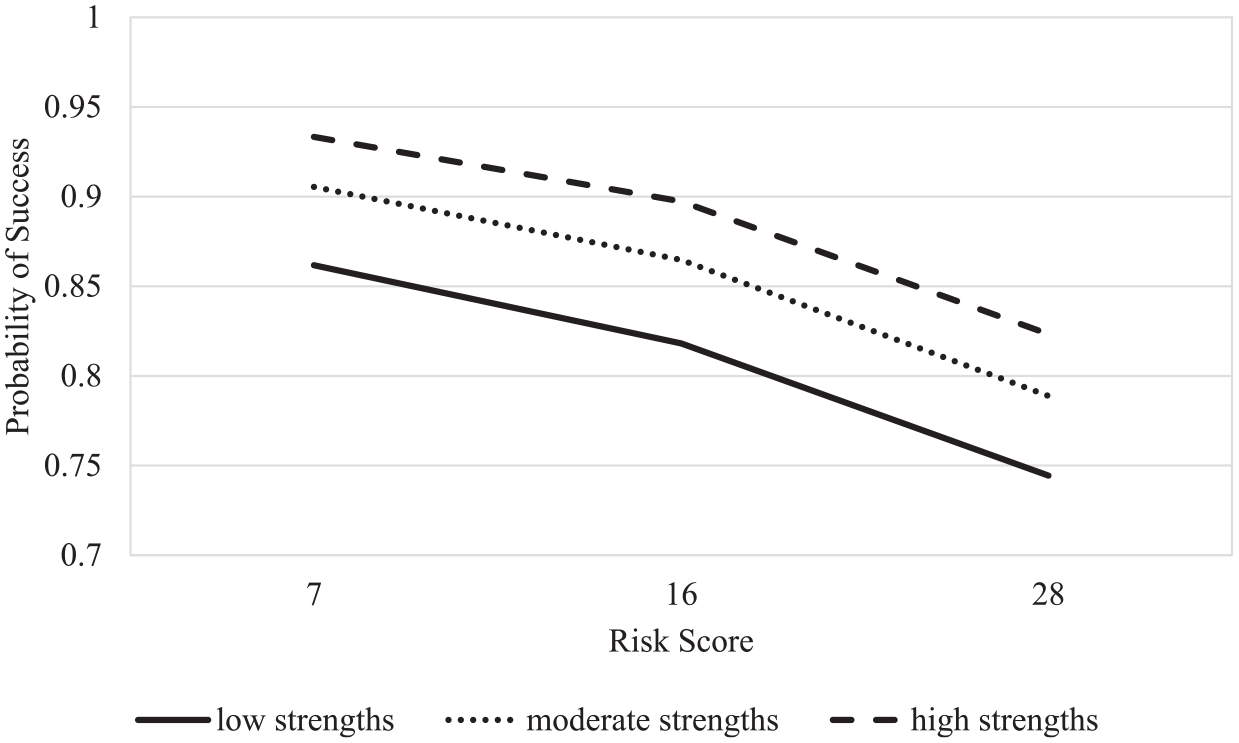
Significant Interaction Effect: Impact of Overall Strengths on the Relationship Between Overall Needs and Probability of Success in Sample 5 (American Re-Entry Adult SPIn Sample)
Tables 4 through 8 present the logistic results that explored the ability of parallel domain-level strengths and needs to add incrementally to the prediction of recidivism in each sample. AUC values corresponding to each individual strength and need were also calculated separately and are presented in Tables 4 through 8. Given the large number of models generated across seven domains for five samples, interaction effects were not tested in these models.
Sample 1: Predictive Relationship Between Domain-Level Need and Strength Scores With Recidivism: Logistic Regression and AUC Results

Note. AUC = area under the curve; YASI = Youth Assessment and Screening Instrument; B = standardized beta; OR = odds ratio; CI = confidence interval.
*p < .05, **p < .01, ***p < .001.
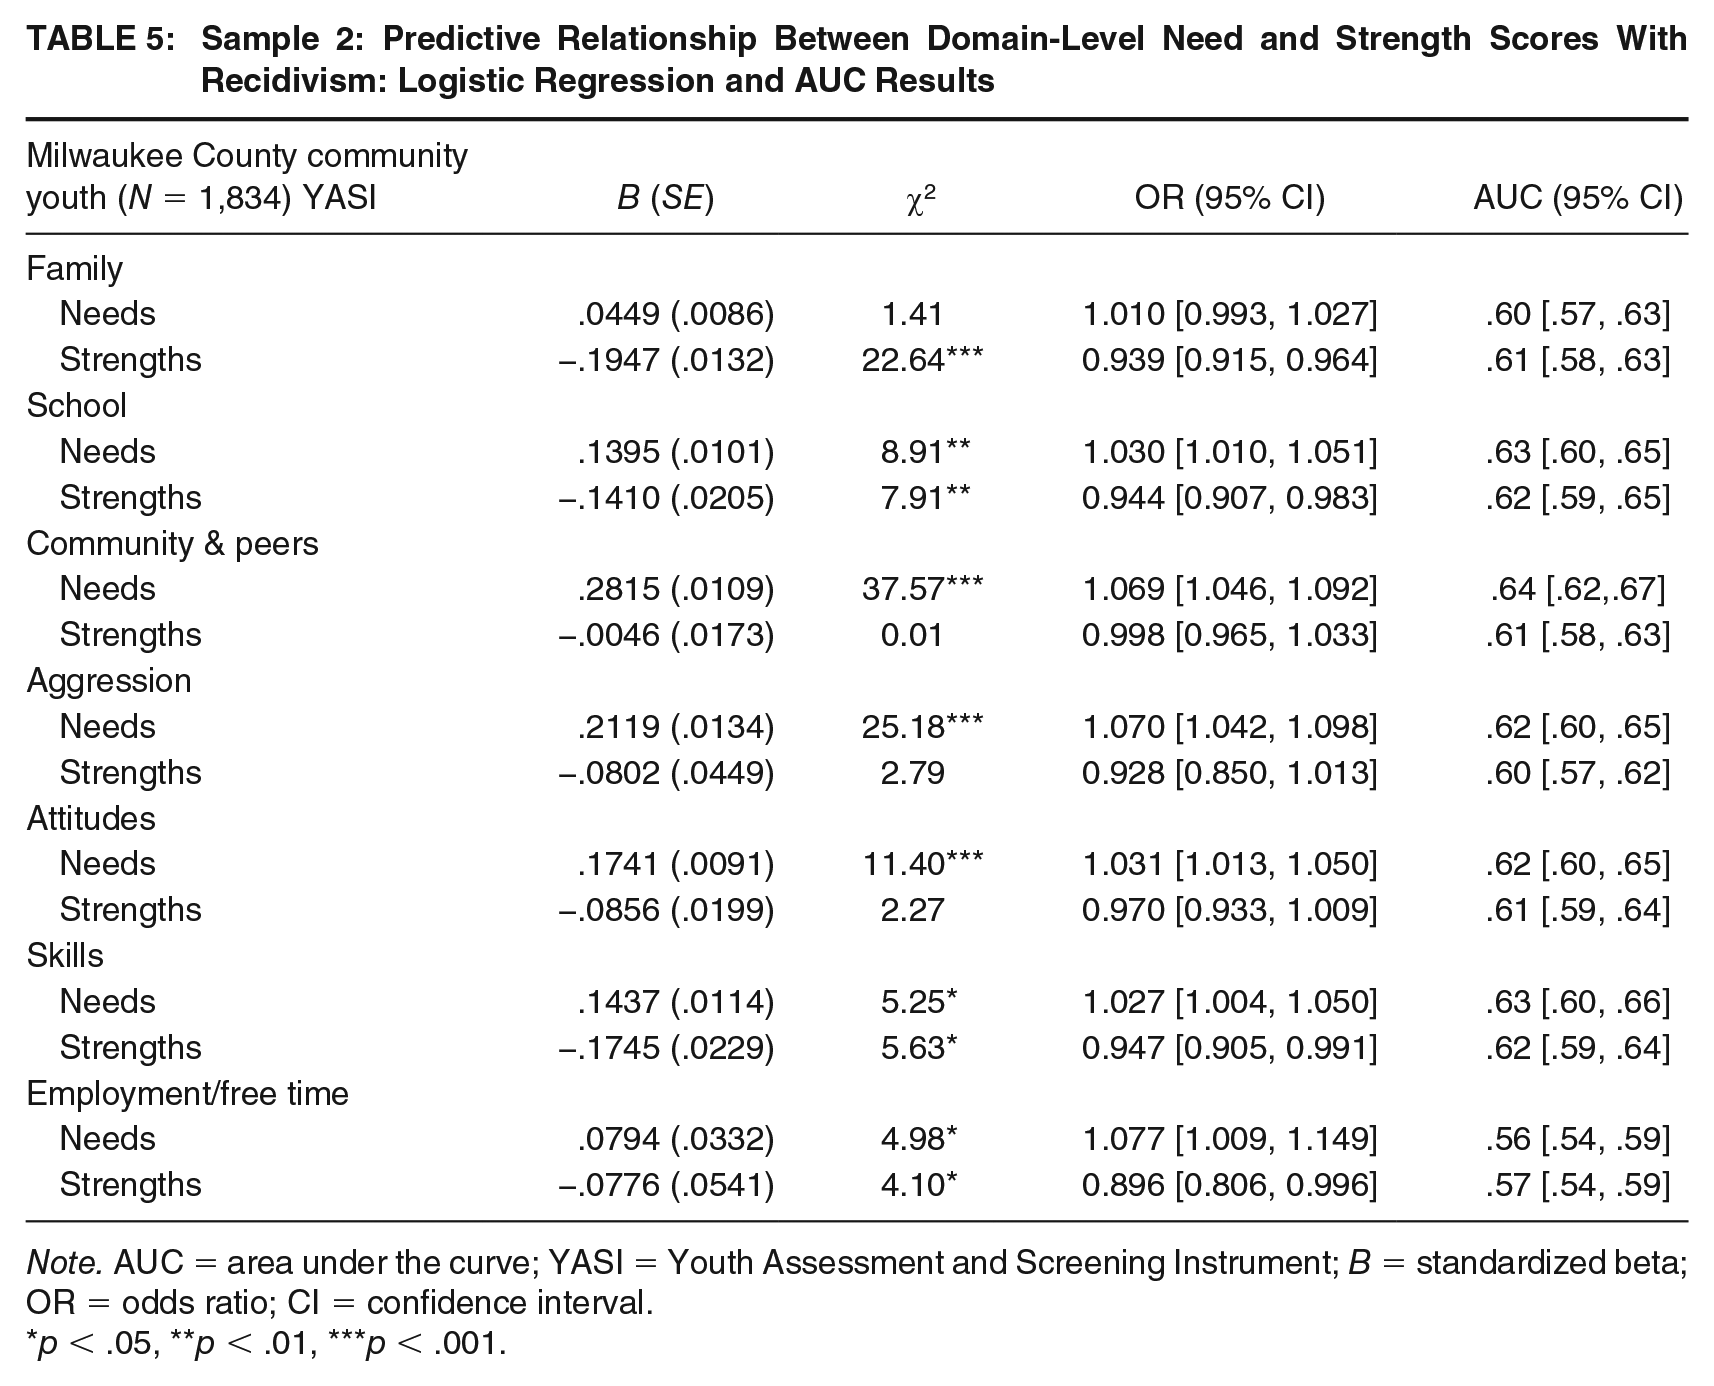
Table 4 for Sample 1 (Canadian YASI community youth) shows that YASI strength domains contributed independent effects in six of the seven domain comparisons. In the case of the aggression domain, the strength domain did not yield an independent effect. While strengths predicted recidivism for the attitudes and employment/free time domains, the corresponding needs scores for these domains did not demonstrate independent effects. In five of the seven models, strength scores showed greater influence than needs as indicated by the magnitudes of the standardized estimates and ORs. Table 5 also provides evidence of the independent effects of strengths in Sample 2 (Milwaukee County community youth). Four of the seven YASI domains yielded incremental effects of strengths, and in each case, the magnitude of influence was less pronounced for needs (OR = 1.010–1.077) than strengths (OR = 0.896–0.947). As in the previous YASI sample, strength failed to yield a significant effect in the model that addressed the aggression domain. In addition, no independent effects of strength were detected for community and peers, and attitudes. In both youth samples, strength scores demonstrated incremental predictive value in addition to the corresponding needs scores in 10 of the 14 models.
Sample 2: Predictive Relationship Between Domain-Level Need and Strength Scores With Recidivism: Logistic Regression and AUC Results
Note. AUC = area under the curve; YASI = Youth Assessment and Screening Instrument; B = standardized beta; OR = odds ratio; CI = confidence interval.
*p < .05, **p < .01, ***p < .001.
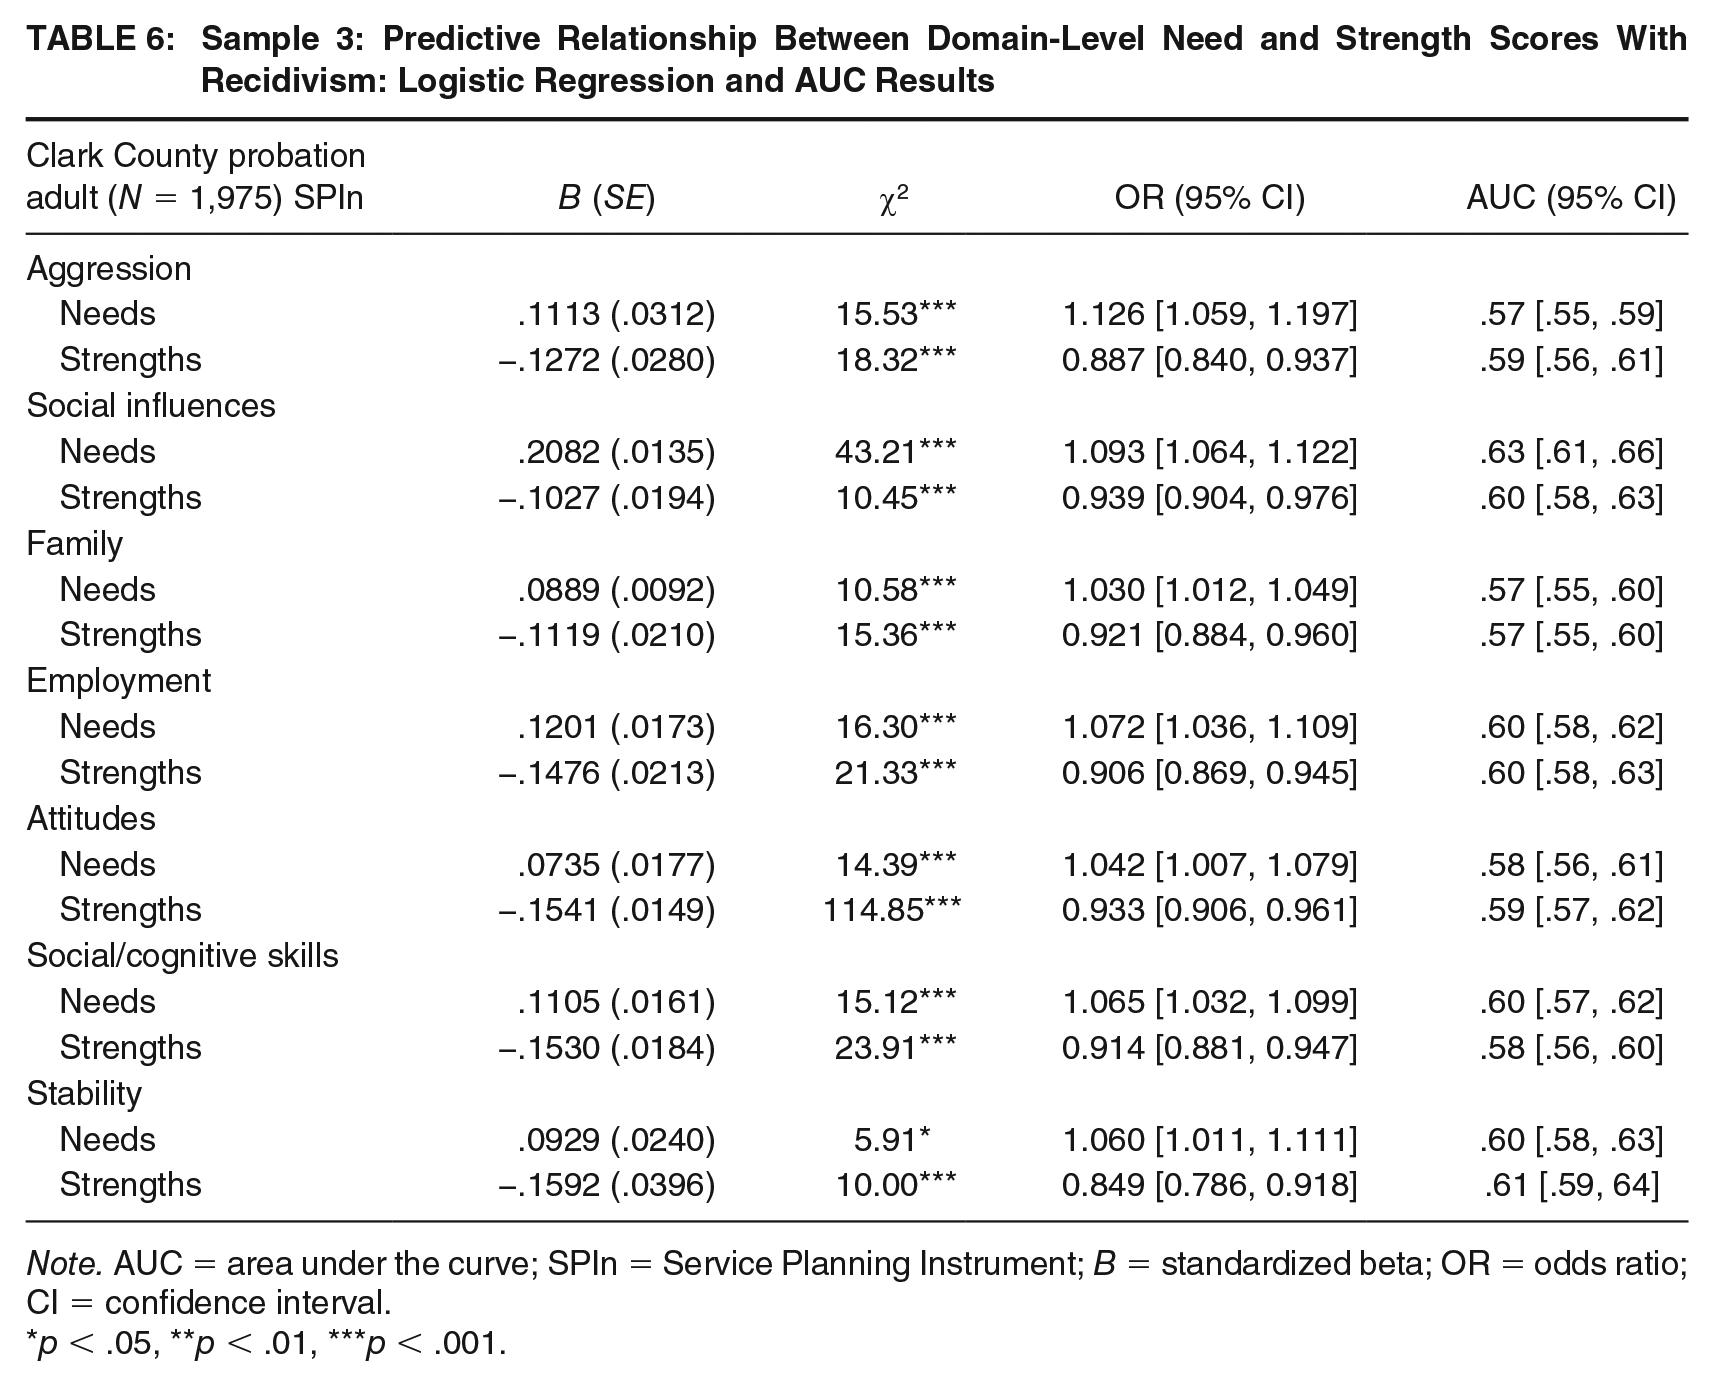
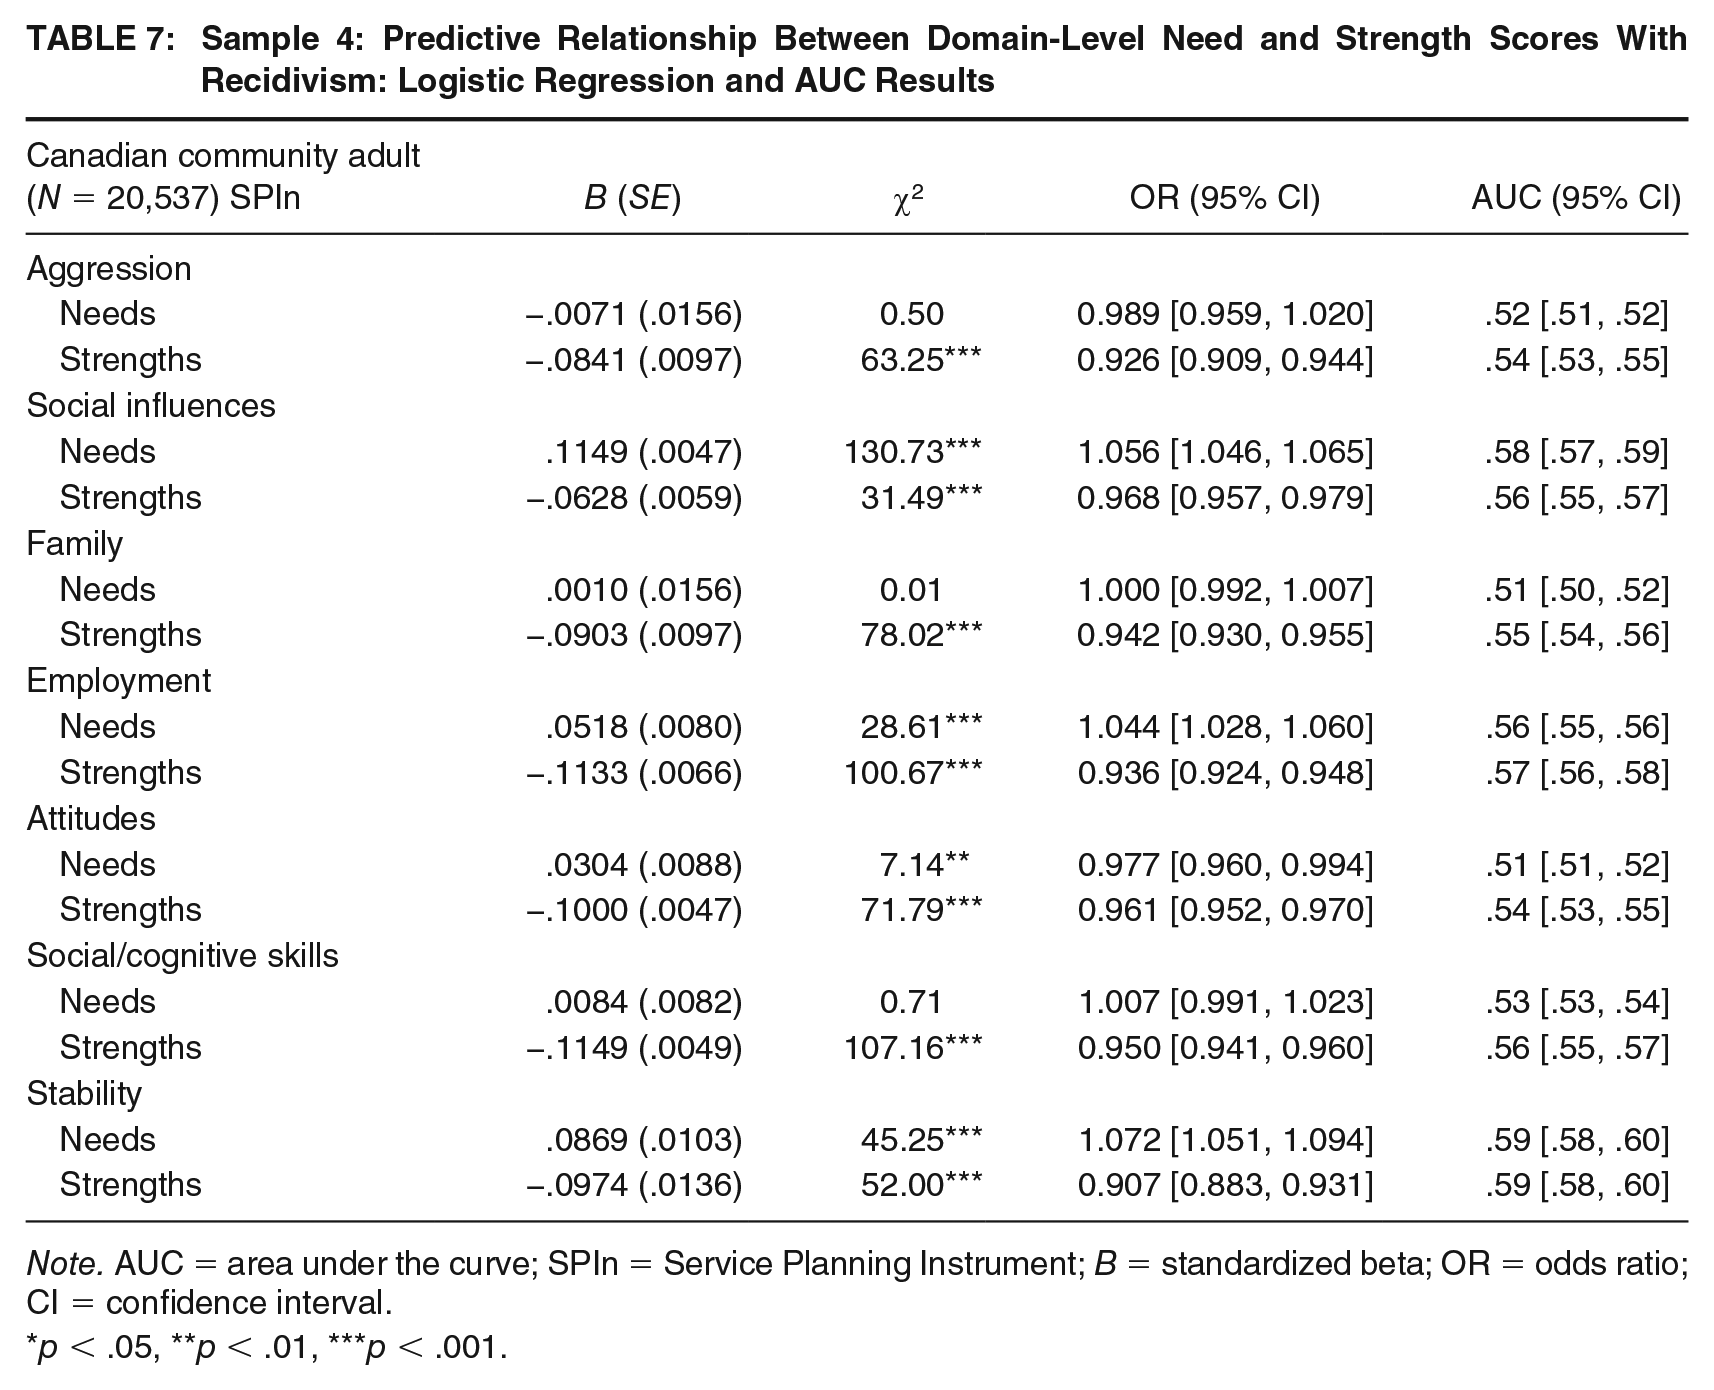
In contrast to the pattern observed in the youth samples, the results displayed for the adult SPIn samples (see Tables 6-8) indicate that strengths provided incremental predictive value for the aggression domain. Table 6 for Sample 3 data (Clark County probation adult) reveals significant incremental effects for strength domains in all seven models. With one exception (social influences), the standardized estimates and ORs suggested that strengths scores (OR = 0.907–0.968) exerted more influence than needs (OR = 0.989–1.072) in the models. The results were corroborated for Sample 4 (Canadian community adult) as all seven logistic regression models produced independent effects for strengths (see Table 7). Need scores failed to yield significant incremental effects for the aggression and social/cognitive skills. Consistent with Sample 3, strength scores (OR = 0.907–0.968) carried greater weight than needs scores (OR = 1.044–1.000) in all of the predictive models with the exception of social influences.
Sample 3: Predictive Relationship Between Domain-Level Need and Strength Scores With Recidivism: Logistic Regression and AUC Results
Note. AUC = area under the curve; SPIn = Service Planning Instrument; B = standardized beta; OR = odds ratio; CI = confidence interval.
*p < .05, **p < .01, ***p < .001.
Sample 4: Predictive Relationship Between Domain-Level Need and Strength Scores With Recidivism: Logistic Regression and AUC Results
Note. AUC = area under the curve; SPIn = Service Planning Instrument; B = standardized beta; OR = odds ratio; CI = confidence interval.
*p < .05, **p < .01, ***p < .001.
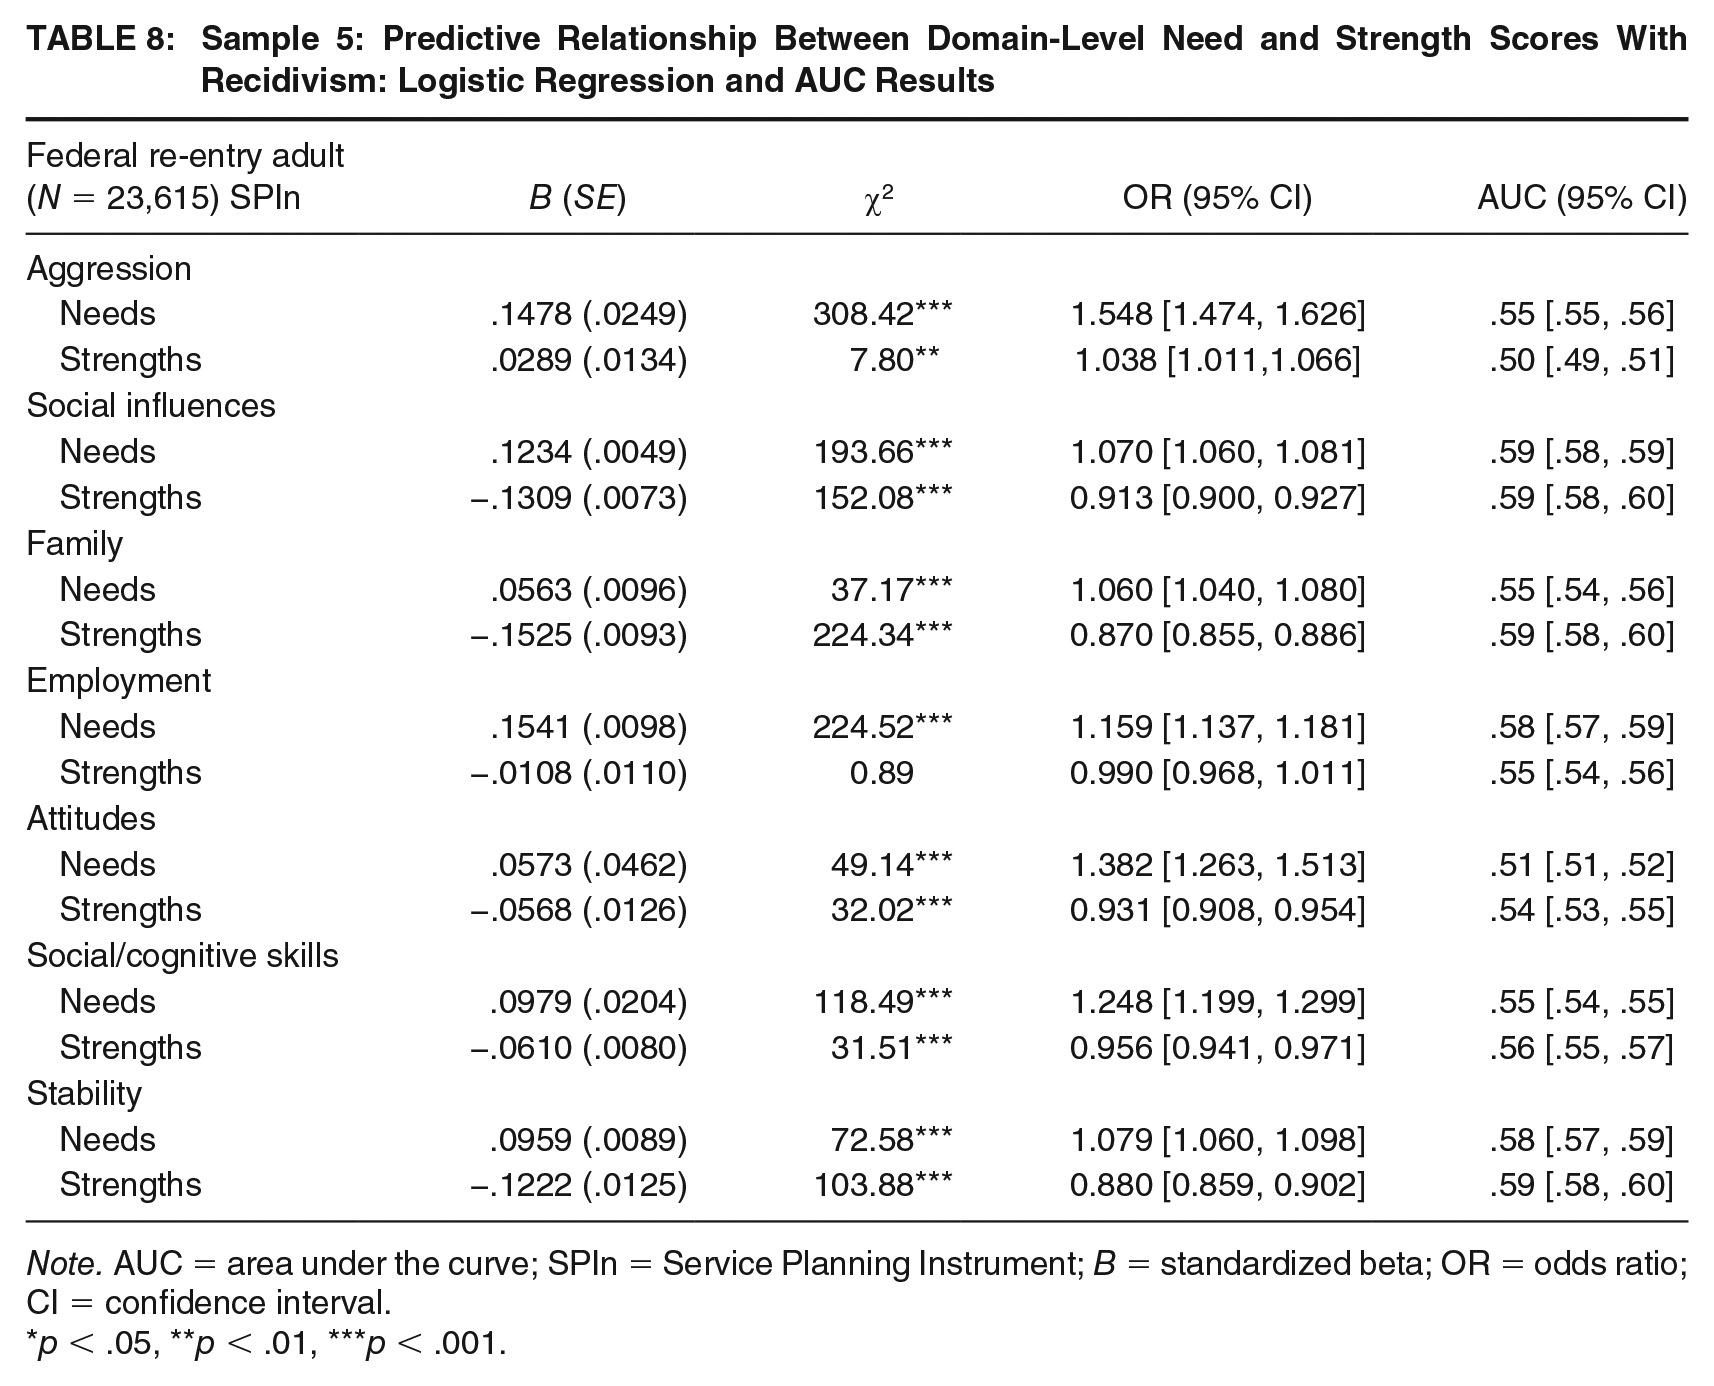
Table 8 presents statistics for the logistic models generated for Sample 5 (Federal re-entry adult) employing a streamlined version of the SPIn Full Assessment. Recall that the re-entry outcome for the re-entry sample was based on short-term outcomes (i.e., return to custody over an average 4-month period) rather than the longer community follow-up outcome data. Nonetheless, the pattern that emerged mirrored the results obtained for the adult probation samples. Only the model for the employment domain failed to produce a significant incremental effect for strengths. Of the six models for which strengths was retained, needs (aggression, attitudes, social/cognitive skills) carried more predictive power in three cases and strengths was more influential in the three remaining models (social influences, family, stability). Although the data produced for the re-entry sample were based on an abridged version of SPIn with fewer items, the results imply that the measures of strength and need performed equally well in comparison with the more comprehensive parent measure reported for Samples 3 and 4.
Sample 5: Predictive Relationship Between Domain-Level Need and Strength Scores With Recidivism: Logistic Regression and AUC Results
Note. AUC = area under the curve; SPIn = Service Planning Instrument; B = standardized beta; OR = odds ratio; CI = confidence interval.
*p < .05, **p < .01, ***p < .001.
Discussion
This study examined the predictive validity of dynamic criminogenic needs and dynamic strengths as measured by the YASI (Orbis Partners, 2000) and the SPIn (Orbis Partners, 2003). Specifically, the study explored (a) the ability of an aggregate measure of dynamic strengths to demonstrate incremental predictive validity—or an incremental promotive effect—above and beyond an aggregate measure of dynamic criminogenic needs; (b) if the aggregate measure of dynamic strengths would interact with the aggregate measure of dynamic criminogenic needs such that the presence of strengths would attenuate the effect of dynamic criminogenic needs, also known as a risk-based protective effect (Farrington et al., 2016); and (c) which specific strength domains (e.g., holds positive attitudes toward law) would demonstrate an incremental promotive effect above and beyond parallel need domains (e.g., holds negative attitudes toward the law). Collectively, the analyses involved 6,445 justice-involved youths and 46,127 adults (combined N = 52,572) assessed in five different jurisdictions from Canada and the United States.
The current findings offer consistent evidence of an incremental promotive effect of strengths when included alongside needs in models designed to predict recidivism. Results held in two youth and two adult community supervision samples (both with diverse ethnic profiles), and a supervised federal re-entry population. While most of the research on promotive effects and innovations in strength assessment has emerged from youth applications, the current data suggest that strengths are equally important in assessment with adult samples. The findings also corroborate previous investigations that have used the YASI and SPIn with other samples (Jones et al., 2015, 2016; Jones & Robinson, 2018). Finally, the results supply persuasive support for the position that the incorporation of strengths in criminal justice assessment tools is worthy of expanded development and further empirical exploration.
The most robust evidence of the independent promotive impact of strengths was derived from models comparing measures of cumulative dynamic strengths against cumulative dynamic criminogenic needs. Notably, in all five samples, a promotive effect of strengths was confirmed. The data also produced results showing incremental promotive effects when examining YASI and SPIn need/strength domain pairs. Across 35 predictive models where domain pairs were evaluated, strengths evidenced an incremental effect in 30 models. Given that a considerable degree of correlation would be expected when examining needs and strengths within a single domain, it could be argued that the domain-level analysis represents a relatively strenuous test of the position that strengths represent independent constructs.
Importantly, significant interaction effects emerged in two of the three adult samples, but not in any of the youth samples. Further probing of the interactions revealed that in the Canadian adult community sample, strengths reduced the predicted probability of recidivism among low- and moderate-need groups, but had virtually no effect among the higher need groups. This finding is partially consistent with Jones et al. (2015) who reported that higher strength scores (obtained from the SPIn Pre-Screen rather than the full SPIn assessment) reduced the probability of reoffending in both the low- and high-risk groups (as determined by the SPIn Pre-Screen). In contrast, in the federal re-entry sample, strengths increased the probability of success across all need levels; however, the effect was slightly more pronounced in the low- and moderate-need groups in comparison with the high-need group. The inability to find an interaction effect with our youth YASI samples was surprising given that Jones et al. (2016) previously reported an interaction effect with a considerably smaller sample (N < 500). Furthermore, in contrast to our SPIn study results, Jones et al. (2015) observed that the presence of high strengths reduced reoffending among the higher risk group but had virtually no impact on the lower risk group.
The inability to consistently find significant interaction effects across all of our samples could be due to several reasons, but one probable explanation is sample size. Finding significant interactions is particularly difficult as the magnitude of most interaction effects is small, thus requiring considerably large samples to permit detection (Hayes, 2018). This hypothesis is plausible given that the two significant interactions to emerge in our study involved data sets with sample sizes in excess of 20,000. However, significant interactions with considerably smaller sample sizes have been found (e.g., de Vries Robbe et al., 2013; Jones et al., 2016). Whether these discrepant findings are due to measurement, statistical artifacts, sample characteristics, or some other unknown moderator requires exploration.
The inconsistent nature of how the interactions functioned in our study as well as past research (de Vries Robbe et al., 2013; Jones et al., 2015, 2016) is more challenging to explain, however. When interaction effects have been observed, they have illustrated that strengths (a) can lower recidivism across all risk and/or need levels as in the American adult re-entry SPIn sample results from this study, and the SPIn study conducted by Jones et al. (2015), (b) can lower recidivism among higher risk cases only (de Vries Robbe et al., 2013; Jones et al., 2016), or (c) can lower recidivism among lower need cases only (the Canadian adult community sample from this study). Once again, whether these inconsistent effects are due to sampling characteristics, measurement choice, random error, or statistical artifacts (e.g., different statistical methods used to probe interactions, floor effects—high-risk individuals may have fewer strengths) requires investigation. In addition, this study only explored interaction effects between cumulative measures of needs and strengths; thus, only risk-based protective effects were examined. Interactive protective effects between specific combinations of risk/needs and strengths requires exploration. However, this research must be theory-driven. For example, if we were to have explored every possible interactive protective effect, we would have tested 245 separate interactions (49 different need/strength combinations per sample). An example of theory-driven interactive effects is currently under way (Wagstaff et al., 2019).
One clear implication of the observed interaction effects of strengths is that risk management can be improved in two circumstances. First, improvements could emerge among lower risk clients who would receive classifications resulting in false negatives. Second, improvements could emerge among higher risk clients who would receive classifications resulting in false positives. For example, a low-risk client with simultaneous low elevations on strengths may not possess sufficient personal assets and other resources to remain low risk over time. Conversely, a low-risk client with simultaneous high elevations on strengths would have a higher probability of remaining low risk over time. Similarly, moderate- and high- risk/need clients with co-occurring high-strength levels may be more likely to reduce his or her risk/need level over time. Many users of the YASI and SPIn have found that actively incorporating information from both needs and strengths frequently provides helpful information in evaluating whether a client is a candidate for an override.
In making sense of the notion that strengths exert incremental effects on recidivism when considered in tandem with dynamic risk factors, it is helpful to return to the alternative position that strength measures are simply the flip side of risk or need factors. The premise that the measurement of dynamic or static risk renders the measurement of strengths redundant is based on the assumption that high elevations on risk/need indices are synonymous with low strengths. In regard to the YASI and SPIn, this axiom holds true within individual items; it does not necessarily hold true within an entire domain (comprised of multiple, independently scored items), or across independently scored domains. The redundancy argument would also seem to imply that an absence of risk/need factors at a global or domain level automatically denotes the presence of strength. These are, in fact, untested empirical questions. Furthermore, the design of the YASI and SPIn was based on the definition that strengths represent the presence of concrete behavioral, cognitive, attitudinal, and social assets that can be detected through assessment, regardless of an individual’s risk status. This conceptualization allows the possibility that some criminal justice clients possess a preponderance of risk factors while also manifesting moderate or high levels of strengths. Correspondingly, individuals presenting few or no risk factors might display insufficient levels of strengths to sustain their low-risk status. Such seemingly inconsistent profiles under the assumption of redundancy are not only possible at the aggregate measurement level but can also appear at the domain level using the YASI and SPIn.
For example, individuals may have a combination of antisocial and prosocial peers in their social network, negative family experiences (e.g., domestic conflict) and positive familial contacts (e.g., supportive family of origin), a mix of positive adaptive skills alongside skill deficits, and a combination of constructive and problematic circumstances in the school or employment domains. Moreover, the YASI and SPIn devices permit the identification of justice-involved persons who possess no significant personal or social assets while also exhibiting no appreciable risk factors. Perhaps the most compelling benefit of the assessment strategy employed by the YASI and SPIn is that strengths are measured at the item level. With this design feature, there is no assumption that an absence of a need at the indicator level automatically translates into the presence of strength for that particular indicator; similarly, an identified need at the indicator level within a particular domain does not preclude the occurrence of one or more identified strengths (at the indicator level) within that same domain.
Apart from the quantitative characteristics reported here, instruments that include strengths support a strength-based approach to case management. Consistent with GLM, this is a refreshing paradigm in that the criminal justice client is not only briefed on the problems, deficits, troubles, and risks he or she presents, but also introduced to the positive personal attributes that may help them combat some of their problems and protect them from future negative outcomes. Informal feedback from jurisdictions employing the SPIn and the YASI confirms that giving clients affirmative feedback about their personal assets promotes engagement and increases motivation to work on the case plan. The ability to monitor strengths through reassessment also offers case managers a critical tool to keep attention on any positive gains made by the justice-involved client so that progress can be rewarded and reinforced. While many case management practitioners inherently follow a strength-based approach without the use of formal strengths assessments, we propose that unless strengths are part of the assessment process, many case managers will overlook the positive benefits that arise when strengths are a deliberate focus. Furthermore, skepticism notwithstanding (e.g., Baird, 2009) it appears that forensic decision makers in general have readily embraced the importance of measuring strengths in practice. Singh et al.’s (2014) recent worldwide survey of forensic decision makers revealed that a purely strength-based measure—the SAPROF (de Vogel et al., 2009)—was among the top 12 commonly used violent risk assessment tools used around the globe.
Consequently, further strength-based theorizing and empirical investigations using various tools and populations (e.g., girls, women, diverse ethnicities) must continue to better inform how strengths should be used in practice. One pressing avenue of exploration is the empirical identification of factors that are truly mixed—can be either a need or a strength—(Farrington et al., 2016) versus risk factors that have no valid strength pole or strength factors that have no valid risk pole. For example, there is debate regarding whether the absence of substance abuse/presence of sobriety can function as a strength; while some researchers do conceptualize the absence of substance abuse/presence of sobriety as a strength (see a meta-analytic review by Scott & Brown, 2018), some instruments (e.g., YASI, SPIn) do not. In addition, it is largely unknown whether there are certain “pure” strength factors that only exhibit promotive or protective effects when present but do not elevate recidivism likelihood when absent. Potential candidates might include factors such as religion, positive emotions, and general self-efficacy.
Theoretically, it may also be advantageous for the corrections field to rethink the requisite empirical litmus test for a true protective/buffering effect. The origins of traditional buffering definitions emerged in the context of resilience research, among studies of truly at-risk samples who were exposed to adversity but had not necessarily penetrated a system of care, be it justice, health, or social services. Arguably, corrections populations are no longer at risk as they have already penetrated the justice system; even the “low-risk” individual has surpassed the at-risk designation. Thus, even if strengths only consistently demonstrate an effect among “low-risk” individuals, we argue that this should still constitute an observed protective effect.
Highly accessible techniques such as conditional process analysis with high statistical conclusion validation are emerging. These techniques are advantageous in that they allow researchers to formally test for interaction effects without arbitrarily making continuous variables dichotomous (see Hayes, 2018). Researchers who seek to further explore interaction effects are encouraged to employ these more recent methods.
This study was not without limitations. Despite having a large sample (50,000+), our analyses were broad-based and could not address more theoretically driven, nuanced-based analyses on subsamples (e.g., younger vs. older, women, girls, Indigenous, African American, Hispanic, violent subpopulations). Nor did we examine specific interactions between need and strength domain pairs. These are all pressing areas for future research.
In sum, this study provides clear evidence that strengths do matter in the context of risk assessment. Importantly, the importance of strengths robustly permeated a range of correctional populations, youthful and adult alike. Nonetheless, ongoing debates and unresolved empirical questions persist that warrant thoughtful attention from the research community.
Footnotes
Authors’ Note:
David Robinson is director of Assessment, Orbis Partners, a company that provides the Youth Assessment and Screening Instrument (YASI) and the Service Planning Instrument (SPIn) as case management tools to criminal justice clients.