
Abstract
Identifying impediments to learning can help both instructors and students. In this study students (N = 222) from across the nation listed concepts from research methods they found the most challenging—“potholes” or impediments to learning, and also rated the difficulty of various concepts from the class. We also measured student attitudes and perceptions of the course. Our results showed validity is one of the hardest concepts for students to understand in RM. Not surprisingly, within a list of concepts in research methods, students tend to be tripped up by terms of similar grouping. Perceptions of a research methods course was strongly related to the students’ attitudes and canonical correlation analysis revealed several important findings from our data set. For example, we found that when students perceive more value, expectancy for success, cognitive strategies, and resources management strategies, they are less likely to be challenged by the concepts of samples and variables and threats to internal validity. Our findings provide a clear map of student potholes in research methods courses and suggest ways to change student attitudes about the same.
Research methods (RM) in psychology, either as a dedicated course or embedded in introductory psychology courses, is required of all psychology majors (Roberts, 2016). The American Psychological Association (2013) highlights that one of the five learning goals for undergraduate psychology majors is “scientific inquiry and critical thinking,” and that “students completing foundation-levels course should learn basic skills and concepts in interpreting behavior, studying research, and applying research design principles to draw conclusions about psychological phenomena” (p. 15). RM instructors who are often seasoned researchers certainly understand this important learning goal and are often excited about teaching RM, a course they know undergraduate students can benefit from taking (Gurung & Stoa, 2020). However, student perceptions toward RM are often negative, characterized by heightened anxiety due to perceived difficulty of RM (Harlow et al., 2009), low enjoyment in conducting research (Vittengl et al., 2004), and devaluation of research and statistical skills (Ciarocco et al., 2013; Sizemore & Lewandowski, 2009). Challenging concepts in RM courses, student attitudes toward RM, and perception of skills (e.g., experimental designs, statistics) learned from RM courses may explain the disconnect between instructor and student attitudes to RM.
RM is a unique course compared to other psychology courses such as clinical psychology and personality psychology. Concepts in RM, such as different types of validity and research design, are abstract and may be hard to relate to, because students often do not have hands-on research experience and cannot see the research application in the real world (Ciarocco et al., 2013; Vittengl et al., 2004). Challenges in teaching RM stem from students’ inability to (a) think through proper hypotheses, randomization, control conditions, double-blind testing, counterbalancing, power, sample size, experimenter effects, and demand characteristics for experimental studies, and (b) implement controls for non-experimental studies (McKelvie & Standing, 2018). Students may perceive certain topics to be “potholes,” impediments on their road to learning the material. No empirical research to date has examined specific RM concepts that students perceive challenging. What are students’ potholes? Understanding the challenging concepts in RM from a student perspective, as well as measuring levels of perceived difficulty, can inform effective course design which can help students tackle these challenges successfully.
In addition to challenges in teaching and learning RM, student attitudes and course design may influence learning outcomes in RM and thus explain the disconnect between instructors’ and students’ expectations. Instructors typically assume that RM promotes scientific and critical thinking, yet these learning outcomes might be lost on students with negative attitudes toward statistics and research (Ciarocco et al., 2013; Sizemore & Lewandowski, 2009). Specifically, Sizemore and Lewandowski (2009) found that after completing a RM in psychology course, students of different abilities all perceived research and statistics as less useful than they did before the course. Unexpectedly, the students who perceived a higher ability in RM had even worse attitudes toward research and statistics.
Additional research has now delved into how course design can potentially contribute to the decline in student attitudes toward RM. Several experimental and quasi-experimental studies indicated that the implementation of pedagogical tools, such as applied projects (Harlow et al., 2009), replication projects (McKelvie & Standing, 2018), and multifaceted active learning activities (Ciarocco et al., 2013), could enhance student attitudes and motivation toward RM. Although these studies revealed a close link between student attitudes and course design, it is unclear as to whether student attitudes and course design both play a role in student perceptions of challenging concepts and learning outcomes (e.g., levels of learning and enjoyability).
Different institutions and instructors have different requirements regarding research design (e.g., allow only experimental or descriptive and correlational as well), data collection (e.g., having students collect data or provide data), and data analysis (e.g., statistical software, Gurung & Stoa, 2020). Because there are unique challenges and student attitudes associated with data collection and certain research designs (McKelvie & Standing, 2018; Roberts, 2016), investigating these factors can inform better teaching practices in RM for tackling undergraduate psychology students’ roadblocks on the journey to achieve the “scientific injury and critical thinking” learning goal (APA, 2013).
Our study sought to uncover student potholes to learning in RM with an aim to address where and why students get tripped up, as well as how we may give them a hand. Specifically, we sought to answer the following research questions: What are the potholes (challenging concepts) in RM courses from student perspective? How do student attitudes (e.g., goals and value beliefs) and course design relate to perceived difficulty of potholes in RM courses? What is the association between potholes, student attitudes, and learning outcomes in RM courses?
Method
Participants
We collected data nationwide from U.S. undergraduate students enrolled in a RM course in psychology at their corresponding universities. Our sample consisted of 222 students, broken down into 56 females, 17 males, one other, and 148 who did not respond to this question. Students ranged in age from 18 to 53 (M = 21.48; SD = 5.33). The largest percentage of the students in this sample who reported ethnicity were either White (23.0%) or Asian (6.8%). Participants’ previous high school GPA ranged from 2.00 to 4.89 (M = 3.67; SD = .50). We did not collect data on where the participants were enrolled in school.
Materials
To gather participant perceptions of the potholes or most challenging concepts in RM, we asked participants to write down up to five concepts that they found challenging. Participants then rated the difficulty of 63 research methods concepts (e.g., confound, effect size) using a scale of 1 (not at all) to 5 (a great deal). These concepts were derived from two past studies of difficult terms in RM (Gurung & Landrum, 2013; Gurung & Stoa, 2020). Specifically, Gurung and Stoa (2020) asked instructors to rate the importance of teaching 25 topics (e.g., sources of information, ethics, APA style writing, confounding variables). Gurung and Landrum (2013) had students rate the difficulty of and their confidence in their own knowledge of 107 terms relating to introductory psychology RM and learning. We removed overlaps to select the final set of terms relating to RM. We list all terms in Table 1.
Example Statements and Reliability of the Motivated Strategies for Learning Questionnaire Subscales.

We used the Motivated Strategies for Learning Questionnaire (MSLQ, Pintrich et al., 1991) to assess student attitudes. This survey consists of 81 items, broken into 31 items assessing student goals and value beliefs of a course, skill to succeed in a course, and anxiety about tests, 31 items examining student use of different cognitive and metacognitive strategies, and 19 items addressing student management of different resources. In total, there are five major subscales broken down further into 15 different subscales. Participants completed this self-report on a scale of 1 (not at all like me) to 7 (very like me). We list the subscales, example statements, and means in Table 1.
We asked students to select one or more choices regarding how their course was conducted: (a) students conduct their own research (experimental design required), (b) students conduct their own research (correlational design required), (c) students use data provided (original research not conducted by students), and (d) no data analyzed by students. We also asked what statistics program participants used.
Finally, we measured general demographics and perceived learning outcomes. We asked how much the participants felt they learned from the course, how enjoyable the course was, and how difficult the course was, using a scale ranging from 1 (none at all, extremely unenjoyable, or extremely easy) to 5 (a great deal, extremely enjoyable, or extremely difficult). We also asked students to list their recalled high school GPA and ACT scores, as well as their best guess at their final grade in the course.
Procedure
After the study was approved by the university’s Institutional Review Board, we used electronic mail invitations to instructors who had signed up on the Hub for Intro Psych and Pedagogical Research (HIPPR), and invited reviewers for SAGE Publishing who had given their consent, as well as other known instructors of RM in psychology across the U.S. Instructors were asked to pass the survey on to their students in their RM courses. All surveys were online and created using Qualtrics software. Participants first read a consent form, then wrote in the concepts they found challenging, rated the difficulty of concepts, completed the MSLQ, questions on course design, and general demographics. The entire survey took approximately 15 minutes. There was no reward for participation in the study but instructors passing on the survey could allow students to gain course research credit for participation. We did not assess whether rewards were provided.
Results
Determining Student Potholes
We asked students to give us up to five concepts that they felt challenged by in RM. Students wrote in a total of 225 items. After eliminating duplicates, 100 unique terms remained. Students mentioned types of validity most often, peaking at 21% (48 of the write-ins). This includes construct validity, which by itself was one of the most frequent replies, reaching 5.3% of all responses. Students also commonly noted the following concepts: quasi-experiments (5.8%), general knowledge of statistics (4.8%), and operational definition (4%). To visualize this data, we created a word cloud of all terms, with the larger words being the terms that occurred more often (Figure 1).
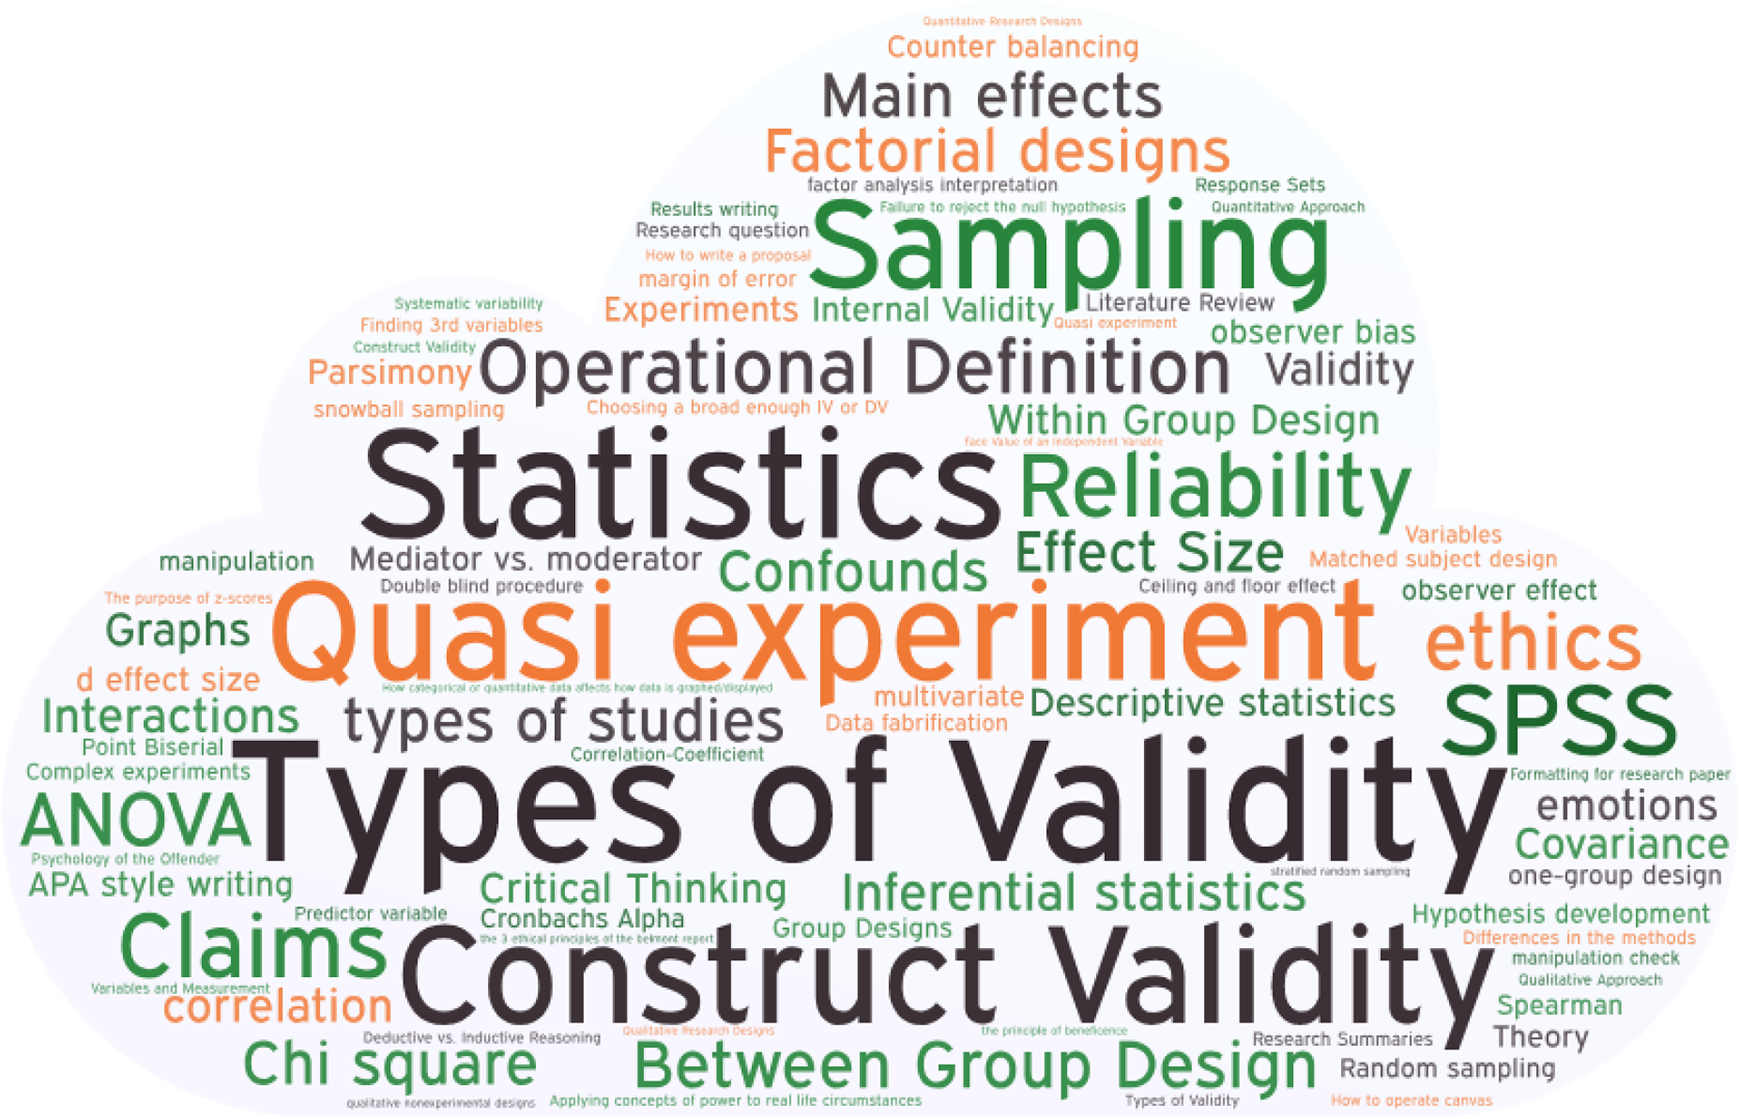
Word Cloud of Challenging Terms.
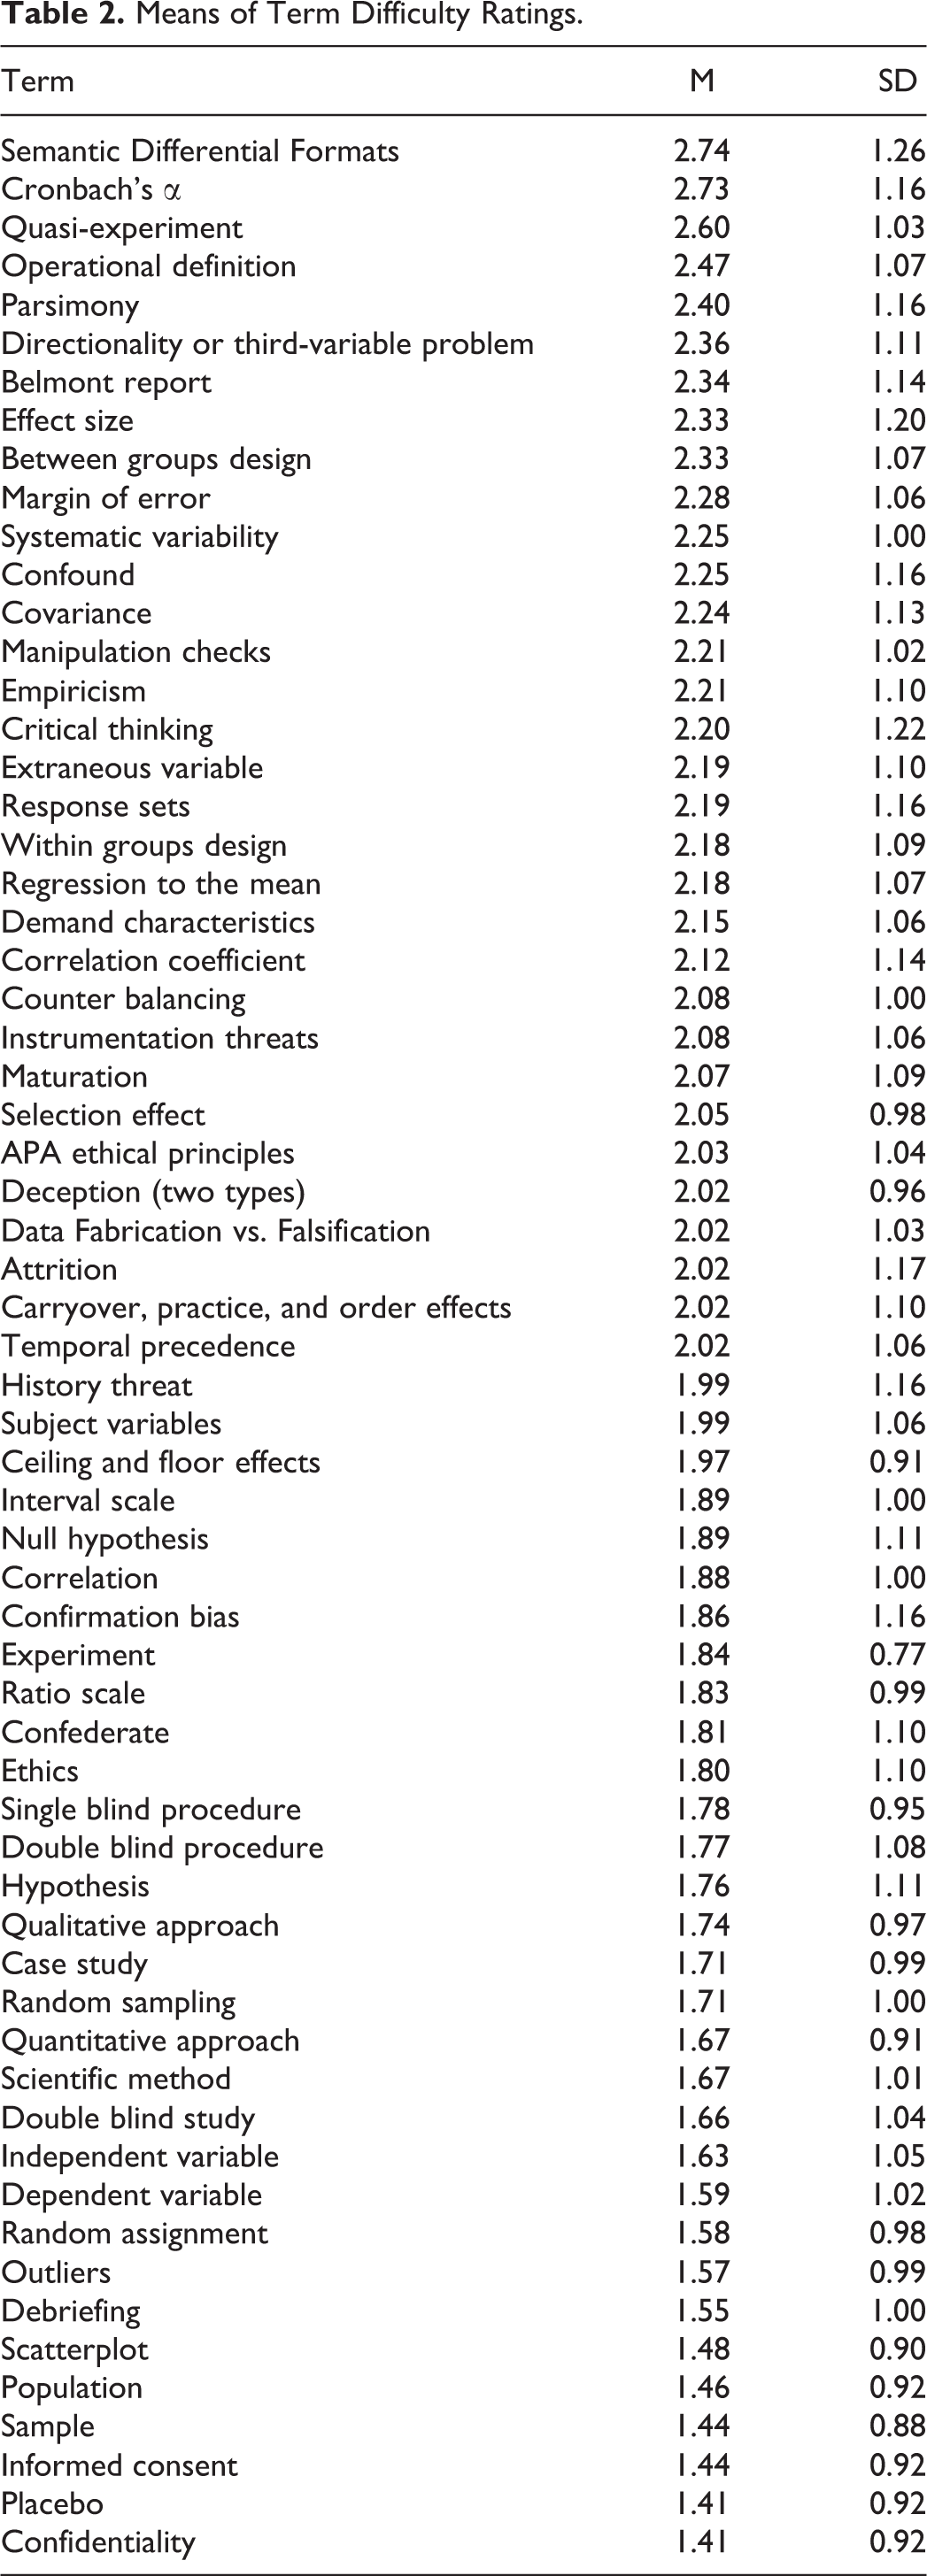
When given a list of terms from RM, students rated quasi-experiments (M = 2.60; SD = 1.02) and operational definition (M = 2.47; SD = 1.07) in the top five most difficult concepts. However, semantic differential formats (M = 2.74; SD = 1.25) and Cronbach’s α (M = 2.73; SD = 1.15) now topped the list. The top five difficult concepts also included parsimony (M = 2.40; SD = 1.15). The means and standard deviations of all 63 difficult terms can be found in Table 2.
Means of Term Difficulty Ratings.
Because we expected many of these terms to be related thematically, we conducted a principal components analysis with varimax rotation to determine if there were smaller sets of factors in the 63 topics, acknowledging that our small sample size might limit the interpretations of any findings. With all 63 topics, the Kaiser-Meyer-Olkin measure was slightly above the commonly acceptable threshold of .50 (KMO = .604), suggesting widespread correlations within our data which might not be a problem for a factor analysis, but should be interpreted with caution (Cerny & Kaiser, 1977). The Bartlett’s Test of Sphericity, which tests the overall significance of all the correlations within the correlation matrix, was significant, χ2 (1953) = 5144.44, p < .000, indicating that the variables were related, and that meaningful factors might emerged from our data. We performed an initial analysis with the criterion set at eigenvalue > 1 and examined the rotated factor matrix using varimax rotation. Fifteen factors had eigenvalues over Kaiser’s criterion of 1 and in combination explained 82.1% of the variance. The scree plot revealed a justification to retain three, four, or five factors. We retained five factors as they were deemed thematically appropriate. These five factors explained 57.2% of the variance.
Given our small sample we only used the results of the principle components analysis as a starting point to inductively label the five factors for further analysis: (a) Factor 1—items related to Samples and Variables (SV) (terms included random assignment, population, sample, dependent variable, random sampling, independent variable, scatterplot, quantitative approach, scientific method, outliers, subject variables, and confounds, dependent variable, independent variable, scatterplot), (b) Factor 2—items related to Ethics and Theory Data Cycle (ET)(terms include debriefing, informed consent, confidentiality, double blind procedure, ethics, hypothesis, correlation, experiment, critical thinking, case study, and confirmation bias), (c) Factor 3—items related to Threats to Internal Validity (Threats)(terms include attrition, regression to the mean, instrumentation threats, maturation, history threat, demand characteristics, quasi-experiment), (d) Factor 4—items related to Design Confounds (terms include systematic variability, selection effect, operational definition, extraneous variable, and directionality or third-variable problem), and (e) Factor 5—items related to Scale Measurements (terms include semantic differential formats, Cronbach’s α, response sets, margin of error, and correlation coefficient).
We combined items within each factor into an aggregate score for further analyses. Each factor showed high internal reliability: SV Cronbach’s α = .95; ET Cronbach’s α = .93; Threats Cronbach’s α = .91; Design Cofounds Cronbach’s α = .84; and Scale Measurements Cronbach’s α = .83. Bivariate correlations showed that factors were all moderately correlated (r(91) ranged from .26 to .59, p < .05) with each other. This factor analysis was largely exploratory, and these findings should be interpreted with caution only serving as a guide until tested with a larger sample size. The complete factor loading with terms can be found here: https://osf.io/87hr6/?view_only=c0dda905c05a4022bdc3e56f641b9fbf.
Predicting Potholes in Research Methods
We first tested whether the perceived difficulty of the five factors were related to student attitude, ability, and course design. To test if attitudes for learning associated with perceived challenge in RM, we conducted a bivariate correlation using our five factors (SV, ET, Threats, Design Confounds, and Scale Measures) and the five large components of the MSLQ. Nearly all MSLQ components were negatively correlated with our factors. As the student attitude factor increased, the student tended to find the concepts of those factors less challenging. No significant correlations were found between ET and any of the MSLQ components, nor Affective Components and MSLQ. Complete correlations can be found in Table 3.
Correlations of MSLQ Subscales and Factor Loadings.
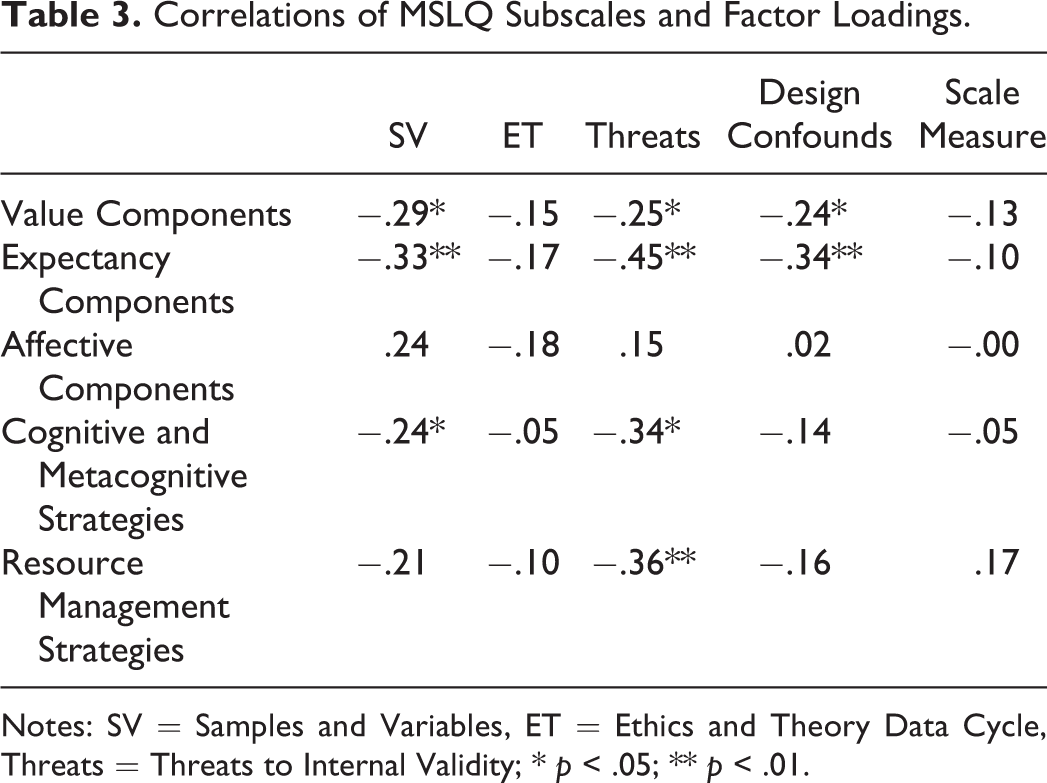
Notes: SV = Samples and Variables, ET = Ethics and Theory Data Cycle, Threats = Threats to Internal Validity; * p < .05; ** p < .01.
Next, we tested if course design correlated with perceived understanding of difficult terms. We conducted a multivariate analysis of variance (MANOVA) with our created factors (SV, ET, Threats, Design Confounds, and Scale Measurements) as the dependent variable and course design as the independent variable. Course design was categorized as one of three levels: Having taken a course where the student conducted their own research (either experimental or correlational), a course where data was provided for analysis, or a course where no data analysis was required. No significant differences were found.
Finally, to test the associations between ability and these factors, we performed bivariate correlations between the factors that we created and self-reported high school GPA and ACT scores. None of the factors were significantly correlated with ACT scores or GPA.
Testing Associations Between Potholes, Attitudes, and Course Perceptions
First, we tested if potholes related to perceptions of the RM course. We performed correlational analyses between the five created factors and enjoyment, difficulty, and amount learned. There was a negative correlation between threats and amount learned (r(73) = −.24, p = .039), and design confounds and amount learned (r(73) = −.38, p = .001), indicating an association between understanding these topics and overall learning in the course. An ANOVA with anticipated final grade as the independent variable and the five challenge factors as the dependent variables revealed a significant finding between SV, F(2, 72) = 3.69, p = .030, Threats, F(2, 72) = 10.95, p < .001, and Design Confounds, F(2, 72) = 3.96, p = .023. A Tukey post hoc test revealed significant differences in the difficulty of Threats; specifically between C (2.91 ± .92) and A(1.82 ± .61, p < .000) and B (2.29 ± .63) and A(1.82 ± .61, p = .012) and Design Confounds between grades C (2.94 ± .86) and A (2.06 ± .76, p = .020). While we did not have any students report anticipating an D or F in their research methods course, our findings were nonetheless significant: The students who had a better understanding of the terms in those groups tended to feel more confident in achieving a higher grade in the course.
To examine how the five major components of the MSLQ were related to course perceptions, we conducted three simple linear regressions for each student perception of the course (difficulty, learning, enjoyability). We entered the five MSLQ subscales as a single block for this analysis. The model significantly explained 11% of the variance in difficulty, yet only variable expectancy components significantly predicted perceived difficulty (β = −.429, p = .018). Similarly, we conducted a linear regression model to predict learning from the course with the same subscales. The model significantly explained 21.0% of the variance in learning, whereas only value components significantly predicted perception of learning (β = .654 p < .001). There were no significant findings regarding the MSLQ and enjoyability. Correlations between the MSLQ scales and perceptions of the course are displayed in Table 4 (correlations of 15 subscales are available on the OSF site).
Correlations of MSLQ Subscales and Perceptions of Course.
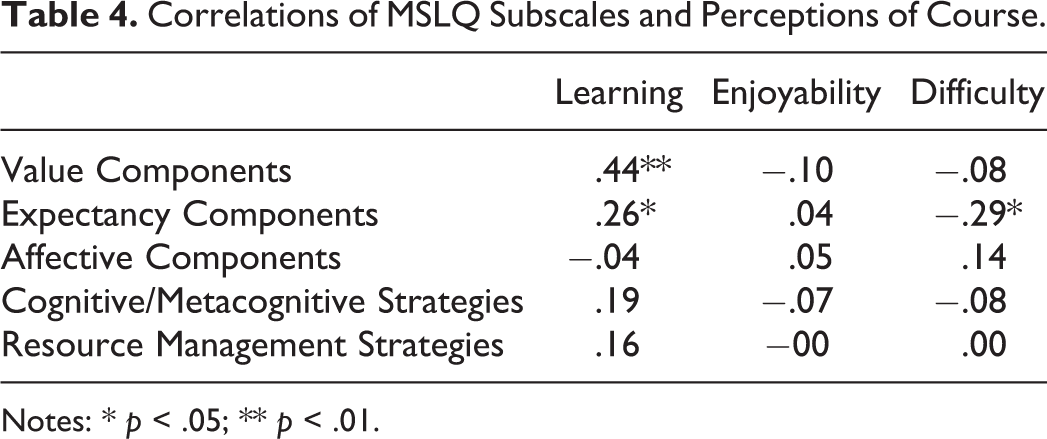
Notes: * p < .05; ** p < .01.
To evaluate the multivariate shared relationship between potholes, attitudes, and course perceptions, we conducted a canonical correlation analysis using the five MSLQ large components, the five pothole factors, and learning, enjoyability, and difficulty variables. The analysis yielded five functions with squared canonical correlations (
Given the effects for each function, only the first three functions were considered noteworthy in the context of this study (47.0%, 27.7%, and 16.0% of shared variance, respectively), even though only function one was statistically significant. The last two functions only explained 6.5% and 1.3%, respectively, of the remaining variance in the variable sets after the extraction of the prior functions.
Table 5 presents the standardized canonical function coefficients, structure coefficients, and squared structure coefficients for each variable in Function 1, Function 2, and Function 3. Looking at the Function 1 coefficients, one sees that relevant criterion variables were primarily threats to internal validity, samples and variables, and design confounds. This conclusion was supported by the squared structure coefficients. These variables also tended to have the larger canonical function coefficients. Furthermore, the structure coefficients of threats and samples and variables had the same sign, indicating that they were positively related. Design confounds were inversely related to the other factors.
Canonical Solution for MSLQ predicting Learning Outcomes for Function 1, 2, and 3.

Note: Structure coefficients (rs) greater than |.45| are bolded. Communality coefficients (h2) greater than 45% are bolded. Coef = standardized canonical function coefficient; rs = structure coefficient;
Regarding the predictor variable set in Function 1, expectancy components and cognitive and metacognitive strategies were the primary contributors to the predictor synthetic variable, with a secondary contribution by value components. Because the structure coefficient for expectancy and cognitive and metacognitive strategies was negative, these were positively related to samples and variables and threats to internal validity.
Discussion
As far as we are aware, no other research has collected a self-report of challenging terms for students in research methods. While previous research has asked students to rate the difficulty of such terms (e.g. Gurung & Landrum, 2013), this study is the first to ask students to come up with these terms on their own. To further predict challenges, we examined how student attitudes played a role in learning and the effect of course design. Results may help instructors focus on certain topics that appear to be more difficult for students to grasp, as well as strategize ways to strengthen attitudes toward learning.
While instructors may seem disheartened that students found so many terms difficult, the mere fact that they could recall a term and rate challenge of terms indicated some level of learning. Terms that the students found challenging seemed to be related, whether terms be categorized as samples and variables, ethics and theory data cycle, threats to internal validity, design confounds, or scale measurements. Combining the list of terms and write-ins, it seems that validity is one of the hardest concepts for students to understand in RM. This should be of great concern, considering the importance of validity to comprehending quality research. Whether a student goes on to conduct research or be a consumer of research, a strong understanding of the definition, types, and threats of validity is essential. Our findings suggest better practices for teaching and learning the types and threats to validity are needed.
When given a list of concepts in research methods, students tend to be tripped up by terms of similar grouping. We found those groups to be samples and variables, ethics and theory data cycle, threats to internal validity, design confounds, and scale measurement. These factors indicate a need for instruction for the terms within a group—particularly if a student has trouble with one term in the group, they are likely to have issues with another. This could be potentially beneficial in recognizing where students may struggle even if they themselves do not recognize it. Table 2 discloses each of the measured terms from most difficult to least difficult. These terms can now be given more attention in the classroom if need be.
Perceptions of a RM course was strongly related to the students’ attitudes. Attitudes were significantly correlated with a better perception of understanding of the terms in this course. Unsurprisingly, and aligning with previous research (Gurung & Stoa, 2020; Hartley & Hartley, 1976), attitudes toward the course, self-efficacy, and the belief that the student has the resources to succeed predicts less perceived challenges in RM. Our findings suggest that perhaps instructors should clarify the value of taking a research methods course to the average students’ everyday life. Doctoral and masters programs involve training in the research process, and instructors may be conditioned to believe that the key reason for students to take research methods is to understand the research process; however, if instructors are reminded that future preparation is a purpose of taking a research methods course, it is then considered the top reason (Ciarocco et al., 2017). While instructors may have high hopes that every student will go into statistics or research, students are more likely to enter a role where they will not conduct research every day. Nonetheless, it is important to know how to consume research. By connecting the dots of the content in a research methods course to everyday life, future research may find that the value component of attitude increases.
The canonical correlation analysis revealed several important findings from our data set. The first function suggests that when students perceive more value, expectancy for success, cognitive strategies, and resources management strategies, they are less likely to be challenged by the concepts of samples and variables and threats to internal validity. The second function suggests that students who perceive more value also believe they are learning more in the course, whereas the third function found that students who have greater affective components find ethics and theory data cycles less difficult.
Our findings suggest that the ideal RM student would have strong intrinsic goal orientation, task value, control of learning beliefs, and self-efficacy for learning and performance. Unfortunately, this is not how all students come to class. To improve these characteristics, instructors may focus on student autonomy and the ability to learn and apply concepts to everyday life, as establish strong inquiry skills (King, 1995). For example, exposing undergraduate students to research practices after taking a RM course (i.e. as a teaching assistant or research assistant) increases confidence, mastery of subject matter, and mentorship to other students (Thieman et al., 2009). As most students do not go on to graduate school, it is important to describe what employable skills they can garnered from this course. Instructors may do this by listing specific skills practiced in the syllabus, talking about these marketable skills on the first day of class, listing the skills practiced on each assignment, and talking about what skills were practiced on the last day of class, linking these skills directly to things they did in class as well as encouraging students to add these skills to their resume (Strohmetz et al., 2018). Focusing on integration of course material and study skills into other courses and daily life could strengthen the attitudes of students, as well as develop habits of inquiry.
Overall, student attitudes explained medium to large amount of variance in learning outcomes in RM. Predicting variables of understanding topics in research methods included high expectancy and cognitive and metacognitive strategies. Students who believe they have the necessary abilities to succeed, as well as implement study strategies such as peer learning, help seeking, finding a productive study environment, time management, and effort regulation skills tend to understand concepts in the course. For instructors, this means that it may be worth spending some time discussing studying strategies with students.
While not the primary motivation of this study, our findings regarding ACT and high school GPA are nonetheless notable. Neither ACT scores or high school GPA predicted difficulty or enjoyability of a RM course. While it has been found that high school GPA is more useful than admission test scores (such as the ACT) in predicting college GPA (Amelang, 1976; Sawyer, 2013), neither GPA or ACT score predicted success in a RM course. Several factors may have played into this, particularly that our sample tended to be high achievers, believing to receive either an A, B, or C in their RM course. A larger variety of grades would have been ideal for further analysis.
While we were still able to collect data from a spread of different course designs from different universities, our data seems to be limited to those who are either high achievers or perceive themselves to be high achievers in the course of research methods. Variability across instruction, including instructor personality and characteristics, methods, resources, and point systems could create confounding variables. Moreover, the cross-sectional nature of our study cannot be interpreted as causal relationships. While we think that attitudes influence perceived challenges and learning outcomes, it is plausible that the opposite direction occurs.
Future research should investigate the path that creates motivation for students in research methods. Knowing that the course adds value to their everyday life and feeling that they have the skill set to not only survive, but thrive, in a research methods course could make the difference in the amount that the student learns. Research should also further examine the topics considered to be bottlenecks to research methods—those concepts that disrupt learning in a significant number of students (Middendorf & Pace, 2004). More longitudinal and intervention research is needed to understand the causal relationships that predict learning outcomes in RM and the effectiveness of various teaching strategies and course designs. In the case of research methods and determined from the primary analysis of this study, validity may perhaps be a starting point. Knowing bottlenecks is just the beginning of improving the pedagogy of research methods.
In general, students who find the course to have purpose and have higher sense of self-efficacy tend to do better in the course. Identifying concepts that students find difficult as well as what motivates students to succeed should provide RM instructors with a base of information to enhance the focus of instruction and prevent students from getting tripped up in this course.
Footnotes
Declaration of Conflicting Interests
The authors declared no potential conflicts of interest with respect to the research, authorship, and/or publication of this article.
Funding
The authors received no financial support for the research, authorship, and/or publication of this article.