



Abstract
We examine the impact of the Sarbanes–Oxley Act of 2002 (SOX) and the global economic crisis of 2008 on revenue generation patterns of public accounting and law firms. Using a sample of firm-year observations from both industries, we show that since the enactment of SOX, public accounting firms have significantly increased leveraging of partner time and decreased charge-out rates to boost their revenue per partner. While law firms also exhibit an increase in revenue per partner in the post-SOX era, their increase is rooted in higher average charge-out rates and lower leveraging. During the crisis, the public accounting industry was insulated by the relatively inelastic nature of its services. By contrast, law firms suffered a decline in demand for their services, which reduced their revenue generation by reducing their charge-out rates. We also consider cross-sectional variations within each industry and find significant differences across firms in the impact of SOX and the economic crisis. Notably, large firms in both industries were more significantly impacted by SOX and the Big 4 accounting firms were adversely impacted during the crisis. Our study sheds light on the revenue generation and human resource consequences of two significant macroeconomic events for two professional service industries that serve as watchdogs in our capital markets.
Keywords
Introduction
The Sarbanes–Oxley Act of 2002 (SOX; U.S. House of Representatives, 2002) was enacted on July 30, 2002, in response to high-profile corporate scandals. There is mixed evidence regarding its net effect (Coates & Srinivasan, 2014) and usefulness to capital providers (Ogneva et al., 2007). Proponents assert that SOX improved corporate governance and higher financial reporting quality (e.g., Carcello, 2005; Cohn, 2012) and critics argue that SOX encumbered publicly traded companies with excessive costs (e.g., Ge et al., 2017; Hostak et al., 2013; J. Krishnan et al., 2008; Li, 2014). Examining these consequences continues to be of relevance, as the Congress considers relaxing provisions of SOX for certain groups of filers (U.S. Congress, 2016). In addition to studying the economic consequences of SOX for public companies, it is important to consider its effects on public accounting firms due to their governance role and impact on the capital markets (e.g., Amin et al., 2014; Amin & Harris, 2017; Menon & Williams, 2010).
Accounting firms had to rapidly adapt to the new SOX provisions which led to a significant change in their mix of activities. Extant work in this area documents that SOX was associated with an increase in fee revenue (Ghosh & Pawlewicz, 2009; Griffin & Lont, 2007; Raghunandan & Rama, 2006). However, it is unknown whether the increase in fee revenue was matched by increases in the number of professionals or partner oversight. These insights would provide a more comprehensive view of the costs and benefits of SOX for accounting firms. We address this gap by examining the effect of SOX on the components of accounting firms’ revenue generation. To calibrate the impact of SOX on the public accounting industry, we compare it with its impact on the legal services industry, which was also notably affected by SOX. Aside from both industries being impacted by SOX, we select the legal services industry due to its structural similarities with the public accounting industry. Both industries are dominated by a partnership structure, where partners are both the principals and agents that oversee professionals within the firm. As well, both industries require advanced technical knowledge and professionals must achieve licensure.
We evaluate each industry’s revenue generation using performance ratios commonly used to evaluate professional service firms (e.g., The American Lawyer, 2011; Aronson, 2007; Randazzo, 2013). Specifically, we decompose our aggregate revenue generation measure, revenue per partner (revenue / # of partners) into two distinct components. The first component, charge-out rate (revenue / # of professionals), captures the average charges billed per non-partner professional. The second component, leverage (# of professionals / # of partners), captures the relative reliance on non-partner professionals as a means to generate revenue. Disaggregating revenue per partner in this manner provides a multi-dimensional view of the firms’ revenue generation. For instance, a firm can command a higher rate for its professionals, increasing the charge-out rate and consequently, revenue per partner. Alternatively, a firm can rely on professionals to leverage partner time, allowing partners to focus on other value-added activities. This increase in leverage also allows the firm to generate higher revenue per partner while keeping costs low and employing a more efficient input mix.
Using a hand-collected balanced panel of data for the public accounting and legal services industries spanning 1999 to 2015, we document that after the enactment of SOX, 1 while both industries enjoyed an increase in revenue per partner, their increases were attributable to very different sources. For accounting firms, SOX raised the demand for standardized activities, including internal controls testing and analytical procedures (Taub, 2003; Telberg, 2011; Trompeter & Wright, 2010), and expanded the documentation requirements during fieldwork (i.e., Section 103), which can be completed by low-billed junior associates with little partner supervision (Byrnes, 2005). SOX also established the Public Company Accounting Oversight Board (PCAOB) to oversee accounting firms (Dodwell, 2008). The PCAOB’s inspections require considerable input from managers and associates to provide supporting documentation. As well, SOX expanded the accountability of CEOs and CFOs, shifting the onus of credible financial reporting toward management. Consistently, we show accounting firms increased their leveraging of partner time and decreased average charge-out rates to meet the demand for routine and standardized accounting services post-SOX.
By contrast, law firms experienced a different set of changes. SOX changed their mix of activities by increasing the demand for complex and high-risk legal services, including criminal defense and prosecution of white-collar crimes (e.g., Ribstein, 2002; Solomon & Bryan-Low, 2004; Zhang, 2007). As well, SOX provisions addressed complicated legal matters including compensation clawbacks and whistle-blower protection (Steinberg & Kaufman, 2005). SOX also established standards of professional conduct for attorneys, increasing their legal exposure. Therefore, law firms had to resort to a higher cost input mix by ramping up partner supervision to carry out complex and high-risk activities (Shostack, 1987). Consistently, we document that law firms increased charge-out rates and decreased leveraging of partner time following SOX.
We further assess both industries’ revenue generation during the global economic crisis of 2008. 2 The crisis affected clients’ corporate spending by constraining access to capital (e.g., Campello et al., 2010), potentially influencing their willingness to spend on professional services. Public accounting services (e.g., integrated financial statement audits, tax preparation, compilations, etc.) tend to be recurring in nature and often cannot be provided in-house. Thus, clients may not cut back on public accounting services during an economic downturn as they may with legal services, which tend to be more discretionary and elastic in nature. Consistently, we show that during the crisis, although revenue per partner declined for law firms, it was not significantly impacted for the public accounting industry. Moreover, during economic downturns, public accounting clients may pose a greater risk due to their capital constraints. Consistently, Hogan and Schroeder (2013) show that accounting firms’ overall portfolio presents greater financial risk during the crisis. These risks create misreporting incentives and tax avoidance behavior which may require risk premiums (i.e., higher charge-out rate) and/or increased partner supervision (i.e., lower leverage). 3 The downturn could also elevate the need for risk management and other high-level advisory services. Accordingly, we find that charge-out rates increased during the crisis, suggesting that accounting firms charged a higher price per professional. By contrast, the law firms reduced charge-out rates, consistent with lower demand for legal services during the crisis-period.
We also examine the cross-sectional variations within both industries. We expect and find that the effects of SOX are stronger large accounting and law firms, whose clients are principally public filers subject to SOX’s requirements. 4 As for the crisis, we expect Big 4 firms, who tend to charge higher fees, to face greater pressure from clients to reduce prices or risk losing clients to less expensive firms. We also expect the Big 4 to suffer during the crisis due to their reliance on the financial services sector, which was especially hard hit. Accordingly, we find that Big 4 firms had lower revenue per partner and charge-out rates during the crisis. For the legal services industry, the international law firms exhibited a steeper decline in charge-out rates but also employed a lower-cost input mix (i.e., higher leverage), to dampen the post-crisis reduction in revenue per partner.
We build on studies that examine the accounting and auditing consequences of policy (e.g., Amin et al., 2018; J. Krishnan et al., 2008; Li, 2014). Specifically, we contribute to the literature by examining the impact of SOX on public accounting and law firms’ revenue generation. Our study is incremental to prior studies on the audit engagement fee consequences of SOX in the following ways (e.g., Ghosh & Pawlewicz, 2009; Griffin & Lont, 2007; Raghunandan & Rama, 2006). First, by incorporating accounting firms’ human resources (i.e., number of professionals and partners), we provide insights about how changes in charge-out rate and leverage drove revenue generation. Higher engagement fees could result from billing higher rates and/or by deploying more resources. Our findings, that accounting firms’ leverage increased post-SOX, supports the latter explanation. As regulators weigh the costs and benefits of their policies, it is valuable to understand the intricacies surrounding fee revenue beyond whether they increased or decreased. For example, an increase in charge-out rate may indicate a risk premium for anticipated litigation risk that could not be mitigated by increasing the number of professionals.
Second, if SOX-related restrictions result in a decline in non-audit fee revenue, then accounting firms may bear a significant cost from the regulation unless the decline is offset by an increase in audit fees. By examining firm-level revenue generation, we shed light on how the firm, as a whole, is impacted. We show that revenue per partner increased post-SOX, supporting the contention in prior work that the increase in audit fees exceeded the decrease in non-audit fees (Ghosh & Pawlewicz, 2009). However, unlike previous studies, our data incorporate non-audit revenue from clients that do not concurrently engage the firm for audit services. 5 Third, we also investigate the impact of the global economic crisis to contrast firms’ response to each shock. While the passage of SOX also coincided with an economic recession in the early 2000s, comparing the different effects of SOX and the crisis highlights its regulatory implications.
Fourth, we examine the legal services industry’s response to both events. This provides a comparison group to interpret our findings and allows for a difference-in-differences specification. The two industries have not been completely independent over the years. The Big 5 held a significant market share of legal services prior to the turn of the century. Over the last decade, the large accounting firms have “rebuilt their legal networks” in emerging economies (Wilkins & Esteban, 2016). As such, a comparison of the two industries should be of interest to both academics and practitioners. We find that both industries contrast considerably in their responses to SOX and the crisis, consistent with the changing mix of activities and risk exposure resulting from those shocks. Thus, unlike most previous studies that examine one professional service industry and attempt to generalize broadly to the service sector (Von Nordenflycht, 2010), our study draws out the differences in two impacted industries’ responses.
Theory and Hypotheses
Sarbanes-Oxley Act of 2002
Public accounting and law firms were subject to pervasive changes in the new regulatory environment after the enactment of SOX. An important objective of SOX was to increase investor confidence in financial reporting by regulating the financial reporting and auditing process by establishing the PCAOB (PCAOB) to oversee accounting firms, enhancing auditor independence, improving financial disclosures, and increasing corporate responsibility. Section 404 of SOX required the testing of internal controls. These and other changes increased the importance of and reliance on analytical procedures (Trompeter & Wright, 2010). Furthermore, Section 307 of SOX gave the SEC the authority to establish minimum standards of professional conduct for attorneys representing public companies. As such, SOX affected the mix of activities and services provided by both public accounting and law firms.
The literature on professional service industries postulates knowledge intensity as the most fundamental characteristic of professional service firms (e.g., Von Nordenflycht, 2010). The production of those firms’ output depends on a large body of specialized knowledge (e.g., Starbuck, 1992; Winch & Schneider, 1993) and relies on an intellectually skilled workforce among its “frontline workers” (Alvesson, 2000; Teece, 2003). As professional services vary in their degree of specialization and difficulty, the process of professional service provision is analyzed in the context of routine and complex services (e.g., Hansen et al., 1999; Maister, 1993; Shostack, 1987). Following this framework, service processes vary in the number of steps required to complete the process and the executional latitude or variability of steps and sequences. Routine services comprise non-varying sequential processes, comparable to the mass production of goods. Therefore, routine services can be provided by less experienced professionals with lower specialization and partner supervision than complex services (Maister, 1993). This facilitates greater leveraging of partner time and the cost-savings can potentially be passed on through a lower charge-out rate (Bharadwaj et al., 1993; Hobday, 1998).
By contrast, a complex service requires greater executional latitude and is provided by either closely supervised professionals (Shostack, 1987) or specialist professionals well trained to carry out such services (Bharadwaj et al., 1993; Hobday, 1998; Maister, 1993). As a result, firms providing complex and high-risk services that closely supervise professionals exhibit low leveraging of partner time. This higher cost input mix (i.e., greater reliance on supervision by partners) is also likely to be reflected in the form of higher charge-out rates. As well, firms recruiting and training high-quality specialist personnel to carry out such services incur a higher cost to acquire the talent and may therefore command a higher charge-out rate. With more productive personnel, the firm may be well positioned to increase the leveraging of partner time (i.e., less supervision by partners is required), allowing partners to pocket more revenue.
SOX changed the mix of activities performed by accounting firms in the following ways. Section 404(b) of SOX requires management of public issuers to assess the effectiveness of internal control over financial reporting. Section 404(b) requires auditors to attest to management’s assessment by conducting tests of internal control. Internal controls tests require auditors to conduct walkthroughs to obtain an understanding of their client. Audit evidence pertaining to internal control tests consists primarily of inquiries, observation of controls, inspection of documents, and the tracing of transactions through the information system. Auditors document their procedures in questionnaires, narratives, and flowcharts. Much of this can be completed without extensive experience by low-billed personnel under lax supervision.
As auditors’ consideration of internal controls changed, so did their reliance on analytical procedures. Analytical procedures, required at the planning and review phases of an audit, allow auditors to assess the reasonableness of clients’ financial information. Trompeter and Wright (2010) qualitatively examine practices relating to analytical procedures and document that the early 2000s’ financial scandals and SOX initiated change in the use of analytical procedures. Specifically, the post-SOX focus on internal controls increased reliance on analytical procedures (Radcliffe, 2010). As with internal control tests, analytical procedures are carried out by lower-level staff, as they require making inquiries and collecting client support to substantiate deviations from expectations. Trompeter and Wright (2010) find that analytical procedures evolved to exploit technological changes to develop more precise estimates and were increasingly completed by lower level staff.
We expect that these post-SOX changes increased the demand for routine and standardized services with sequential processes and limited variability. 6 Such changes enabled accounting firms to rely more on low-billed associates and to decrease the level of partner supervision by increasing the leveraging of partner time. Operationally, accounting firms can increase leverage by accelerating the recruitment of professionals relative to their rate of introducing new partners. This lower cost input mix also facilitates a lower charge-out rate. Although greater leveraging of partner time may increase revenue per partner, a lower charge-out rate may offset the potential increase. To the extent that the cost savings from greater leveraging are at least partially retained (i.e., not completely passed on to clients), and if SOX indeed increased the overall demand for public accounting services, then accounting firms would exhibit an increase in revenue per partner following SOX.
Despite the need to increase leverage post-SOX, which facilitates a lower charge-out rate to pass on savings to clients, there are reasons to believe that charge-out rates increase post-SOX. First, the provisions of SOX increased auditors’ litigation risk (Ghosh & Pawlewicz, 2009). If potential risk cannot be mitigated via added effort from professionals (i.e., by increasing leverage), we may expect firms to charge a risk premium. This would have a positive effect on charge-out rate. Whether the added litigation risk sufficiently offsets the expected reduction in charge-out rate from a lower cost input mix is ultimately an empirical question.
Second, because charge-out rate is the product of billable hours and hourly rate, greater effort may, in theory, increase charge-out rate. Specifically, firms increase hours for existing professionals, without increasing the number of professionals, then charge-out rate may indeed increase. However, when professionals are working at or near capacity, it is impractical for the firm to significantly increase professional-hours without increasing the number of professionals. 7 Nonetheless, we acknowledge that charge-out rates could plausibly increase if the post-SOX increase in effort is largely driven by an increase in hours for existing professionals. Given that it is not unequivocally apparent, this issue can best be addressed empirically. This brings us to our first hypothesis.
SOX impacted the legal services industry very differently from the public accounting industry. Section 307 of SOX provided the SEC with the authority to establish standards of professional conduct for attorneys. Attorneys representing public issuers were required to report material violations of securities law or breach of fiduciary duty. This superseded the existing standards which insulated lawyers that claimed attorney-client privilege (Koniak et al., 2010) and increased law firms’ accountability and risk when representing public issuers (Barrett, 2006).
SOX also impacted clients’ legal exposure. Specifically, Section 302 required executives to certify financial reports, increasing accountability and legal risk, and consequently increasing demand for SOX compliance and defense services. Also, SOX’s whistle-blower provisions (i.e., Section 806) protected general counsel and employees from retaliation, which further increased legal risk (Steinberg & Kaufman, 2005). Sections 304 and 906 increased corporate accountability, and imposed complex legal imperatives in events of misreporting including compensation claw backs. Such changes lacked legal precedence, requiring greater due diligence, careful professional judgment, and more executional latitude from lawyers. Thus, we expect law firms commanded higher charge-out rates to reflect elevated risks. Concurrently, we expect law firms to increase oversight by partners (i.e., lower leveraging of partner time) to manage the complex legal services and risks. Law firms can operationalize this by accelerating the addition of new partners relative to recruitment of professionals. 8 While the increase in charge-out rate brings in more revenue, lower leveraging of partner time decreases revenue per partner. Because SOX increased demand for legal services, we expect law firms to be strategic by not becoming underleveraged to stagnate or potentially reverse the growth of revenue per partner. This brings us to our next hypothesis.
Global Economic Crisis
The public accounting and legal services industries were impacted by the global economic crisis beginning in 2008. Both industries levied layoffs following the crisis due its impact on their operations (e.g., Royal, 2009; Tuck, 2010). Because the crisis was a major shock to both industries, not unlike SOX, we consider its effect on both industries’ revenue generation. Professional service providers rely on clients for revenue, which in turn depends on clients’ well-being. During economic downturns, client firms face financial constraints, affecting their corporate spending plans by limiting companies’ access to capital (e.g., Campello et al., 2010). This may influence their willingness to spend on professional services. Thus, clients may cut back on spending, particularly for non-essential initiatives. This could impose pressure on accounting firms to reduce prices which could decrease revenue. Compounding this, the tumble of the financial services sector, which was especially impacted during the crisis, could considerably impair accounting firm revenue.
Notwithstanding clients’ capital constraints and negative consequences from the potential loss of large banking clients, public accounting services tend to be inelastic and recurring in nature (e.g., auditing, taxation, compilations, etc.). These services are often required and may not be provided in-house. Even when not required, companies are incentivized by banks and other stakeholders to acquire those services. Therefore, public accounting services may be less sensitive to clients’ discretionary spending cuts. Accordingly, accounting firms’ revenue per partner may be insulated in the post-crisis period despite client’s financial difficulties.
Supporting this notion, Audit Analytics issued a 15-year review of audit and non-audit fee trends. 9 Their report shows that although audit fees remained relatively stable from 2007 to 2008, they actually increased by approximately 8% from 2008 to 2009. During this same period audit-related fees and non-audit fees remained relatively stable and the overall increase in total fees was approximately 7% from 2008 to 2009. 10 Accordingly, while it is possible that engagement-level fees at clients in certain contexts may have negatively been influenced given specific engagement characteristics (e.g., Beck & Mauldin, 2014), the larger picture appears to support the notion that the industry did not suffer a significant decline in revenue and may have even benefited.
Moreover, economic downturns create pressures for managers to misreport and could increase the riskiness of accounting firms’ client portfolio (Hogan & Schroeder, 2013). A riskier client portfolio is reflective of increased financial and audit risk. Accounting firms price the riskiness of an engagement so that it is reflected in their charge (Bedard & Johnstone, 2001; G. V. Krishnan et al., 2013; Schelleman & Knechel, 2010). Therefore, firms may command a higher charge-out rate, given the same mix of professionals to partners, to offset risk following the crisis. 11 Concurrently, accounting firms may increase their supervision of professionals (decrease leverage) to bear the increased risk. This brings us to our next hypothesis.
Meanwhile, the legal services industry was hit hard, leading to layoffs, salary decreases, and hiring freezes (Robbins, 2014). 12 Legal services are more elastic than accounting services, making their demand more sensitive to recessions. Clients facing budgetary pressures are likely to demand lower fees. Consistently, prior work suggests that law firms providing more complex discretionary legal services (i.e., relating to M&As, joint ventures, strategic counseling, capital investments, risk management, securities, etc.) suffer a decline in business post-crisis (e.g., Wald, 2010). Instead, demand for certain standardized legal services relating to bankruptcies and corporate restructuring surge during economic downturns, changing law firms’ service mix and thus, their underlying processes and input mix. So while legal services may be more elastic and non-recurrent, law firms’ revenue loss from these services may partially be offset by the increase in demand for other legal services. Therefore, the effect of the crisis on law firms’ revenue per partner is ultimately an empirical question and depends on the net change in the demand.
However, the shift to more standardized lower margin services reduces charge-out rates. As well, vast layoffs, hiring freezes, and salary cuts could reduce leveraging of partner time, as associates are either terminated or turnover without being replaced. Thus, we expect law firms’ charge-out rate and leverage decrease during the crisis. This brings us to our next hypothesis.
Data, Sample, and Research Design
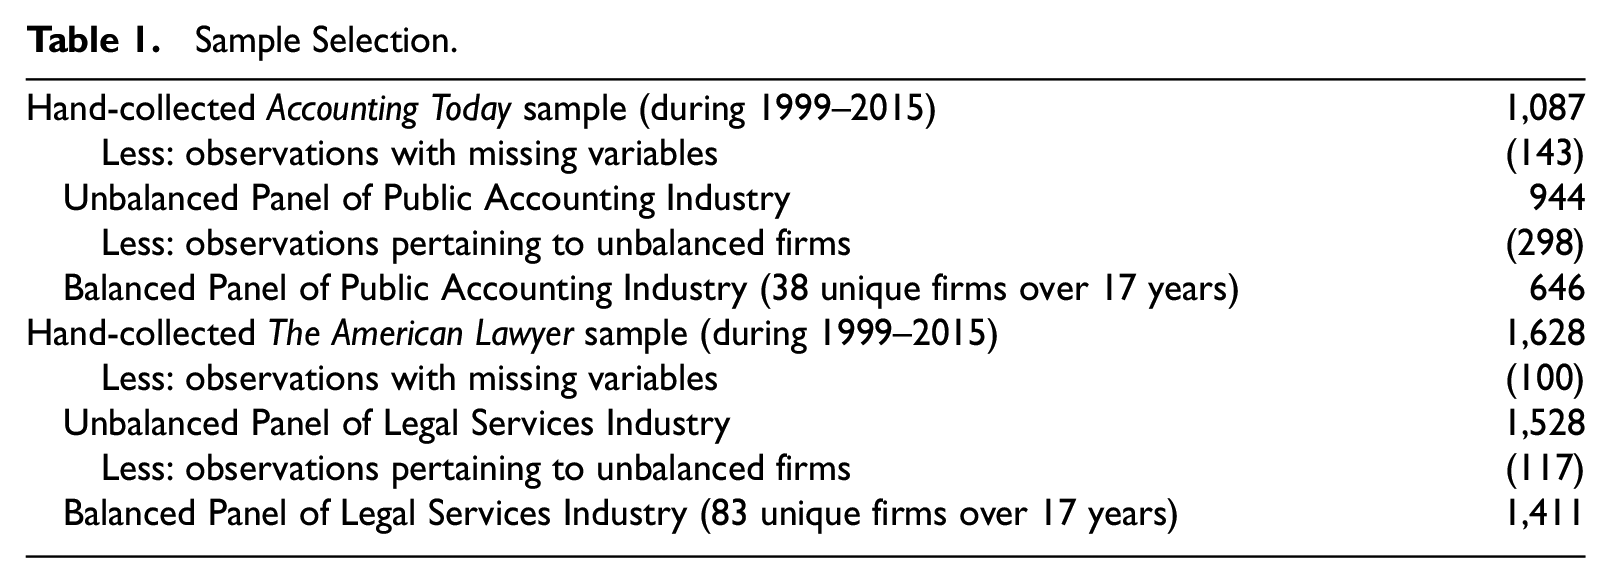
We collect accounting firm data from Top 100 Firms, an annual report published by Accounting Today and law firm data from AmLaw100, a report published annually by The American Lawyer. Our sample period is from 1999 to 2015. After deleting observations with missing variables, our unbalanced panel contains 944 public accounting firm-year observations and 1,528 law firm-year observations. To reduce the possibility of bias in our sample due to non-random missing observations, we conduct our main analysis using a balanced panel after deleting observations associated with firms that do not have the necessary data for all years from 1999 to 2015. Our final balanced panel contains 646 public accounting firm-year observations and 1,411 law firm-year observations. 13 Table 1 outlines our sample selection procedure.
Sample Selection.
Revenue Generation Measures
We use performance ratios to measure the revenue generation of the public accounting and law firms. Revenue per partner, a commonly used measure to capture the performance of professional service firms (The American Lawyer, 2011; Aronson, 2007; Randazzo, 2013) is computed by scaling revenue by the number of equity partners. We disaggregate Revenue per partner into two components: Charge-out rate and Leverage. Charge-out rate is computed by scaling revenue by the number of non-partner professionals and Leverage is computed by scaling the number of non-partner professionals by the number of equity partners. Equations (1) and (2) below illustrate the disaggregation of the ratios and how they relate to one another.


In public accounting and law firms, the partners are the equity owners of the firm. They are analogous to the equity holders used in calculations of traditional performance ratios (e.g., return on equity). Similarly, service professionals drive the revenue generated in a professional service firm rather than physical assets. Accordingly, professionals are analogous to the use of assets in traditional performance ratios (e.g., return on assets). Charge-out rate measures the extent to which a firm commands a charge-out for its professional human capital. Leverage is computed as the ratio of non-partner professionals to partners and reflects the extent to which a firm uses professionals to leverage the skills and expertise of its partners.
Disaggregating Revenue per partner into Charge-out rate and Leverage allows us to examine two aspects of a firm’s revenue generation. One way a firm can generate revenue is by billing a higher rate for its professionals. By doing so, a firm’s Charge-out rate increases and the firm generates more Revenue per partner due to the higher price charged per professional. Second, a firm can also rely on professionals to leverage the skill and expertise of its partners. With less supervision by higher-billed partners, the firm can generate higher Revenue per partner at a lower cost with a more efficient input mix. This frees up valuable partner time for other value-added activities including the solicitation of additional clients.
Empirical Design
To carry out our analysis, we employ the following empirical model for both industries:

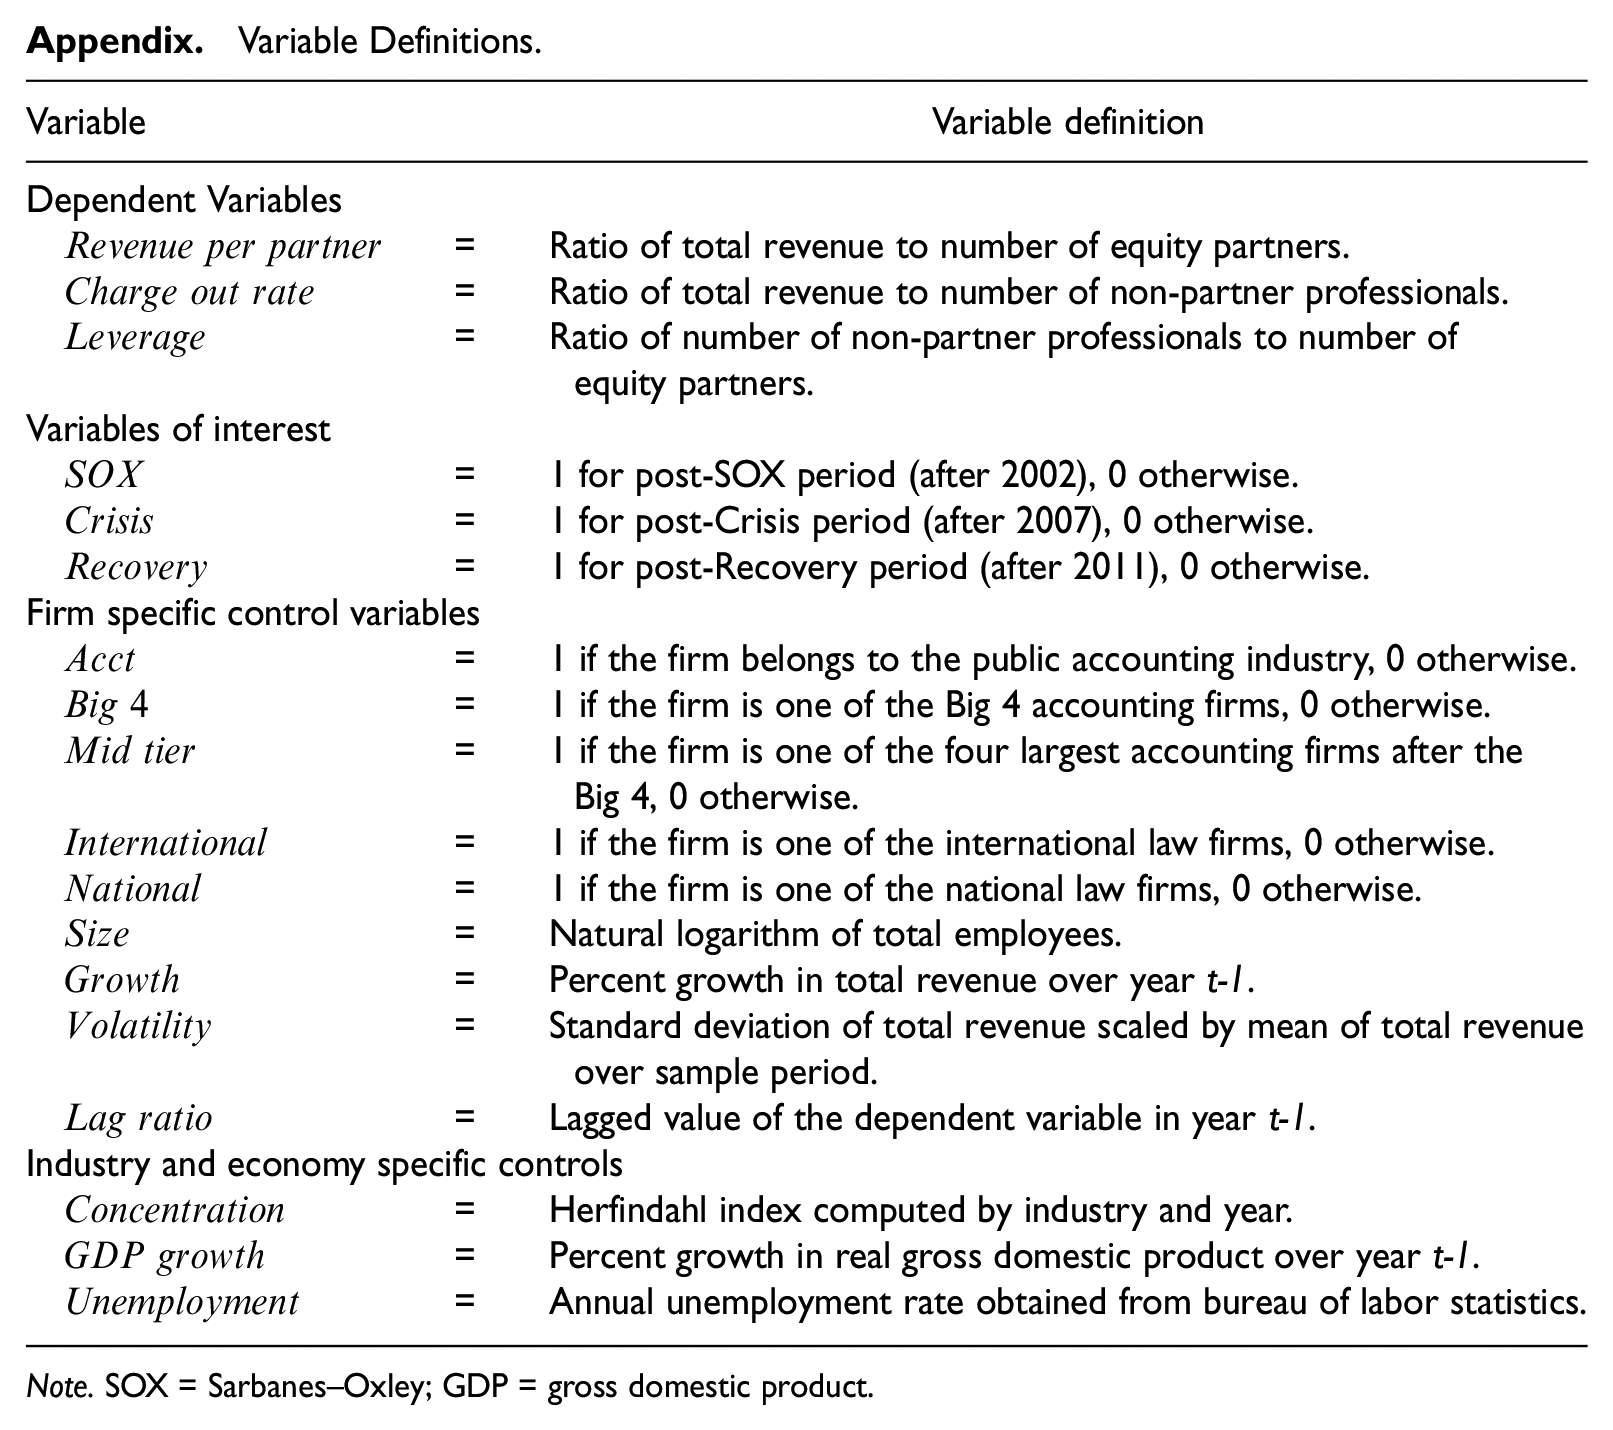
where Ratio represents the natural logarithm of Revenue per partner, Charge-out rate, or Leverage, as discussed and defined earlier. SOX is a binary indicator equaling 1 for firm-year observations in the post-SOX period (i.e., year ≥ 2003) and 0 otherwise and Crisis is a binary indicator equaling 1 for firm-year observations in the post-Crisis period (year ≥ 2008) and 0 otherwise. We also include Recovery, a binary indicator equaling 1 for firm-year observations after 2011 to impose an upper bound to Crisis. X is the vector of control variables. For the public accounting industry, we include the following firm-, industry-, and economy-level controls: Big 4, Mid-tier, Size, Growth, and Volatility, Lag ratio, Concentration, GDP growth, Unemployment, Lag ratio. Big 4 is a binary indicator equaling 1 if the firm is one of the four largest accounting firms and 0 otherwise. 14 Mid-tier is a binary indicator equaling 1 if the firm is one of the next four largest accounting firms based on average revenue and 0 otherwise. 15 These indicators control for resource superiority and brand recognition enjoyed by large accounting firms, which we expect to be positively associated with Revenue per partner and Charge-out rate. Size is the natural logarithm of the number of firm-year employees, Growth is computed as the percentage growth in firm revenue over year t-1, Volatility is computed as the standard deviation of firm revenue divided by the mean of firm revenue over the sample period, and Lag ratio controls for the lagged revenue generation ratio pertaining to the model. We expect high growth firms to focus more on revenue growth, and thus expect Growth to be positively associated with our revenue generation measures. Controlling for Lag ratio allows us to focus on the year over year change in revenue generation, reducing the influence of cross-sectional factors that may drive the results. We expect it to be positively associated with our dependent variables. Following extant work in economics and industrial organization which documents industry concentration is positively related to performance, 16 we include Concentration, computed as the industry’s Herfindahl index. 17 GDP growth is an economy-level variable capturing the state of the economy and is computed as the growth of real gross domestic product over year t-1. Unemployment is an economy-level variable capturing the state of the economy and is obtained annually from the U.S. Bureau of Labor Statistics website. In general, we expect higher GDP growth and lower Unemployment rates to be associated with better performance.
The model for the legal services industry is identical except that it does not include Big 4 and Mid-tier as they are not applicable for law firms. Instead, we include the following indicators for law firms’ size and scope. International equals 1 if the law firm has international operations and 0 otherwise and National equals 1 if the law firm does not have international operations and has national operations, and 0 otherwise. Those indicators control for the resource superiority and client diversity. International law firms are the largest, generating 3.25 times more revenue and employing 3.6 times more lawyers than regional law firms. They are followed by national law firms, with 2.4 (2.1) times more revenue (lawyers) relative to regional law firms. Aside from firm size, these measures capture the scope of the services provided. 18
Table 2 reports the summary statistics for the public accounting and legal services industries in Panel A and Panel B, respectively. The summary statistics are partitioned into sub periods and report the means and medians for all non-categorical variables used in the study. The first partition reports statistics for the pre-SOX period (1999–2002), the second partition reports statistics for the post-SOX period (2003–2007), the third partition reports statistics for the post-Crisis period (2008–2011), and the fourth partition reports statistics for the post-Recovery period (2012–2015). Both industries appear to exhibit an increasing revenue and leverage trend over time. However, this is univariate in nature and does not control for other simultaneous firm-, industry-, or economy-wide changes. Our multivariate analysis, discussed in the next section, provides evidence on the effects of SOX and the crisis after controlling for these factors.
Summary Statistics.
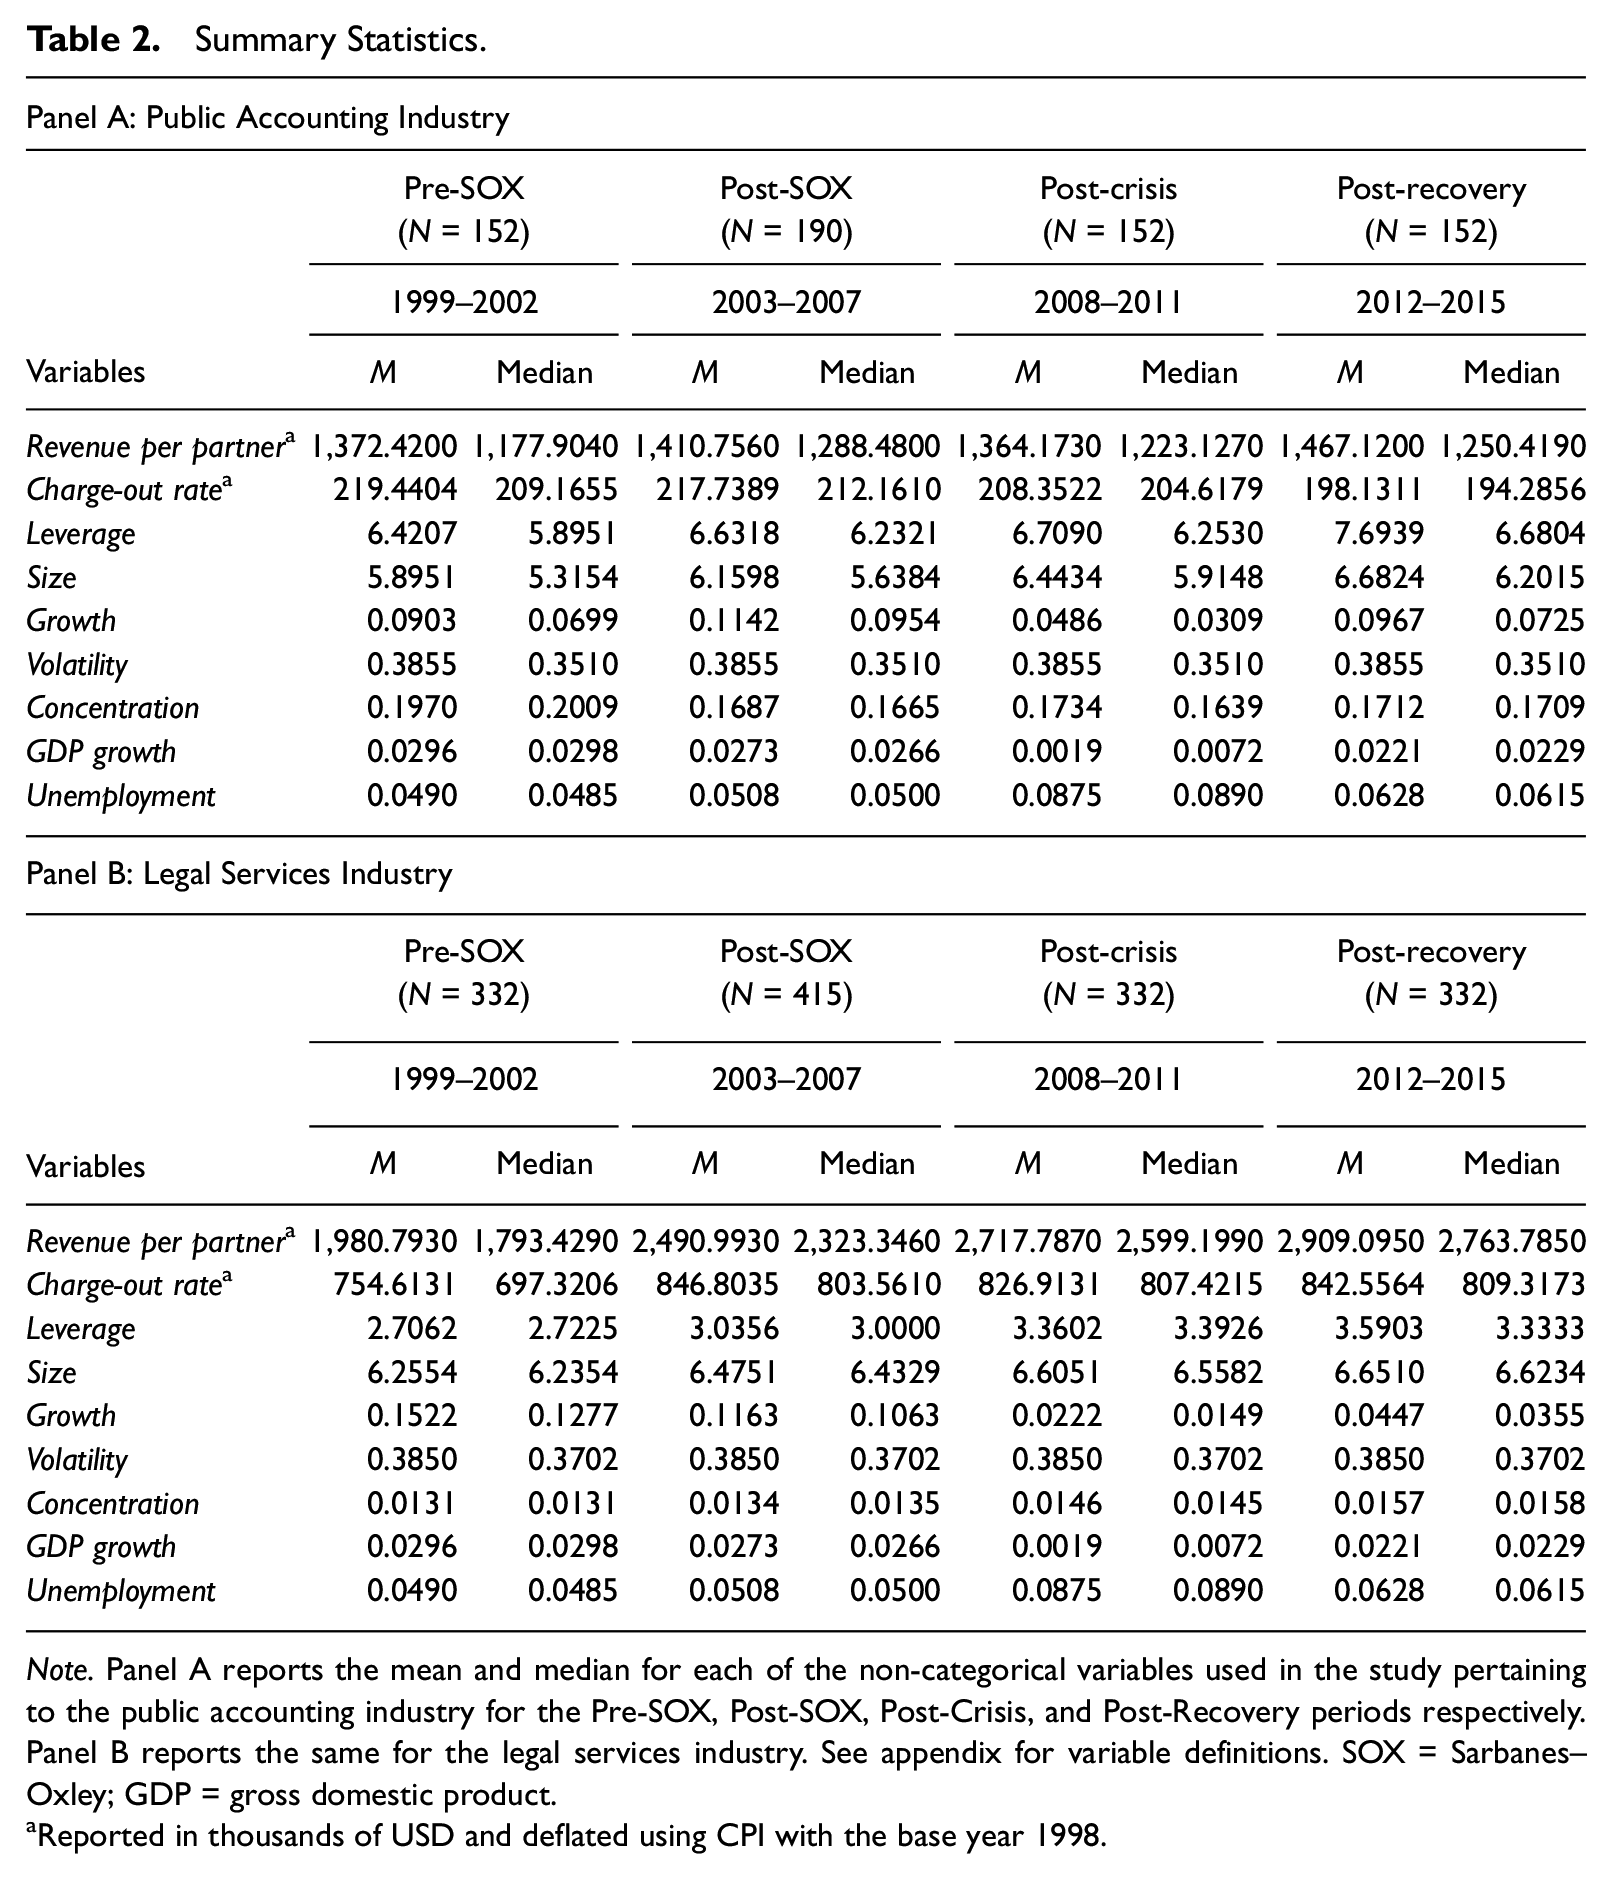
Note. Panel A reports the mean and median for each of the non-categorical variables used in the study pertaining to the public accounting industry for the Pre-SOX, Post-SOX, Post-Crisis, and Post-Recovery periods respectively. Panel B reports the same for the legal services industry. See appendix for variable definitions. SOX = Sarbanes–Oxley; GDP = gross domestic product.
Reported in thousands of USD and deflated using CPI with the base year 1998.
We also report pair-wise correlation coefficients for each industry in Table 3. Panel A reports the coefficients for the public accounting industry while Panel B reports the coefficients for the legal services industry. We note that there are no coefficients that exceed the threshold of 0.80 which would indicate a potential multicollinearity issue. We also compute variance inflation factors for each regression and find that they are all well below the threshold of 10 (untabulated). Thus, concerns regarding collinearity are alleviated.
Correlation Matrix.
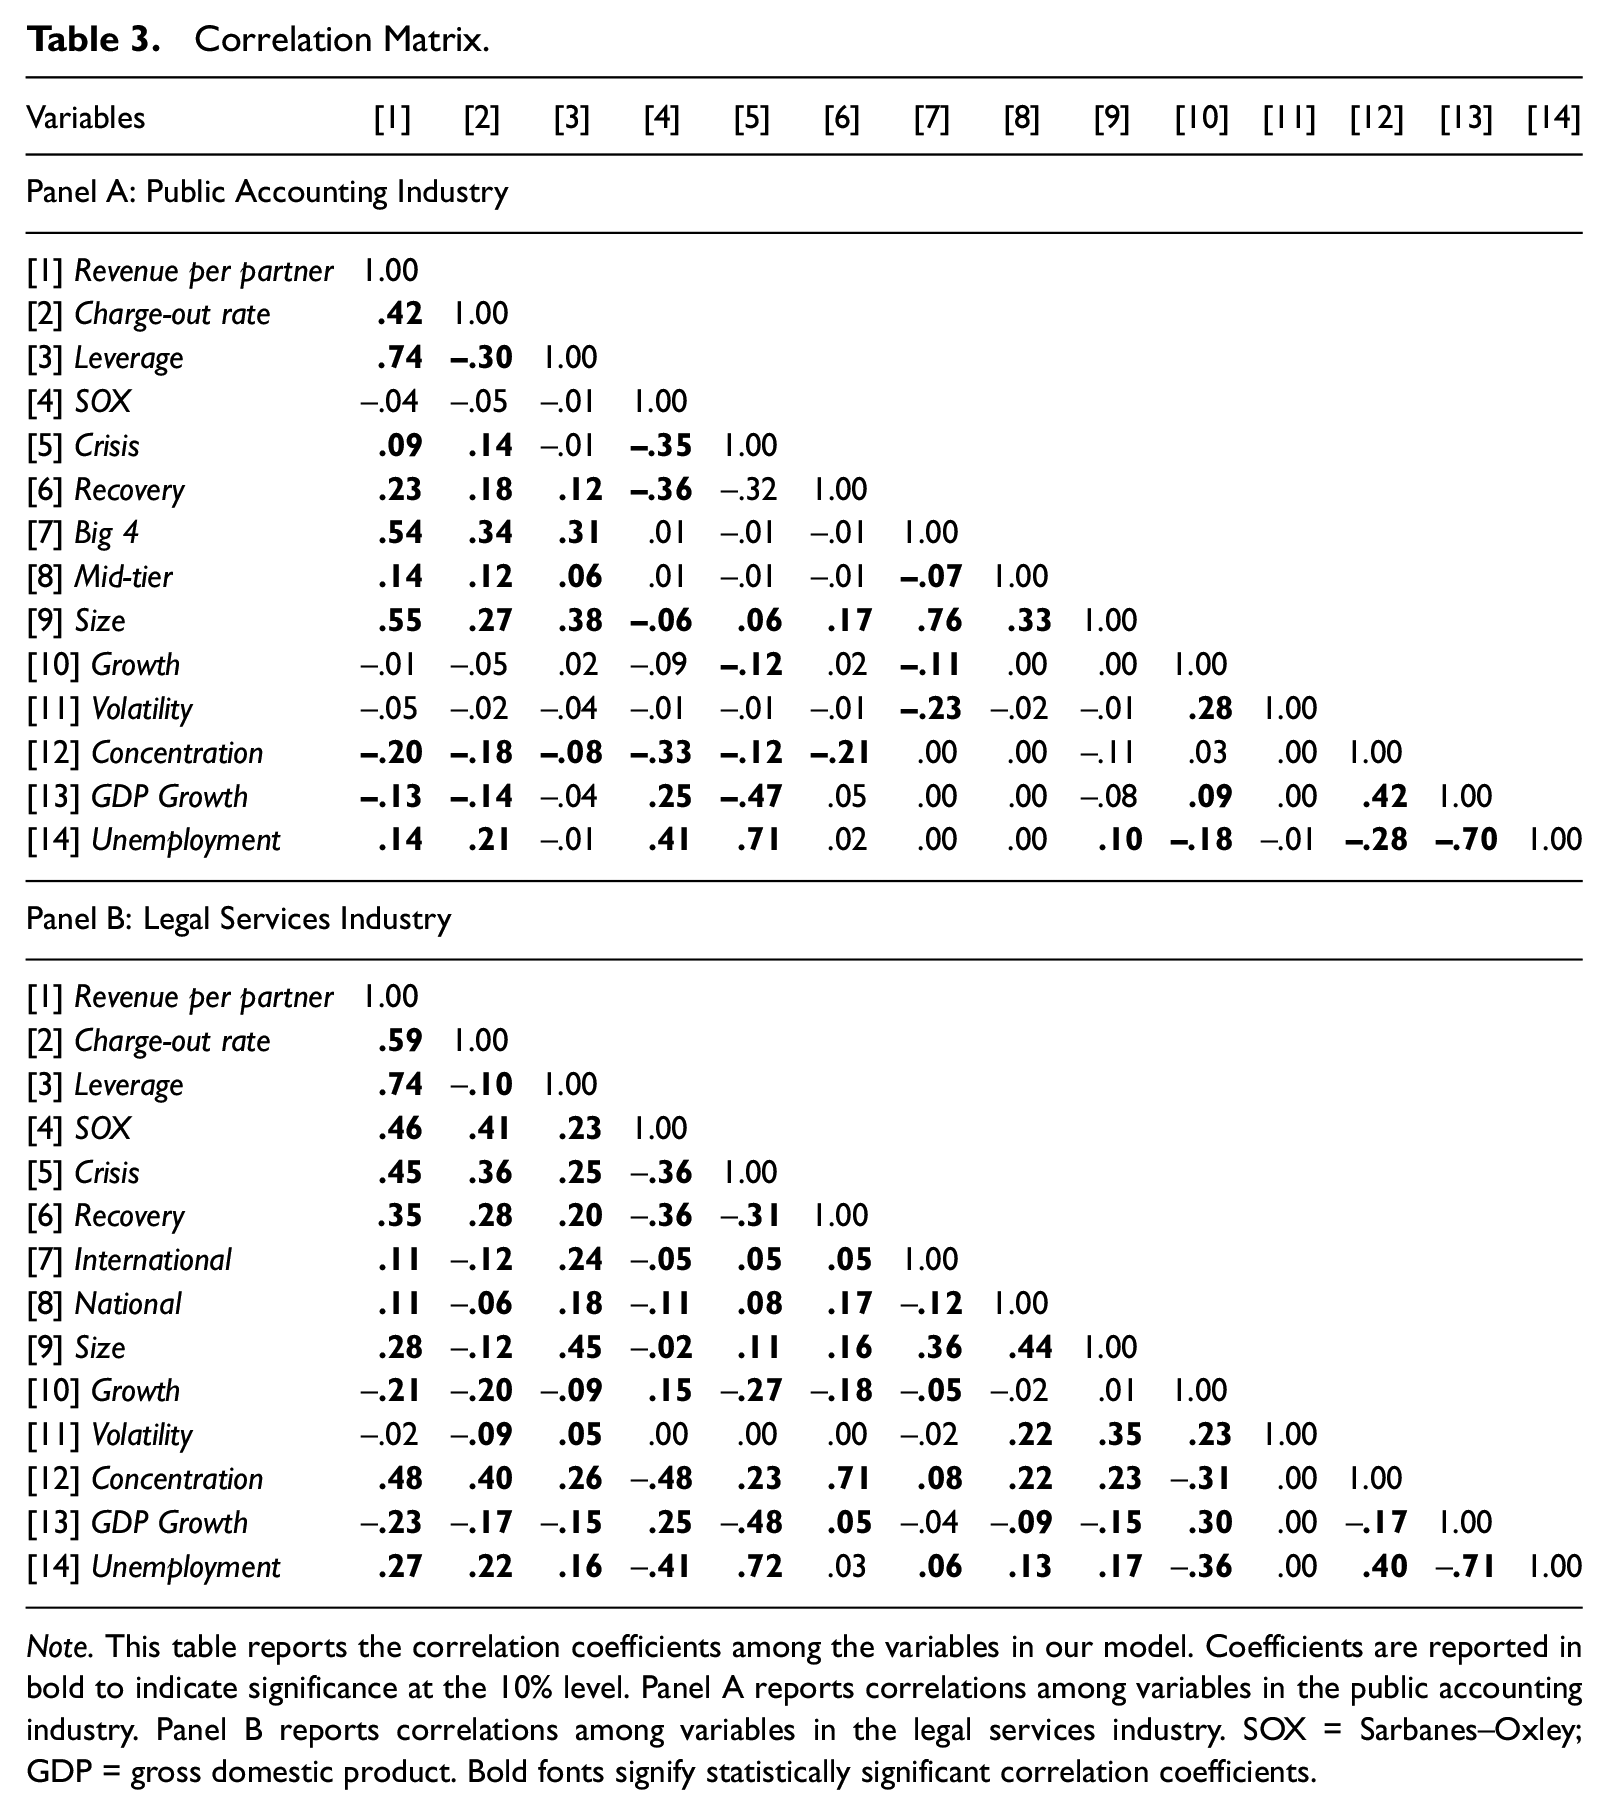
Note. This table reports the correlation coefficients among the variables in our model. Coefficients are reported in bold to indicate significance at the 10% level. Panel A reports correlations among variables in the public accounting industry. Panel B reports correlations among variables in the legal services industry. SOX = Sarbanes–Oxley; GDP = gross domestic product. Bold fonts signify statistically significant correlation coefficients.
Empirical Results
Table 4 reports the parameters estimated by employing Equation (3) for the public accounting industry. Columns (1) to (3) report results with Revenue per partner, Charge-out rate, and Leverage as the dependent variables. The R 2 is .881, .869, and .825, respectively, indicating a good model fit. The coefficient on SOX in Column (1) is positive (p<.01), indicating that the enactment of SOX is positively associated with Revenue per partner for the public accounting industry; this finding supports H1a. The coefficient on SOX in Column (2) is negative (p<.05), indicating that SOX is negatively associated with Charge-out rate for the public accounting industry; this finding supports H1b. The coefficient on SOX in Column (3) is positive (p<.01), indicating that the enactment of SOX is positively associated with Leverage for the public accounting industry; this finding supports H1c. Together, these results suggest that the industry exhibited an increase in revenue per partner following the enactment of SOX which coincided with elevated leveraging of partner time and lower charge-out rates. These findings are consistent with public accounting services shifting toward more routine and sequential services, as discussed in Section 2.
Effect of SOX and Crisis on Public Accounting Firms’ Revenue Generation.

Note. This table reports coefficients from estimating Eq. (3) for each of the revenue generation ratios for the balanced panel of accounting firms. P-values are reported in parentheses next to the coefficients. Standard errors are clustered by firm and year (Petersen, 2009). See appendix for variable definitions. SOX = Sarbanes–Oxley; GDP = gross domestic product.
, **, and *** denote statistical significance at the 10, 5, and 1% levels.
Moving to the global financial crisis, the coefficients on Crisis in Columns (1) and (3) are not significantly associated with Revenue per partner and Leverage, failing to support H3a and H3c. The coefficient on Crisis in Column (2) is positive (p<.05), indicating that the crisis is positively associated with Charge-out rate for the public accounting industry; this supports H3b. Together, these results suggest that the public accounting industry did not suffer a significant decline in revenue per partner during the crisis, consistent with public accounting services being insulated during economic downturns due to their inelastic nature. This also supports the notion that accounting firms commanded a risk premium for the incremental riskiness of their clients during the crisis.
Table 5 reports the parameters estimated by employing Equation (3) for the legal services industry. The R2 is .957, .970, and .884, respectively, indicating a good model fit. The coefficient on SOX in Column (1) is positive (p<.1), indicating that the enactment of SOX is positively associated with Revenue per partner for the legal services industry; this supports H2a. The coefficient on SOX in Column (2) is positive (p<.01), indicating that the enactment of SOX is positively associated with Charge-out rate for the legal services industry; this supports H2b. The coefficient on SOX in Column (3) is negative (p<.01), indicating that the enactment of SOX is negatively associated with Leverage for the legal services industry; this supports H2c. Together, these results suggest that the legal services industry exhibited an increase in revenue per partner following SOX, which was driven by elevated charge-out rates and lower leveraging of partner time. These findings are consistent with legal services becoming riskier and more complex after SOX.
Effect of SOX and Crisis on Law Firms’ Revenue Generation.
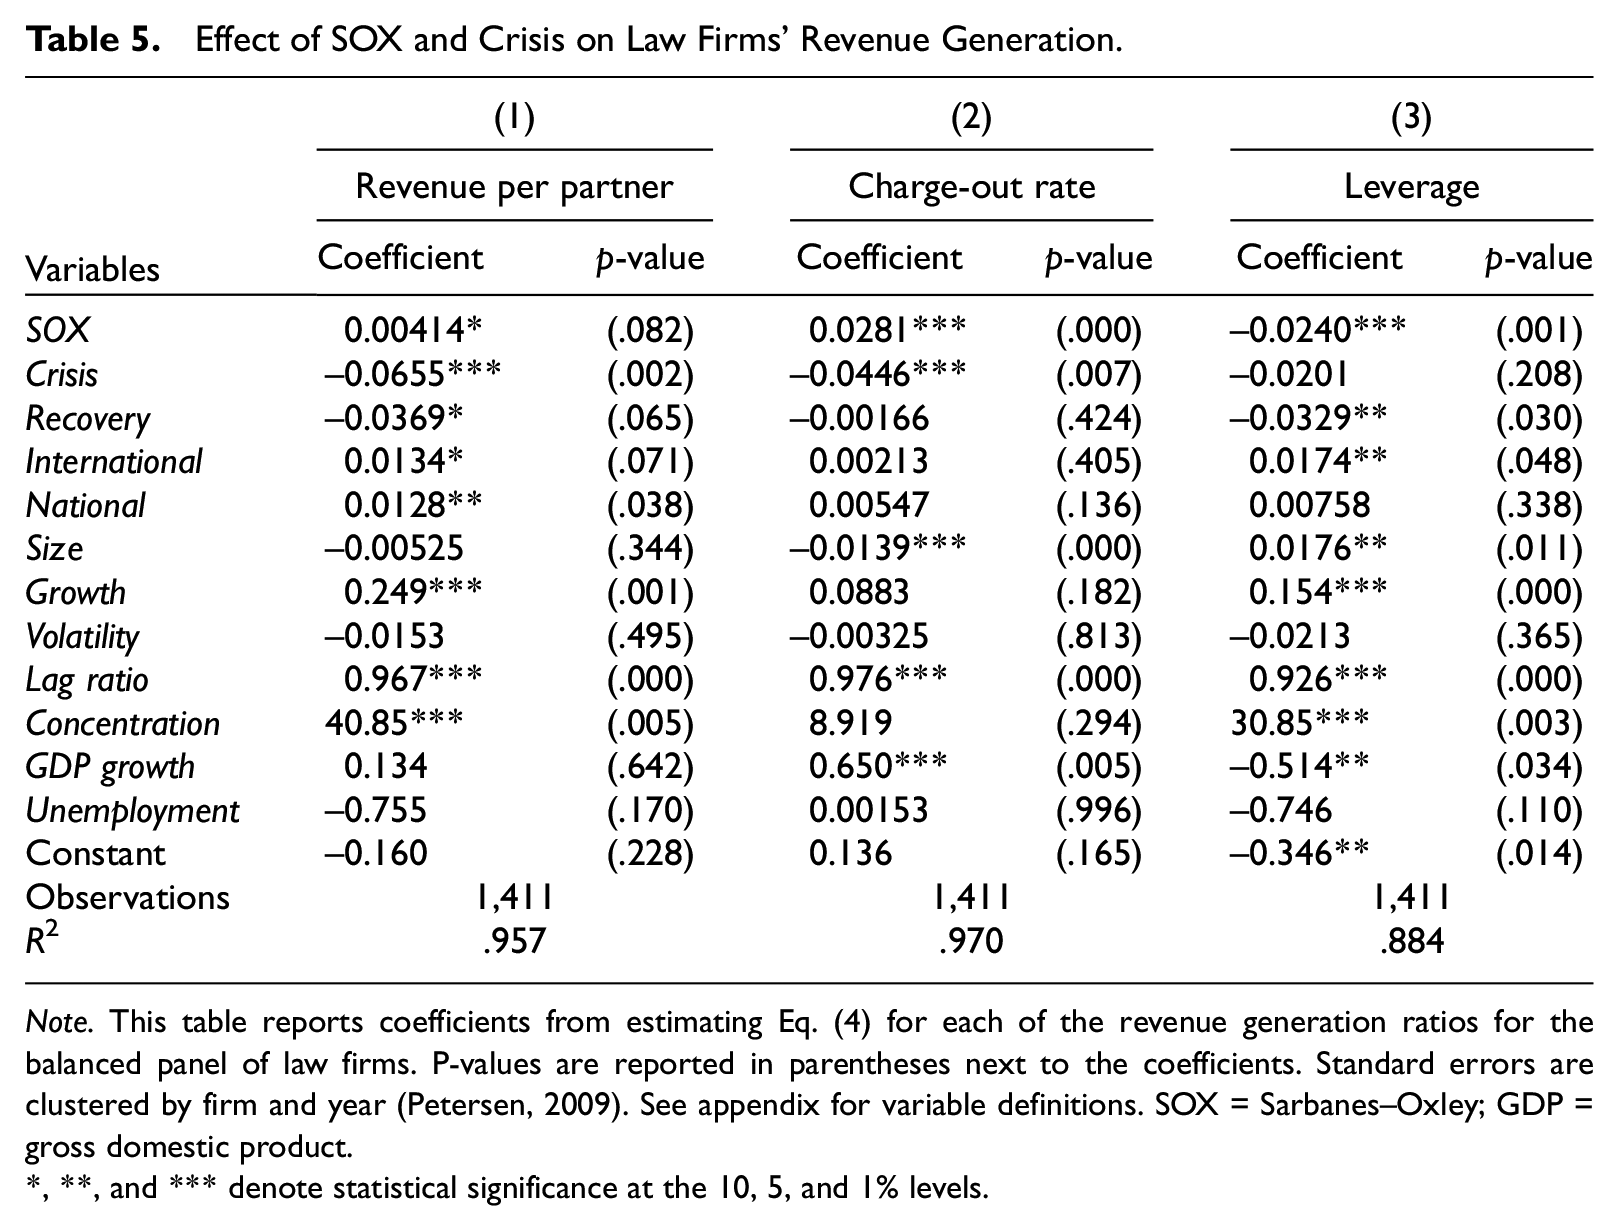
Note. This table reports coefficients from estimating Eq. (4) for each of the revenue generation ratios for the balanced panel of law firms. P-values are reported in parentheses next to the coefficients. Standard errors are clustered by firm and year (Petersen, 2009). See appendix for variable definitions. SOX = Sarbanes–Oxley; GDP = gross domestic product.
, **, and *** denote statistical significance at the 10, 5, and 1% levels.
Relating to the crisis, the coefficients on Crisis in Columns (1) and (2) are negative (p < .01), indicating that the onset of the global economic crisis is negatively associated with Revenue per partner and Charge-out rate for the legal services industry. These findings support H4a and H4b and fail to support H4c. This is consistent with law firms being vulnerable during downturns, as clients cut down on discretionary and elastic services during periods of distress. The decline in revenue per partner post-Crisis was driven by lower charge-out rates without a significant change in leveraging of partner time. This supports that law firms reduced prices.
Robustness and Additional Analyses
Difference-in-Differences
We also employ a difference-in-differences model to compare the changes in revenue generation for the public accounting industry relative to the legal services industry. This analysis provides additional evidence to make inferences regarding the unique impacts of those macroeconomic shocks on the public accounting industry. We use the following model using a pooled sample of both industries to carry out this analysis:

where Acc is a binary indicator equaling 1 for accounting firms and 0 otherwise. All other variables are computed as discussed earlier. The coefficient
Table 6 reports the results of this analysis. Results support our main findings, suggesting that accounting firms’ leveraging of partner time increased and charge-out rates decreased relative to law firms post-SOX. Following the crisis, accounting firms’ leveraging of partner time decreased and charge-out rates increased relative to law firms. While there is no significant difference between the industries in their change in revenue per partner following the enactment of SOX, the results strongly show that accounting firms’ revenue per partner increased relative to law firms following the onset of the crisis. These results highlight the sensitivity of the legal services industry to economic fluctuations relative to the public accounting industry.
Difference in Difference Analysis.

Note. This table reports coefficients from estimating Eq. (5) for each of the revenue generation ratios separately for the pooled balanced panels of public accounting and law firms. P-values are reported in parentheses next to the coefficients. Standard errors are clustered by firm and year (Petersen, 2009). See appendix for variable definitions. SOX = Sarbanes–Oxley.
, **, and *** denote statistical significance at the 10, 5, and 1% levels.
Cross-Sectional Variation
We extend our analysis to investigate the heterogeneity within both industries in their responses to SOX and the crisis. We do so by modifying equation (3) for each industry by interacting Big 4 and Mid-tier with SOX and Crisis for the public accounting industry and interacting International and National with SOX and Crisis for the legal services industry. Because SOX targeted publicly listed companies, we expect its effects to be stronger for large public accounting and law firms whose clientele are more likely impacted by SOX provisions.
Furthermore, we expect the increased client risk and pricing pressures following the crisis to differentially impact the Big 4 firms. The crisis especially impacted the Big 4 firms due to their reliance on the financial services sector which was hit hard during this time. The Big 4 firms lost $231 million in revenue from audit and non-audit services from the failure or change in ownership of the large banks. 19 In addition, it is well established that Big 4 accounting firms command higher fees (e.g., Eshleman & Guo, 2014; Francis et al., 2005; Palmrose, 1986). As such, an economic recession can drive clients to seek out fee reductions by switching to the less expensive non-Big 4 firms. Consistently, Beck and Mauldin (2014) report that fee pressures drove down audit fees during the crisis. This could decrease the demand for the Big 4 while stimulating the demand for their smaller counterparts. Our results support this notion.
With respect to law firms, we expect the large international law firms to be better positioned than others due to their superior resources and brand recognition (Aronson, 2007). Hence, we expect their decline in revenue per partner to be less pronounced post-Crisis. However, regional boutique law firms tend to be resilient and adaptable during economic downturns, where partners are much more hands-on without having to deal with the overhead of a large number of salaried professionals (Urda, 2009). Therefore, we expect them to fare better than the potentially over-leveraged national law firms. Results are reported in Table 7. Panel A (Panel B) reports the results for the public accounting (legal services) industry.
Cross-Sectional Variation.
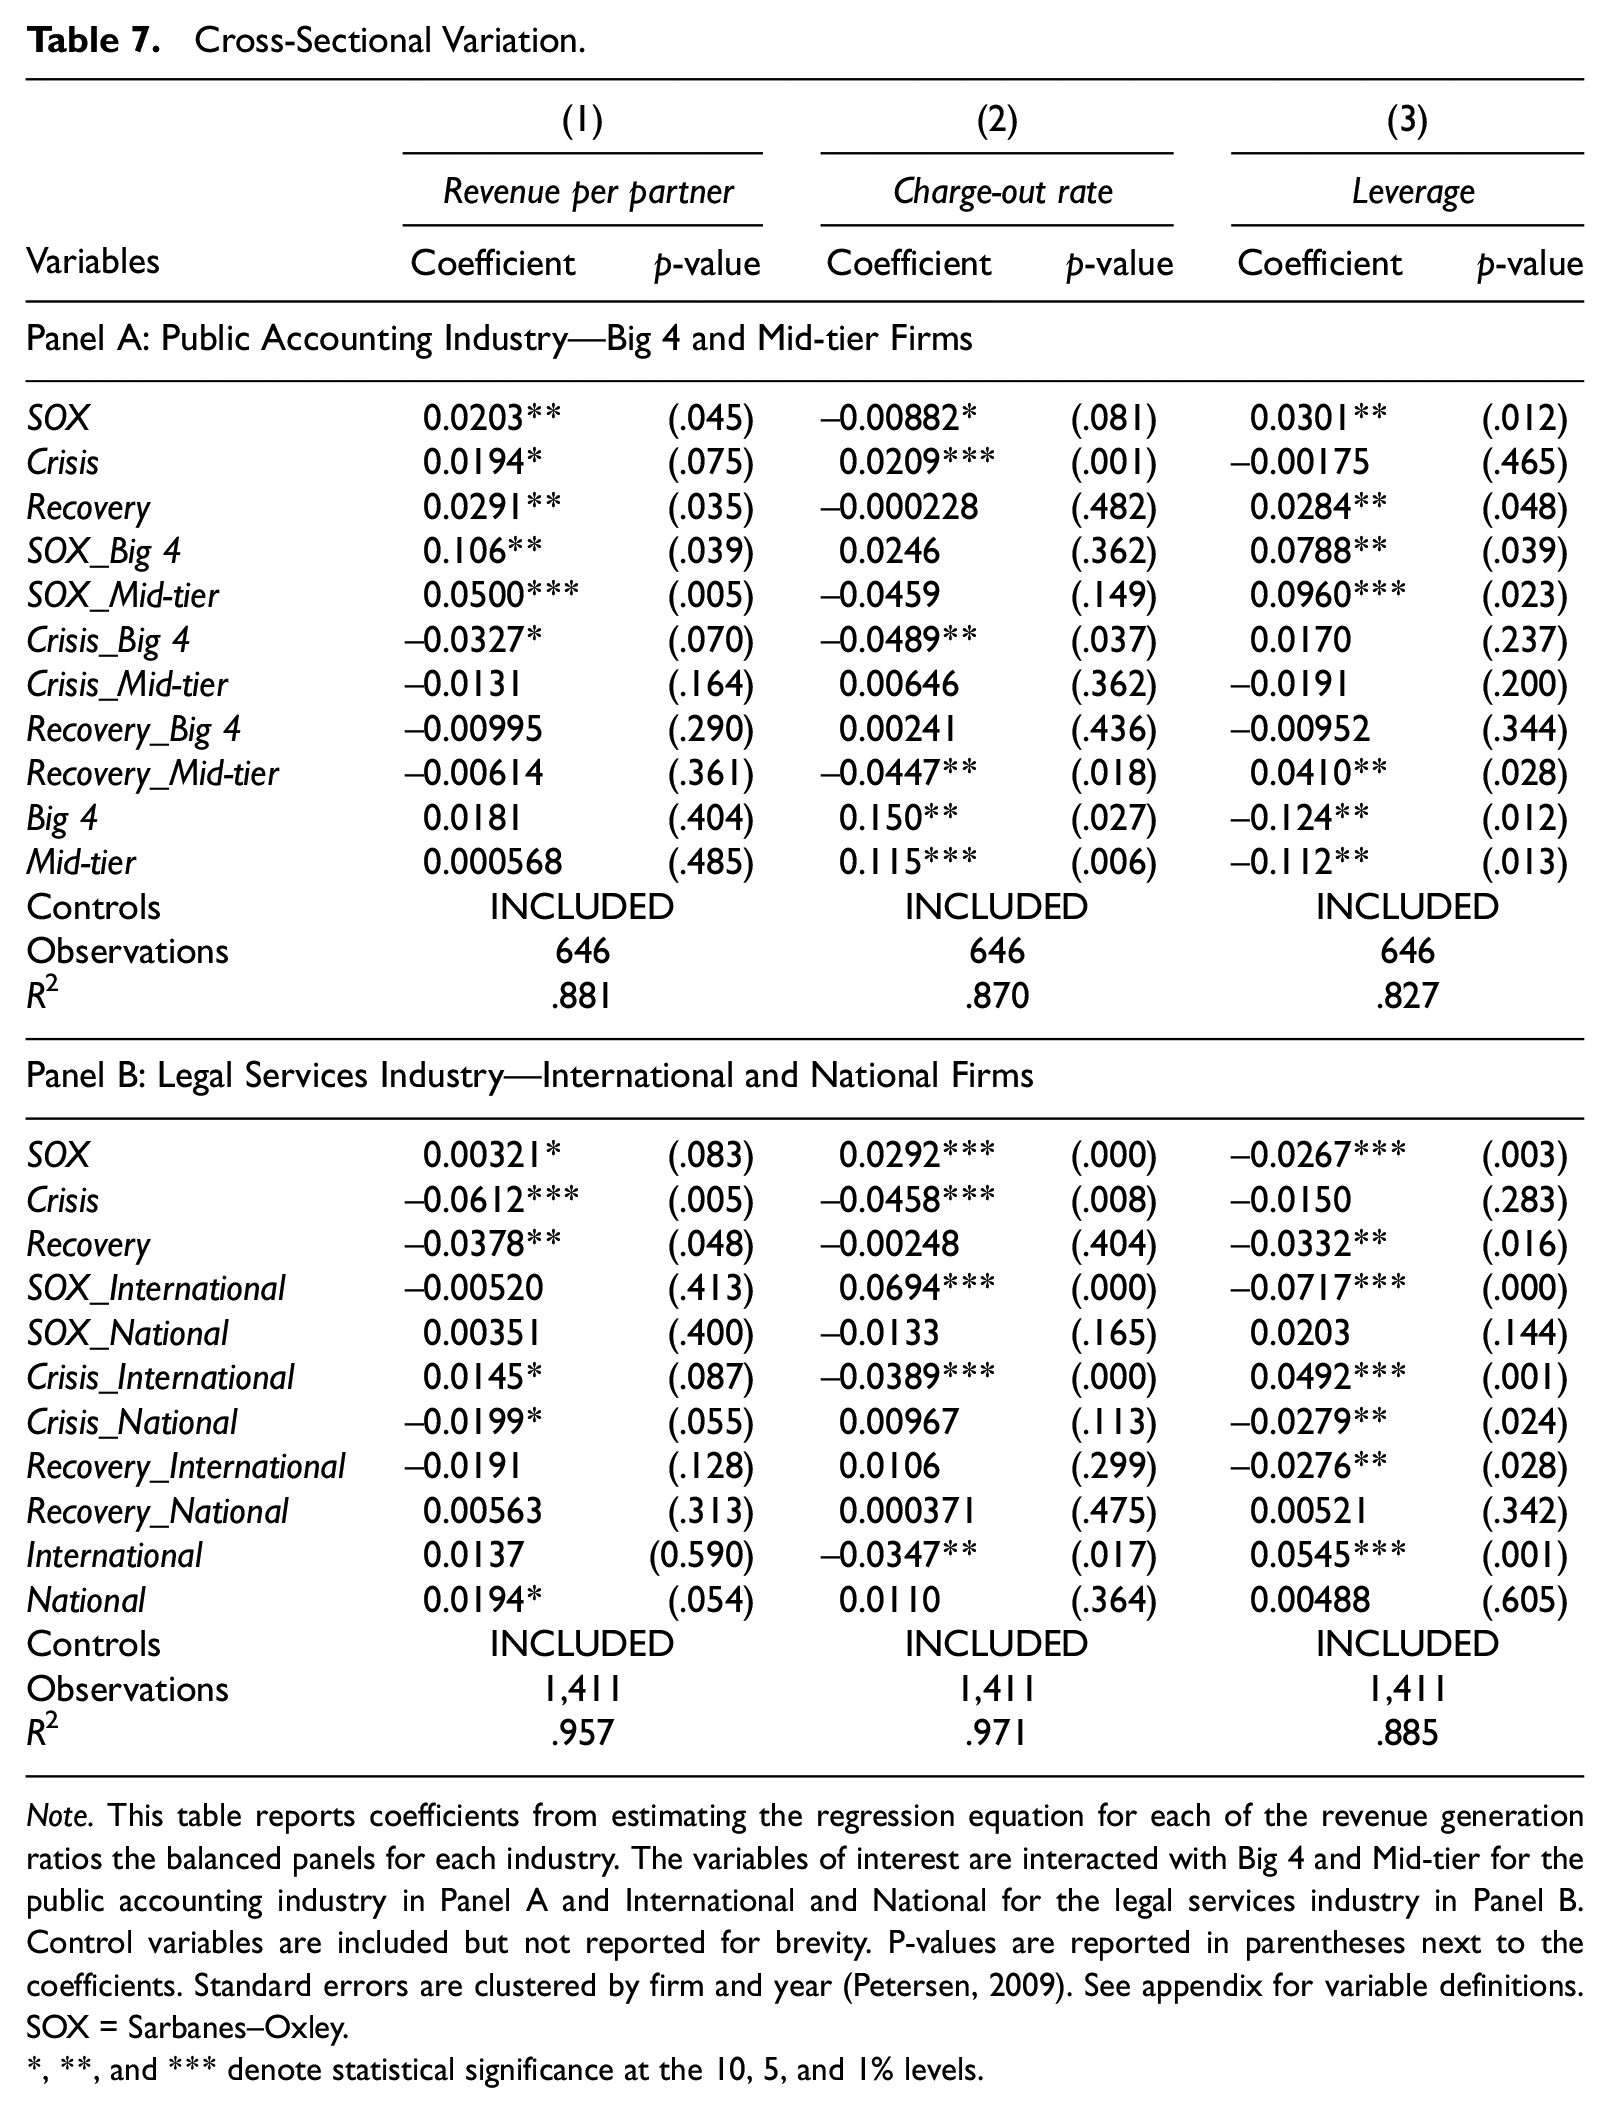
Note. This table reports coefficients from estimating the regression equation for each of the revenue generation ratios the balanced panels for each industry. The variables of interest are interacted with Big 4 and Mid-tier for the public accounting industry in Panel A and International and National for the legal services industry in Panel B. Control variables are included but not reported for brevity. P-values are reported in parentheses next to the coefficients. Standard errors are clustered by firm and year (Petersen, 2009). See appendix for variable definitions. SOX = Sarbanes–Oxley.
, **, and *** denote statistical significance at the 10, 5, and 1% levels.
Consistent with expectations, we find that the Big 4 and Mid-tier accounting firms exhibit more pronounced increases in revenue per partner and leverage after SOX. As well, we find that Big 4 firms reduced charge-out rates and had lower revenue per partner following the crisis. By contrast, the crisis is associated with higher charge-out rates and revenue per partner for small accounting firms. This is consistent with lower demand for the Big 4 during the crisis due to the collapse of large banks in the financial services sector and clients seeking out lower fees by switching away from the Big 4. For the legal services industry, we find that the effects of SOX on international law firms’ charge-out rates and leverage are stronger relative to domestic law firms. In addition, international law firms exhibit a steeper decline in charge-out rates following the crisis but also employ a lower-cost input mix by increasing leverage during this period. Finally, while the international law firms outperform others post-crisis, the national law firms fare worse than boutique law firms.
Additional Tests and Sensitivity Analyses
Although SOX was enacted in 2002 and many of its sections which increased the demand for audits became effective in the same year (e.g., Sections 301, 302, 906, etc.), Section 404 became effective for audits completed after November 2004. As such, prior studies document that fees in 2004 were higher than fees in 2003 (post SOX 404 effect) due to the incremental effort required for internal control testing (Ettredge et al., 2018; Raghunandan & Rama, 2006). Given the prominence of SOX 404, it is possible that the immediate effect of SOX differed from its effect post-SOX 404. To examine this, we construct Pre 404 SOX and Post 404 SOX to designate the two periods post-SOX. Because SOX 404 impacts services provided by accounting firms, we focus on the public accounting industry. The results, reported in Table 8, suggest that only Post 404 SOX is positively associated with Revenue per partner. However, both Pre 404 SOX and Post 404 SOX are associated with a decrease in Charge-out rate and an increase in Leverage. This supports the notion that although SOX 404 was not effective until 2004, firms were impacted by other sections and began preparing for anticipated changes relating to SOX 404 by increasing their number of professionals to facilitate greater leveraging of partner time and a lower cost input mix that reduces average charge-out rates.
Distinguishing Pre and Post SOX 404 for Public Accounting Industry.

Note. This table reports coefficients from estimating the regression equation for each of the revenue generation ratios using the balanced panel for the public accounting industry and separately identifying the pre and post SOX 404 periods after the enactment of SOX (Pre 404 SOX and Post 404 SOX, respectively). Control variables are included but not reported for brevity. P-values are reported in parentheses next to the coefficients. Standard errors are clustered by firm and year (Petersen, 2009). See appendix for variable definitions. SOX = Sarbanes–Oxley.
, **, and *** denote statistical significance at the 10, 5, and 1% levels.
Next, we consider changes in the accounting firms’ service mix (i.e., proportion of revenue generated from auditing, taxation, and advisory services) and clientele (i.e., size, liquidity, and financial distress). Changes introduced by SOX and the crisis could have modified these factors, which could potentially drive the effects we observe. After incorporating these controls into our model (untabulated), our results remain qualitatively unchanged. This supports the notion that the impact of SOX and the crisis on accounting firms’ revenue per partner, average charge-out rate, and leveraging of partner time are not driven by concurrent changes in the service mix and client portfolio. We also examine how SOX and the crisis impacted firms’ service mix. Consistent with SOX-imposed limitations on non-audit services making them a less viable revenue source, we find that accounting firms decreased their reliance on non-audit services post-SOX (untabulated). This supports prior examinations of fee trends (Cheffers & Whalen, 2011). However, while the crisis did not have a significant impact on the service ratio, accounting firms increased their revenue generation from non-audit services during the recovery after the crisis. This is consistent with recent indications in the media and statements from the PCAOB (Editorial Board, 2018; Harris, 2014; Rapoport, 2018).
Third, we consider whether the use of an unbalanced panel affects the observed associations. Our main tests use a balanced panel of public accounting and law firm data. Doing so allows us to relax the assumption that the reason for attrition due to missing observations in our sample is non-systematic. However, as a robustness test, we carry out our analyses using unbalanced panels for both industries. The public accounting industry comprises 944 firm-year observations and the legal services industry comprises 1,528 firm-year observations. The results (untabulated) using the unbalanced panels are qualitatively unchanged from our main findings and support our predictions at the industry level and in the cross-section. 20
Conclusion
In their governance role, accounting firms contribute to the overall health and efficiency of the capital markets by providing assurance to capital providers (PCAOB 2014). Thus, it is important to examine the effect of regulation on pricing and service quality to gain a better understanding of the costs and benefits of the regulation. However, accounting firms function under resource constraints and must consider their economic incentives as they strive to provide high-quality service. If a regulatory or economic shock increases risk, then accounting firms may increase their effort by deploying more professionals (i.e., higher leverage) to mitigate the risk. Alternatively, if the risk cannot sufficiently be mitigated by increasing effort, then they may charge a risk premium as a form of insurance against audit failure and litigation (G. V. Krishnan et al., 2013) (i.e., higher charge-out rate). Thus, a fee increase for one firm does not have the same implications as an equivalent fee increase for another firm, and we must understand beyond pricing, to learn what drives a change in fee revenue. We believe our paper provides such insights in the context of charge-out rate and leverage. Moreover, engagement fees and revenue per partner may not always comove. If a shock increases the workload and risk at individual engagements but reduces partner’s ability to oversee multiple different engagements, then revenue per partner may not increase even when fees at the engagement level do unless the firm increases its capacity or sacrifices quality. Thus, a better understanding of changes in revenue per partner provides insights regarding partners’ incentives and auditor independence issues that are intertwined with quality.
We also examine the legal services industry to provide a comparison group and show how each industry was uniquely impacted. Along with accounting-specific provisions, SOX increased companies’ legal exposure, amplifying demand for legal and compliance services. 21 Moreover, SOX prohibits the “intermingling of audit and legal consulting services for the same client” which shifted considerable business to the law firms by deterring accounting firms from providing these services as they did prior to SOX (Johanns, 2019). As such, law firms are important intermediaries that help public companies and their stakeholders cope with SOX and other events that could influence legal risk pertaining to financial reporting. Moreover, large accounting firms have built up their legal practices outside of the U.S., which may be a trend that eventually affects U.S. firms since SOX does not prohibit accounting firms from providing legal services to their clients that do not receive audit services. 22 As such, an examination of law firms, alongside accounting firms, should be of interest to regulators, practitioners, and academics.
While the public accounting and legal services industries both enjoyed higher revenue per partner following SOX, we show that they achieved these increases very differently. Post-SOX, accounting firms had to devote more time on standardized processes that can be delegated to associates. Consequently, accounting firms’ post-SOX increase in revenue per partner was driven by higher leveraging of partner time and lower average charge-out rates. By contrast, law firms had to cater to more complex and high-level work with greater accountability for reporting clients’ misdeeds. Consistently, law firms’ increase in revenue per partner post-SOX was attributable to higher charge-out rates. Post-crisis, we show that the accounting industry, with the exception of the Big 4 who relied heavily on the financial services sector, was insulated due to the inelastic nature of their services. On the other hand, law firms suffered lower revenue per partner. Understanding these differences between public accounting and law firms in their response to macro-economic and regulatory changes provides fruitful insights for devising future regulatory policy surrounding accounting firms. Our study also adds to the literature on the performance evaluation of accounting firms, and more broadly, professional service firms.
Footnotes
Appendix
Variable Definitions.
| Variable | Variable definition | |
|---|---|---|
| Dependent Variables | ||
| = | Ratio of total revenue to number of equity partners. | |
| = | Ratio of total revenue to number of non-partner professionals. | |
| = | Ratio of number of non-partner professionals to number of equity partners. | |
| Variables of interest | ||
| = | 1 for post-SOX period (after 2002), 0 otherwise. | |
| = | 1 for post-Crisis period (after 2007), 0 otherwise. | |
| = | 1 for post-Recovery period (after 2011), 0 otherwise. | |
| Firm specific control variables | ||
| = | 1 if the firm belongs to the public accounting industry, 0 otherwise. | |
| = | 1 if the firm is one of the Big 4 accounting firms, 0 otherwise. | |
| = | 1 if the firm is one of the four largest accounting firms after the Big 4, 0 otherwise. | |
| = | 1 if the firm is one of the international law firms, 0 otherwise. | |
| = | 1 if the firm is one of the national law firms, 0 otherwise. | |
| = | Natural logarithm of total employees. | |
| = | Percent growth in total revenue over year t-1. | |
| = | Standard deviation of total revenue scaled by mean of total revenue over sample period. | |
| = | Lagged value of the dependent variable in year t-1. | |
| Industry and economy specific controls | ||
| = | Herfindahl index computed by industry and year. | |
| = | Percent growth in real gross domestic product over year t-1. | |
| = | Annual unemployment rate obtained from bureau of labor statistics. | |
Note. SOX = Sarbanes–Oxley; GDP = gross domestic product.
Acknowledgements
We thank Bharat Sarath (editor-in-chief), Kannan Raghunandan (associate editor) and the anonymous reviewers for their guidance and constructive comments. We appreciate the insightful feedback from Dmitri Byzalov (discussant), Cecilia (Qian) Feng, Jagan Krishnan, and workshop participants at Temple University, Stony Brook University, the Conference on the Convergence of Financial and Managerial Accounting Research (2017), and the American Accounting Association's Annual Meeting (2013), Auditing Section Midyear Meeting (2015), and Northeast Regional Meeting (2018).
Declaration of Conflicting Interests
The author(s) declared no potential conflicts of interest with respect to the research, authorship, and/or publication of this article.
Funding
The author(s) received no financial support for the research, authorship, and/or publication of this article.
