
Abstract
The importance of afterschool hours for youth development is widely acknowledged, and afterschool settings have recently received increasing attention as an important venue for youth interventions, bringing a growing need for reliable and valid measures of afterschool quality. This study examined the extent to which the two observational tools, that is, Caregiver Interaction Scales (CIS) and Promising Practices Rating Scales (PPRS), could serve as reliable and valid tools for assessing the various dimensions of afterschool setting quality. The observation data of 44 afterschool programs were analyzed using both standard psychometric procedures (i.e., internal consistency, interrater reliability, and factor analysis) and generalizability theory. The results show the potential promise of the instruments, on one hand, and suggest future directions for improvement of measurement design and development of the field, on the other hand. In particular, our findings suggest the importance of addressing the effect of day-to-day fluctuations in observed afterschool quality.
Keywords
Afterschool programs have become an important setting for aiding schools’ mission of promoting positive youth development and academic achievement, and accumulating evidence indicates that program quality is critical to their success (Mahoney, Parente, & Lord, 2007; Pierce, Bolt, & Vandell, 2010). Reliable and valid measures of program quality are essential both for research seeking to enhance the effectiveness of afterschool programs and for assessments to ensure the quality of practice. We present a study of the measurement properties of two observational measures of the quality of afterschool programs. One is well-established, and we seek to determine its applicability to a broad range of populations and locales. The other measure, newly applied to the afterschool context, is of interest both because it addresses one aspect of program quality in greater depth and because it may be useful for assessing important aspects of program functioning other than overall quality (Shinn & Rapkin, 2000). The study not only addresses standard psychometric features of these measures but also applies generalizability theory to assess the separate and joint contributions of observers and measurement occasions to reliability measures (Shavelson & Webb, 1991).
Pre- and early adolescence is a developmental period with heightened risk of problem behavior as well as great opportunity for promoting positive development. Preventive interventions during this period are important because earlier experiences can shape long-term developmental trajectories (Eccles & Roeser, 2009). Such interventions are often delivered in settings such as family, school, and community, which theorists commonly acknowledge as major influences on development (Bronfenbrenner, 1979). Afterschool settings have received increasing attention as an important venue for supporting schools’ missions to promote both academic achievement and positive youth development (Eccles & Gootman, 2002; Kuperminc, Smith, & Henrich, 2013). These contributions from afterschool settings have grown as school settings face pressure to raise performance on standardized tests, which leaves less opportunity for non-academic activities (Mahoney & Zigler, 2006).
Accumulating research has shown that high-quality afterschool settings make a significant difference in outcomes such as social skills, motivation, and academic performance (Mahoney et al., 2007; Pierce et al., 2010; Pierce, Hamm, & Vandell, 1999). For instance, persuasive evidence demonstrates that participating in out-of-school offerings such as afterschool programs has a substantial impact on teacher-reported academic, social, and prosocial skills of both elementary and middle school students, with effect sizes for elementary students ranging from 0.21 to 0.51 (Vandell, Reisner, & Pierce, 2007). This research has spawned a growing number of efforts to improve process and practice in afterschool programs (e.g., Gortmaker et al., 2012).
Pianta and his colleagues have argued that validated and objective assessment of classroom processes is the foundation for programs, interventions, and policies to improve educational services (Hamre, Pianta, Mashburn, & Downer, 2007; Pianta & Hamre, 2009), and we believe this point applies to afterschool settings as well. However, few systematic, reliable, and well-validated methods exist for measuring the quality of afterschool settings. Compared with a long record of measurement tools developed for school, classroom, and early child care settings (for reviews, see Halle, Vick Whittaker, & Anderson, 2010; Pianta & Hamre, 2009), research on afterschool quality measurement is still in its early stage (see Yohalem & Wilson-Ahlstrom, 2010 for a review).
Our work concerns measures of afterschool program quality. Although research supports the benefits of attending afterschool programs (Durlak, Weissberg, & Pachan, 2010), positive effects are not observed in all afterschool programs. Some programs help promote positive youth development while other programs provide more opportunities for antisocial involvement and fewer opportunities for skill building (Mahoney & Stattin, 2000; Mahoney, Stattin, & Lord, 2004), leaving open the question of what constitutes quality afterschool programs. The development of reliable and valid measures is necessary for afterschool research seeking to establish which dimensions contribute most to program effectiveness and which program practices best enhance the dimensions of quality. Our study seeks to contribute to the field by examining two existing observation instruments in a sample of afterschool programs serving kindergarten up to middle school students: Promising Practices Rating Scale (PPRS; Vandell et al., 2004) and Caregiver Interaction Scale (CIS; Arnett, 1989). In the next section, we review the salient domains of afterschool program quality that are known to affect youth development and that these instruments intend to measure. We then review observational approaches to assessing the quality of afterschool programs, explain the ways in which our study advances beyond prior research, and then proceed to our empirical work.
Key Dimensions of Afterschool Quality
Supportive Relationships With Staff
A broad literature documents that supportive relationships with extra-familial adults help reduce problem behaviors and improve school-related outcomes (DuBois, Holloway, Valentine, & Cooper, 2002). Positive relationships with teachers have been conceptualized as a primary mechanism through which classroom experiences lead to positive youth outcomes (Pianta & Allen, 2009). Similarly, in afterschool research, supportive relationships with staff differentiate high-functioning afterschool programs from less effective ones (Eccles & Gootman, 2002; Grossman, Goldmith, Sheldon, & Arbreton, 2009). Specifically, supportive relationships with afterschool staff are related to increased learning and engagement in afterschool activities (Grossman et al., 2009), heightened sense of self-efficacy (Walker & Arbreton, 2004), fewer internalizing and externalizing problems (Pierce et al., 1999), and higher reading and math grades (Pierce et al., 2010).
Supportive Relationships With Peers
The accumulated body of research indicates that academic, psychological, social, and behavioral adjustment of children and youth is influenced by peer relations, whether measured as characteristics of peers or peer groups (Véronneau & Dishion, 2011), peer attachment, and peer support (Gonzales, Cauce, Friedman, & Mason, 1996) or friendship quality (Franco & Levitt, 1998). Furthermore, E. P. Smith, Faulk, and Sizer (2013) have shown that though supports from adult family members and the community are associated with reduced delinquency, positive peer interactions are more strongly related to positive youth development. Research evidence indicates that positive peer relations in afterschool programs are one of the primary mechanisms through which afterschool program participation affects a wide range of youth outcomes, including delinquent behavior (Gottfredson, Gerstenblith, Soulé, Womer, & Lu, 2004), internalizing and externalizing problems and social skills (Pierce et al., 1999), and sense of self-efficacy and response to social challenges (Walker & Arbreton, 2004).
Developmentally Appropriate Structure and Supervision
Provision of structured and supervised time after school is the core raison d’être of afterschool programs (Eccles & Gootman, 2002), and unstructured socializing with peers in the absence of adult supervision increases delinquency and problem behaviors among youth and adolescents (Osgood & Anderson, 2004). Mahoney and colleagues have found that participation in unstructured and less well-supervised programs increases rather than decreases youth involvement in antisocial behavior (Mahoney et al., 2004) while Gerstenblith and colleagues (2005) have shown that youth benefit from attending structured afterschool programs with organized transitions, planned activities, structured skill-oriented programming, and quality behavior management.
Youth Engagement
Opportunities for youth to make a difference or “matter” in their environments are associated with positive outcomes (Eccles & Gootman, 2002). McLaughlin, Irby, and Langman (1994) found that community-based programs with high levels of youth participation provided increased opportunities to build skills, competencies, and self-worth. Highly engaging activities offer opportunities that promote achievement, skill-building, and intrinsic motivation (Larson, 2000). Furthermore, youth involved in interesting programs are less likely to discontinue participation in the program (Perkins & Borden, 2003). Higher levels of engagement in afterschool programs are linked with positive youth outcomes, including increased social competence (Shernoff, 2010), improved intrinsic motivation (Mahoney et al., 2007), and decreased school suspension rates (Blazevski & Smith, 2007).
Measuring Quality in Afterschool Settings
We focus on observational measures of the setting-level quality of afterschool programs. Administrative data and surveys also could be considered for the assessment of setting quality. Administrative data offer a convenient way to collect information on compositional characteristics and features such as locale and size, but they do not capture the social processes (Raudenbush & Sampson, 1999) that intervention programs seek to change. Surveys can be used to collect information on social processes and aggregated to produce setting-level measures. This method has the advantage that setting quality is evaluated through the lenses of individual participants (i.e., staff and children) who know the setting well (Fraser, 1998), which is especially valuable for some purposes. However, the setting-level aggregates of individual perceptions may be colored by individual beliefs, histories, values, desires, and expectations (Kirtland et al., 2003), which may be problematic for other purposes. In fact, individuals’ perceptions of the same setting typically show a low level of agreement, which limits the reliability of survey-based setting-level measures (Raudenbush & Sampson, 1999).
Direct observational measures provide information from an uninvolved observer, who presumably has no personal interest in whether any given program receives higher scores than another (Nock & Kurtz, 2005). Observational measures are, of course, subject to their own sources of error, including observer drift over time, observer bias stemming from prejudices and expectations about the study and the subjects, and the reactivity of the subjects to being observed (McCall, 1984). Unlike survey-based methods, however, researchers can reduce observer errors by careful recruitment of observers, clear specification of observer roles, and adequate and continuous training (McCall, 1984; Skinner, Dittmer, & Howell, 2000).
The Present Study
Yohalem and Wilson-Ahlstrom’s (2010) review of 10 measures of afterschool program quality demonstrated that scholars have invested considerable effort in developing such measures. We seek to advance these efforts by examining the measurement properties of two instruments. We chose the Promising Practices Rating Scale (PPRS, Vandell et al., 2004) because it best matches the dimensions of quality we consider important (discussed above), among the measures with previous evidence of reliability and validity. 1 The PPRS is especially well-suited to our interests because it includes separate scales for supportive relationships with adults, supportive relationships with peers, structure, and youth engagement. In prior research, the PPRS has exhibited correlations with youth school-day academic performance, particularly among urban, ethnic-minority populations in the United States (Vandell et al., 2007). More information on youth who vary in race-ethnicity and geographic locale would be informative about the usefulness of this tool in assessing out-of-school time care quality.
The second measure we investigate, the CIS (Arnett, 1989), previously has not been used in afterschool settings. This instrument was designed to measure early child care settings, and we examine its applicability and utility in afterschool settings attended by older children and youth. The CIS is of special interest for differentiating several aspects of one of the most central domains of program quality, namely, interactions of staff with students. Although the present research is limited to setting-level assessments, a distinctive appeal of this scale is that it provides data useful for a broader range of purposes. Because the CIS examines the practices of individual staff, it would facilitate research that examines not only overall scores for programs, but also individual staff ratings, aggregated staff ratings, and the degree to which there is dispersion and variation among the staff (Shinn & Rapkin, 2000). Therefore, we believe it is worthwhile to assess whether our adaptation of the CIS has adequate measurement properties when used to assess afterschool programs for elementary and middle school students.
Our analyses of the measurement properties of the CIS and PPRS include assessments of internal consistency, inter-rater reliability, and dimensional structure. To determine whether measurement properties are consistent across types of programs, additional analyses compare afterschool programs that predominantly serve low income, ethnic minority, urban youth with those that do not. In addition to these standard psychometric topics, we address special issues for observational measures of settings that have received little attention for afterschool programs (Raudenbush & Sampson, 1999). Observations are subject to not only disagreement between observers but also to day-to-day fluctuations in program functioning. The greater this variability, the more the precision will depend on the amount of observation time. Estimates of variance due to these sources of error indicate the benefits of increasing the number of observers and occasions per site when designing observation systems.
Method
Participants
This study is part of LEGACY Together, 2 which is a randomized controlled trial study of a behavioral intervention in afterschool settings. The project involved 1,200 children and staff and 75 afterschool programs in Pennsylvania. Data were collected from 3 cohorts over a 3-year period (2009-2012) using data from various sources (children, staff, director, school teachers) and methods (direct observation, self-report surveys, documents).
The present study used data drawn from the observation of 44 afterschool programs that participated in the first 2 years of the larger program evaluation project. The programs were clustered in a limited set of geographic locations in central or eastern Pennsylvania, and inclusion required agreement to participate in a random trial of a program to enhance effectiveness. These afterschool programs were diverse in mission, locale, and demographic composition, which is a valuable strength for a measurement study. All the programs were run by community-based organizations and housed in school buildings. The programs included two 21st-Century Community Learning Centers, 23 programs operated by Young Men’s Christian Associations (YMCAs) in various communities, and 19 programs operated by private providers, with many of the latter participating in the Keystone STARS program—a quality rating system for improving child care settings in Pennsylvania. The primary activities of all the programs were snacks, homework, and recreation. Nine of the programs put greater emphasis on structured learning activities than did the others, but none was predominantly academic. The programs typically served youth from the end of the school day until 5:30 or 6:00 p.m. All operated 5 days per school week, with most (but far from all) students attending almost every day.
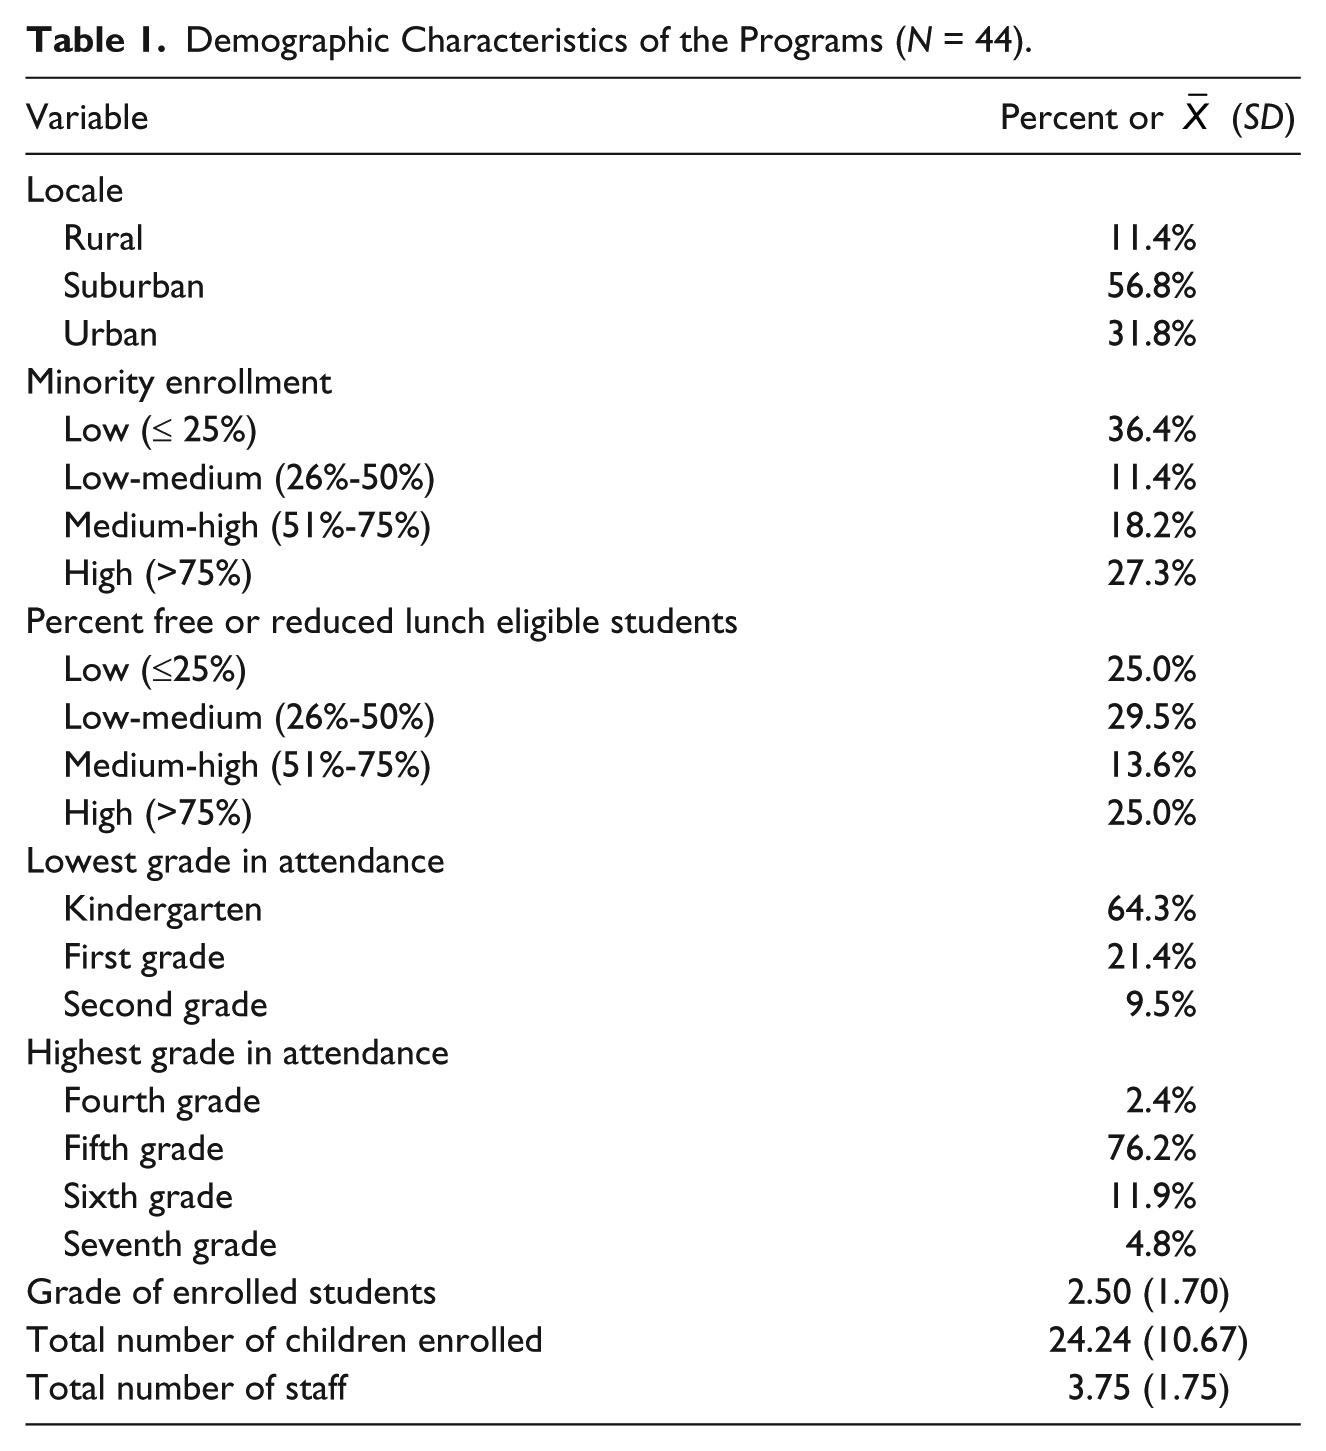
The demographic characteristics of the program participants appear in Table 1. The locales of the afterschool sites were 11% rural, 57% suburban, and 32% urban. In terms of racial/ethnic composition, 36% were predominantly White (minority enrollment ≤ 25%) and 27% of the programs had a high concentration of minority children (minority enrollment > 75%). The programs were also diverse in socioeconomic composition: 25% of the programs had disproportionately high percentages of low-income children with over 75% eligible for free or reduced-price meals while another 25% were economically advantaged with less than 25% eligible. These afterschool programs were small to moderate in size: The number of enrolled children ranged from 11 to 50 (
Demographic Characteristics of the Programs (N = 44).
Direct Observation Tools
Caregiver Interaction Scale
Developed by Arnett (1989), the original Caregiver Interaction Scale (CIS) consisted of 26 items examining the interactions of caregiving staff with preschool children in the following 4 areas: (a) harshness and more authoritarian manner, expecting children to rigidly conform to adult rules and behavior; (b) sensitivity, which is defined as not only communication with young people but the provision of appropriate levels of guidance, redirection, praise, and contingent rewards; (c) detachment, uninterested in children and involved in more adult-oriented activities that exclude interaction with children; and (d) permissiveness, the degree to which staff fail to appropriately provide guidance and redirection when necessary. Based on our pilot work, we adapted some of the items to make them more observable and as unambiguous as possible, resulting in 23 items (see Table 2 for the full list of items). Trained field observers rated up to 3 permanent, non-volunteer staff 3 in each afterschool program on a 4-point response scale indicating the extent to which they engage in a particular behavior or practice: 1 = never (0%); 2 = few instances (1%~30%); 3 = many instances (31%~60%); and 4 = consistently (>61%).
Sample Descriptive Statistics and CFA Result for CIS (N = 722).

Note. CIS = Caregiver Interaction Scales; CFA = confirmatory factor analyses.
Reverse-coded items.
Promising Practices Rating Scale
The Promising Practices Rating Scale (PPRS) is an observational tool developed by Vandell and colleagues (2004) to study the relationship between afterschool program quality and youth outcomes. The PPRS collects information on types of activities offered in afterschool programs, resources available for those activities, and various dimensions of program quality and practices during those activities. These dimensions included supportive relations with adults, supportive relations with peers, level of engagement, opportunities for cognitive growth, appropriate program structure, over-control, chaos (a problematic manifestation of inadequate structure), and mastery orientation.
We modified the original version of the PPRS in several ways. In the original PPRS, each dimension of program quality was assessed by a single global item with a 4-point scale indicating the extent to which a given construct is characteristic of the program (1 = highly uncharacteristic, 2 = somewhat uncharacteristic, 3 = somewhat characteristic, and 4 = highly characteristic). Single-item measures, however, may have limited reliability (Nunnally & Bernstein, 1994). In order to address this concern, we developed multi-item subscales representing each dimension of program quality by treating specific exemplars for each dimension provided in the PPRS as separate items that could serve as subscale components. If the PPRS manual included more than four exemplars, then four were chosen to represent as much as possible the full range of content in the entire set. 4 The ratings on the set of items for each dimension were then averaged to obtain a subscale score.
Next, we modified the standard PPRS observational protocol, which calls for the observation of six successive activities for 15-minute intervals (Vandell et al., 2004). Our data collectors instead observed three successive activities during each day of observation for an afterschool program. Doing so reduced the required time, which was necessary for gathering other data. Compensating for this reduced sample of activities at each visit, we observed each program twice over a period of 4 to 6 weeks. This provided an equal amount of observing time while also enabling us to determine the contribution of day-to-day variation to measurement error.
Another modification was to omit three of the PPRS subscales, Over-Control, Mastery Orientation, and Opportunities for Cognitive Growth, because the program being evaluated did not seek to affect these dimensions. Our implementation of the PPRS scale therefore consisted of 17 items, with the following five subscales: Supportive Relations With Adults, Supportive Relations With Peers, Level of Engagement, Appropriate Structure, and Chaos (see Table 3 for the list of items).
Sample Descriptive Statistics and CFA Result for PPRS (N = 1,092).

Note. PPRS = Promising Practices Rating Scales; CFA = confirmatory factor analyses; SRS = Supportive Relations With Adults; SRP = Supportive Relations With Peers; AS = Appropriate Structure; LE = Level of Engagement.
Data Collection Procedure
Direct observation is a complex and costly approach to setting-level measurement, but likely provides the least biased assessment of social ecological settings. As discussed above, quality observation-based setting measures require quality observation systems. We sought to enhance reliability through a carefully designed observation system with clear operational definitions, trained observers, and well-established systems of data recording.
To assess the quality of afterschool settings, observational data were collected 5 times across the academic year—twice in the fall with 4 to 6 weeks between observations, once in January to February, and twice in the spring in 4- to 6-week intervals. Approximately half of the observations in fall, winter, and spring were conducted with two observers per site. Given the variability of activities and staff in afterschool we thought that multiple measurements on varying days with varying observers would be necessary to characterize the nature of these afterschool programs accurately (Raudenbush, Martinez, Bloom, Zhu, & Lin, 2011). Observers were instructed that on each visit they should observe the full range of activities offered that day and as broad a sample of the staff and students as possible. The mean number of observers per site visit was 1.7. On average, 1.97 staff members and 2.95 activities were rated for each combination of site, occasion, and observer. In total, 722 ratings were obtained for each CIS item and 1,092 ratings for each PPRS item, which served as the analytic sample for this study. A total of 14 observers collected the data reported here. Observers for each site varied across rounds.
Observers participated in an initial training consisting of two 8-hour sessions that included an overview of the constructs and measures, showing videos illustrating the concepts, and scoring practices and discussion. Training was conducted by project research staff and the university survey research center that managed the data collection effort. The training also included live-practice in afterschool programs. Two additional booster trainings occurred before the winter and spring data collection periods. In the first year, the data manager conducted a portion of the observations with the data collectors so that observer scores could be verified with a “Standard Coder.” Beginning with the second year, the data collectors were required to attend a refresher training for each wave of data collection and pass a reliability test on which they had to attain at least 80% agreement (within one scale point) with scores agreed on by research team members, known as our Gold Standard Video (GSV) process (Stuhlman, Hamre, Downer, & Pianta, 2010). The GSV scores were established by consensus of the research team after viewing and discussing the videos and establishing agreement of at least 80% and often 90% within the research team of 3 to 4 members. Data collectors scoring beneath 80% on any scale received a call from the GSV coordinator, who would inquire about why certain scores were given and discuss the GSV score and the rationale. This process was completed before the deployment of observers to the field. This served as a way to prevent drift and promote the reliability and accuracy of observer ratings (Stuhlman et al., 2010). The data collectors used mini-laptop computers to record the observations in real time and then transmitted the data to the project offices.
Analysis and Results
Statistical analyses were conducted in the following steps: (a) descriptive and internal consistency reliability analyses; (b) intra-class correlation coefficients to examine inter-rater reliability; (c) confirmatory factor analyses (CFAs) to evaluate the construct validity of each scale, followed by multiple group CFAs for different types of afterschool programs; (d) finally, generalizability theory analyses of reliability in light of multiple sources of measurement error. Explanations of the analytic procedures for each step are detailed below in the corresponding sections, followed by the presentation of the results.
Descriptive Data and Internal Consistency Reliability
The scales and items were evaluated in terms of descriptive statistics and internal consistency (Cronbach’s α). Here, alpha reflects the coherence of an observer’s ratings, for a single segment (i.e., staff or activity) in a single program at a single time, across the items assessing that concept (N = 722 for CIS; N = 1,092 for PPRS). We used the conventional criteria of .70 for an acceptable level of coefficient alphas (Nunnally & Bernstein, 1994).
Caregiver Interaction Scale
Table 2 presents descriptive statistics for each of 23 CIS items and Cronbach’s alpha within each subscale, reflecting the original four-dimensional model of the CIS. The means and standard deviations of the Harshness items were smaller than those of other items in a scale, reflecting that these actions were not as common as the other behaviors. Cronbach’s alpha estimates were adequate for all CIS subscales, ranging from .79 to .90, and the entire scale, merging all subscales, had a high alpha of .91.
Promising Practices Rating Scale
Table 3 presents descriptive statistics for PPRS items and Cronbach’s alpha within each of the hypothesized five subscales of the PPRS. All five dimensions of the PPRS achieved acceptable alpha values (.76-.89). The overall Cronbach’s alpha estimate for the entire PPRS scale was .86, indicating good internal consistency.
Inter-Rater Reliability
The level of agreement between observers is a crucial aspect of the quality of our measures. Inter-rater reliability was assessed with intra-class correlation coefficients (ICCs) reflecting the percent of variance shared across observers rating the same program at the same time, rather than unique to one observer. The reliability associated with the ICC values depends on the number of observers used in any study, with more observers yielding more reliability assessments. We therefore illustrate the implications of ICCs by reporting reliabilities computed both for a single observer and for the average number of observers in our data (1.7; McGraw & Wong, 1996).
The results of the analyses of inter-rater reliability for the CIS, the PPRS, and their subscales appear in Table 4. The reliability for a measure that is the average of two raters was .77 for overall measures of both CIS and PPRS. The analyses of subscales yielded average inter-rater reliabilities (for an average of two raters) ranging from .59 to .75 for the CIS subscales and from .56 to .69 for the PPRS subscales. According to criteria proposed by Fleiss (1981; i.e., <.40, poor; .40-.59, fair; .60-.74, good; >.74, excellent), inter-rater reliability values for a majority of our scales and subscales were good or above. Note that the ICC values imply that measures based on observations by a single rater would have less satisfactory reliability.
Inter-Rater Reliability.
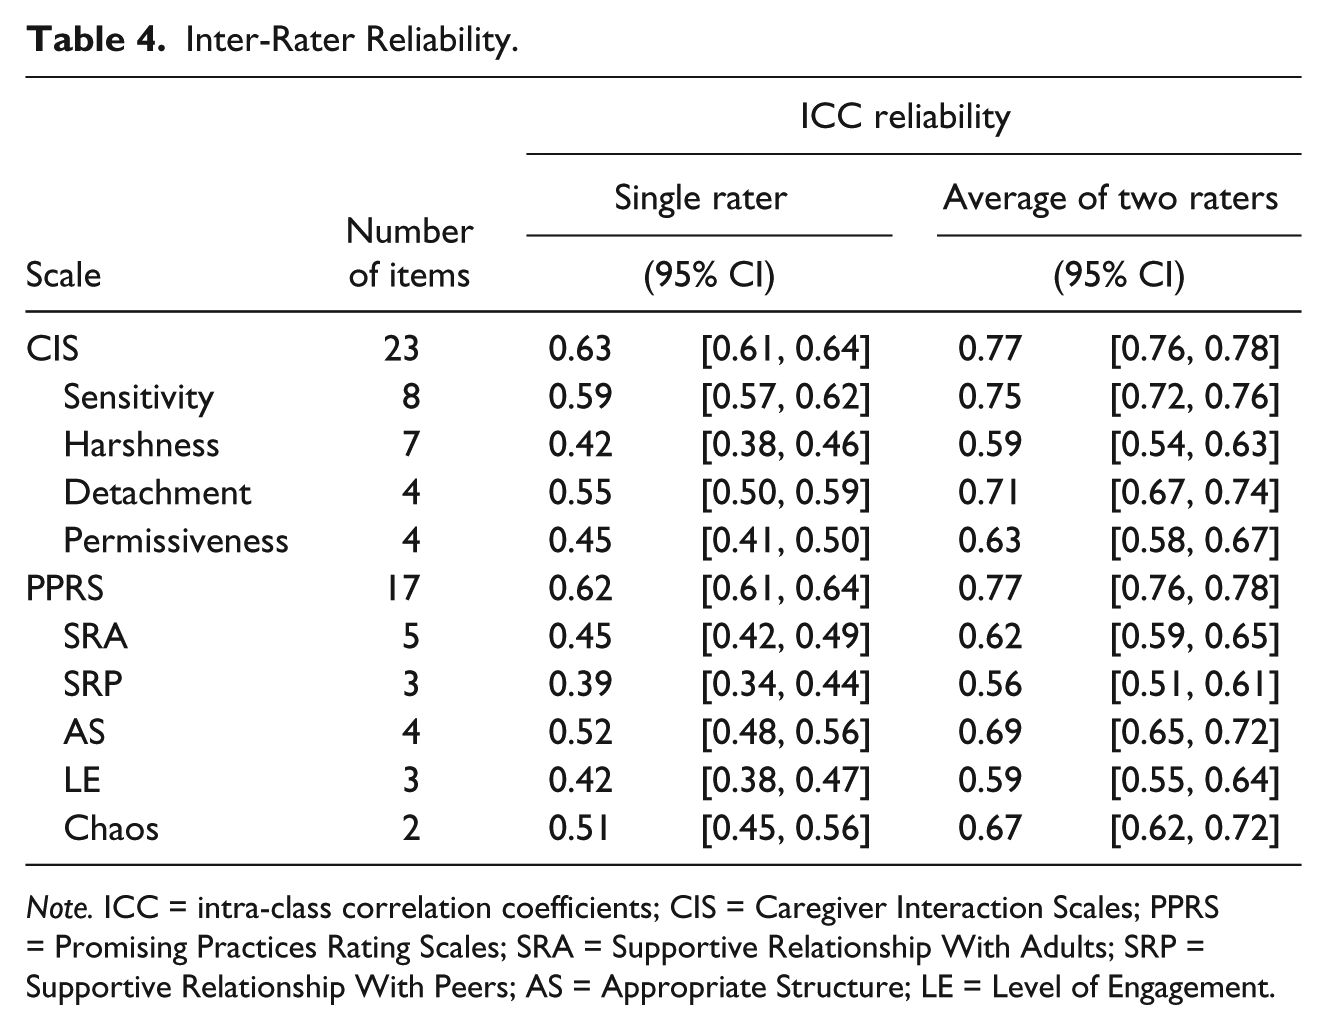
Note. ICC = intra-class correlation coefficients; CIS = Caregiver Interaction Scales; PPRS = Promising Practices Rating Scales; SRA = Supportive Relationship With Adults; SRP = Supportive Relationship With Peers; AS = Appropriate Structure; LE = Level of Engagement.
Construct Validity: Confirmatory and Exploratory Factor Analysis
We tested the consistency of our data with the hypothesized factor structures of the CIS and PPRS through CFA using AMOS 20 software (Arbuckle, 2011). We used a bootstrapping procedure because several items in both instruments were distributed non-normally (Brown, 2006). The results of the CFAs indicated little discrepancy between the bootstrap estimates and their original Maximum Likelihood (ML) counterparts, so we report only the results of the standard ML estimation based on the normality assumption. There was a fairly high rate of missing cases for the PPRS Item 11, “staff cooperation and consistency” (25.7%), because the item was “not applicable” to afterschool sites with only one staff member present at the time of observation, which we addressed through the multiple imputation procedures of AMOS, using five imputed data sets.
We evaluated the adequacy of fit for each model using indices commonly recommended in the literature including Tucker-Lewis Index (TLI), comparative fit index (CFI), standardized root mean square residual (SRMR), and root mean square error of approximation (RMSEA; Brown, 2006). In the present study, we adopted cut-off values of >.90 for TLI and CFI and <.08 for SRMR and RMSEA (Bentler, 1990; Browne & Cudeck, 1992). In case the result of the CFA did not support the a priori factor models, we conducted an exploratory factor analysis (EFA). The EFA analyses used a random split half of the full sample to identify a factor model, the fit of which we then tested through a CFA using the other half of the sample.
In addition, we were interested in determining whether the measurement models held across different types of afterschool programs. We split the sample programs into two groups based on the socio-demographic compositions of student body, using the criterion of economic disadvantage. About 40% of the afterschool programs in the sample (17 of 44) were classified as economically disadvantaged due to more than 50% of the student population being eligible for free or reduced-price meals. These programs also served predominantly ethnic minority students (16 of 17 for the disadvantaged group versus 4 of 27 for the advantaged group) and urban populations (13 of 17 for the disadvantaged group versus 1 of 27 for the advantaged group). Thus, the contrast between these sets of programs provides an appropriate test of whether previous examinations of the reliability and validity of the PPRS generalize beyond previous assessments for programs serving disadvantaged, urban, minority populations.
We performed a series of nested multiple group CFA to test the equivalence of factor pattern, factor loadings, factor intercorrelations, and residual variance across afterschool programs serving more disadvantaged students and relatively advantaged students. We began with a baseline model with no constraints across the two sets of programs except that the same factor structure was applicable to both groups (Model 1), and we subsequently tested three increasingly restrictive models. Model 2 constrained factor loadings to be equal, Model 3 added the constraint of invariant factor variance/covariance, and Model 4 included the constraints from Model 3 plus the restriction of equal error variances across the two groups (Vandenberg & Lance, 2000). To compare the relative fit of the nested models, we relied on changes in CFI index, following Cheung and Rensvold’s (2002) guideline of 0.01 or smaller as support for invariance.
Caregiver Interaction Scale
Table 2 shows the standardized factor loadings obtained from the CFA of the a priori four-factor model from Arnett (1989); that is, sensitivity, harshness, detachment, and permissiveness. Items 12 and 20 had low factor loadings of 0.17 and 0.29, respectively, which indicates that these items do not significantly contribute to their hypothesized factor. The poor performance of item 12 is understandable, in that observers almost never reported negative physical contact (
As the hypothesized four-factor model was not supported by our data, we performed an EFA on the first half (n = 364) of the randomly split data set (see Online Appendix A, Table A1, for descriptive statistics) using principal axis factoring with promax oblique rotation. The eigenvalues for the first four factors obtained were 5.92, 2.08, 0.90, and 0.59. We retained the third factor because it proved to exceed Kaiser’s criterion (i.e., eigenvalues > 1) after rotation. The total variance accounted for by the 3 factors was 49.85%. Both pattern and structure matrices (Online Appendix A, Table A2) showed a relatively clear three-factor solution: Factor 1 consists of a combination of the original model’s Sensitivity and Detachment subscales (CIS-SD), Factor 2 represents the Harshness subscale (CIS-H), and Factor 3 corresponds to the Permissiveness subscale (CIS-P). Most items loaded strongly on their expected factors, but there were some exceptions with weak or mixed loadings. Items 12 and 20 did not strongly load on any factors, Item 6 had a substantial and inappropriate secondary loading, and Item 19 loaded highest on a factor other than the intended one.
We re-ran the EFA after removing those four items with problematic loadings. For this EFA, three factors accounted for 53.77% of the total variance (the first factor 33.41%, the second 12.11%, and the third 8.25%). All 19 items showed unique factor loadings of more than 0.4 on their intended factors (Online Appendix A, Table A3). We then replicated this EFA solution via CFA with the second half of the sample (n = 358). The fit results of the CFA for this three-factor model with 19 items indicated an adequate fit to the data—specifically, χ2(149, 722) = 469.31 (p < .001), TLI = 0.914, CFI = 0.925, RMSEA = 0.078 (90% CI = [0.07, 0.086]), and SRMR = 0.061. The EFA results indicate that the remaining modest lack of fit stems from secondary cross-loadings of items on other factors, which do not appear problematic in relation to much stronger primary loadings. As displayed in Table 5, all the standardized factor loading for the 19 items were above the conventional cut-off value of 0.5, and 13 items had values of 0.7 or higher. The refined subscales yielded very favorable Cronbach’s alphas of .92, .83, and .87 for CIS-SD, CIS-H, and CIS-P, respectively. The correlation statistics indicated that the CIS-SD subscale had moderate correlations with the CIS-H (−.36) and the CIS-P (−.53), but the CIS-H and the CIS-P showed minimal intercorrelation (−.05).
CIS Item Fit to the Revised 3-Factor Model (N = 358).
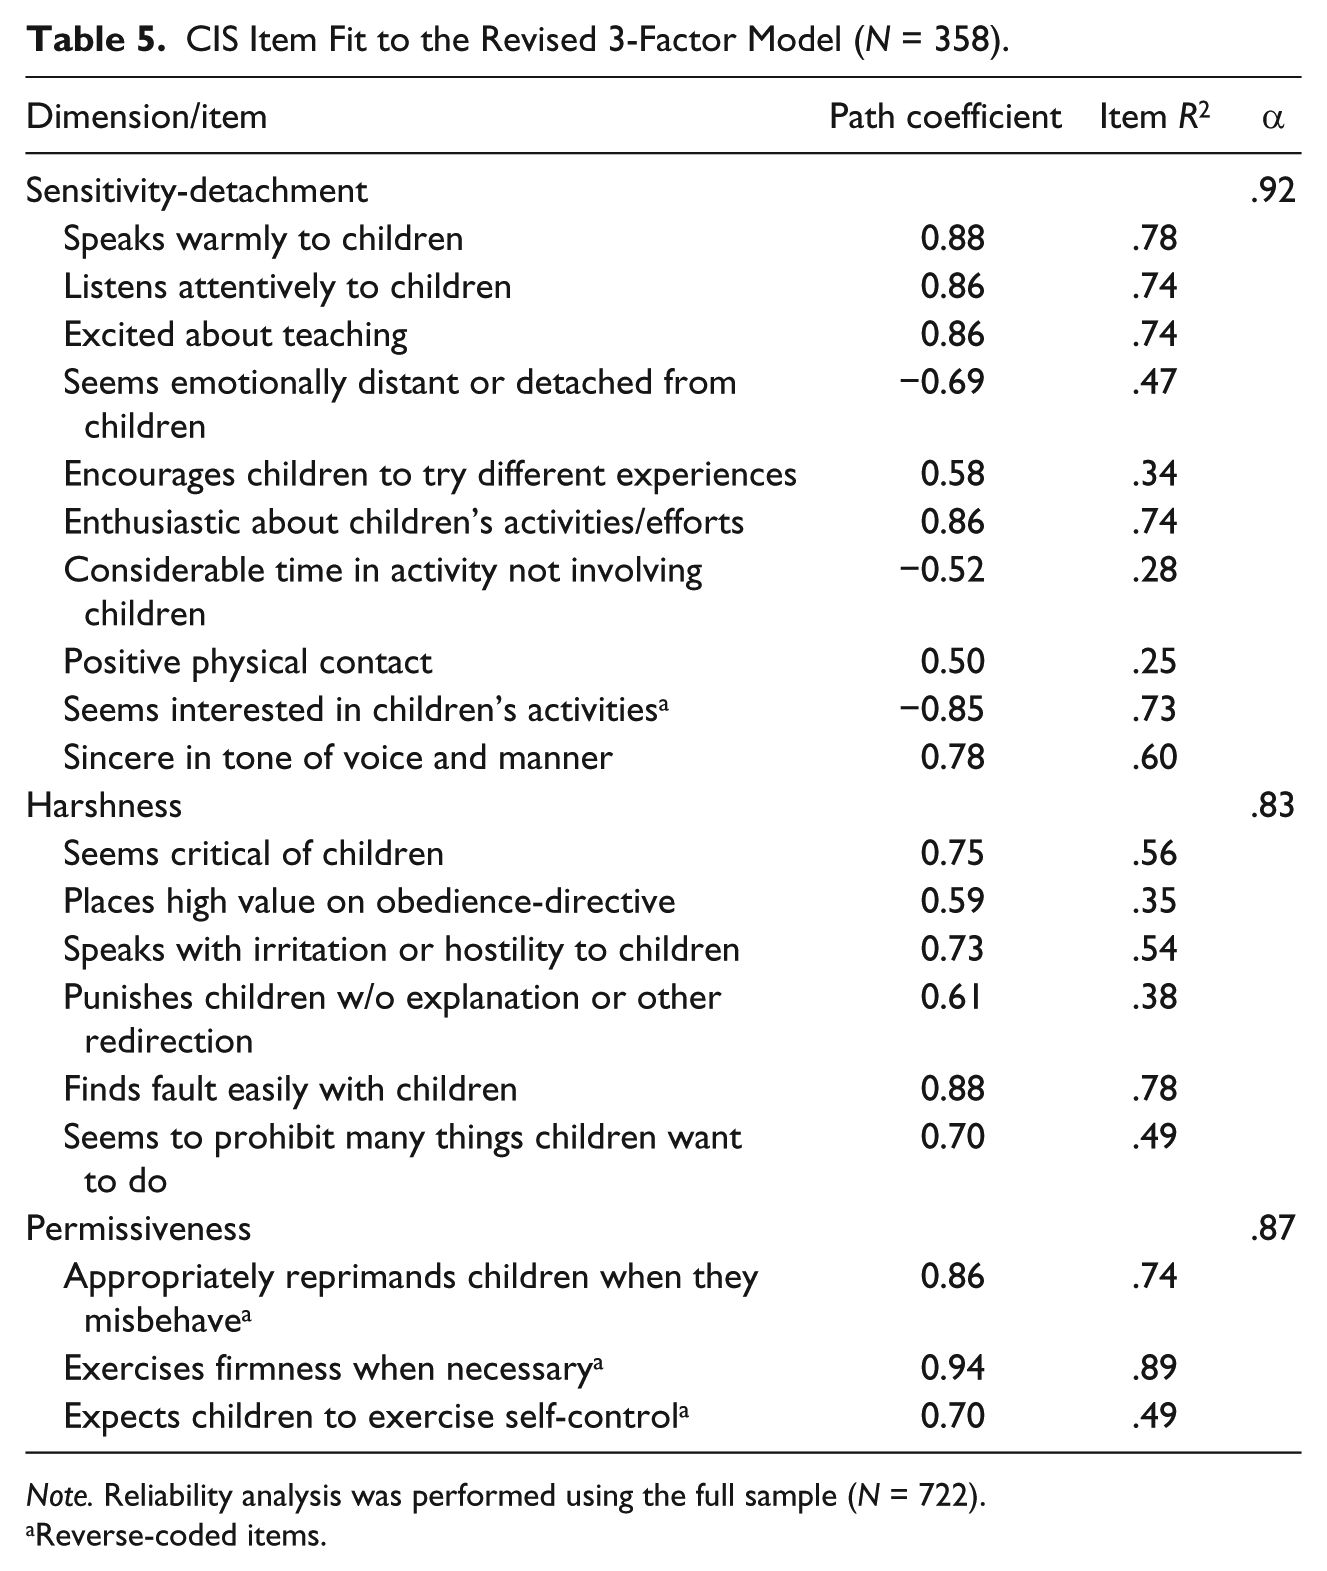
Note. Reliability analysis was performed using the full sample (N = 722).
Reverse-coded items.
The results of multiple group CFAs indicate that the factor configuration is invariant across the two types of afterschool programs. The baseline model showed an adequate fit with CFI = 0.923, RMSEA = 0.054 (90% CI = [0.05, 0.058]), and SRMR = 0.059. The incremental changes in CFI between the two nested models were smaller than 0.01 for all levels of invariance, providing support for invariance in factor loadings, factor variance/covariance, and error variance across the two groups (see Online Appendix A, Table A4, for full results).
Promising Practices Rating Scale
Table 3 shows the standardized factor loadings and item R2 obtained from the CFA of the hypothesized five-factor model of the PPRS, that is, Supportive Relationship With Adults (PPRS-SRA), Supportive Relationship With Peers (PPRS-SRP), Appropriate Structure (PPRS-AS), Level of Engagement (PPRS-LE), and Chaos (PPRS-C). For all PPRS items, standardized factor loadings were above the conventional cut-off value of 0.5, ranging from 0.52 to 0.90. In particular, all items in the PPRS-SRP and PPRS-C subscales had factor loadings greater than 0.80. The values of key fit indices indicated that the proposed five-factor model of the PPRS scale was an adequate fit for the data in our afterschool sample; specifically, TLI = 0.925, CFI = 0.94, RMSEA = 0.033 (90% CI = [0.032, 0.034]), and SRMR = 0.045. The correlations among subscales were moderate to moderately high, with the lowest correlation between PPRS-SRP and PPRS-C (−.53) and the highest between PPRS-SRA and PPRS-AS (.73).
Having established a five-factor model in the overall sample, we examined measurement and structural invariance of the PPRS across afterschool programs of different composition. The results are given in Online Appendix A (Table A5). The baseline model yielded an adequate fit with CFI = 0.923, RMSEA = 0.059 (90% CI = [0.055, 0.063]), and SRMR = 0.051, suggesting that the factor pattern was consistent between afterschool programs serving more advantaged and disadvantaged populations. There was no significant change in CFI between Model 1 and Model 2, which indicates no decrement in fit and thus supports the interpretation of factor loading invariance. Comparing Model 2 and Model 3, the incremental change in CFI was also less than the cut off value of 0.01, which provides support for the invariant factor variance/covariance across the two groups. However, the difference in CFI between Model 3 and Model 4 was above the threshold of 0.01, indicating a significant reduction in model fit. As the assumption of invariance in error variance did not hold for the PPRS, we examined modification indices and identified the errors for Items 1, 2, 4, 8, 9, 12, 14, and 15 as lacking invariance. The additional analysis in which error variance for these items was not constrained to be equal yielded a CFI change of less than 0.01, confirming partial invariance in error variance across the two groups.
Generalizability Theory–Based Reliability
Given that our afterschool program quality measures derive from a complex measurement strategy involving multiple observers and multiple observational visits, we applied generalizability (G) theory in addition to those more traditional analyses based on classical test theory. While classical test theory treats error variance as undifferentiated random variation, G theory partitions error variance into multiple sources (Raudenbush et al., 2011; Shavelson & Webb, 1991). Doing so enables us to assess the relative contributions to the reliability of measurement of each of the different sources of error and their combinations, versus the genuine variation between programs. This information, in turn, informs decisions about how the quality and efficiency of behavioral observations can be maximized through measurement design.
In the present study, our concern is estimating qualities of afterschool programs assessed through multiple observations, each of which is a joint product of the judgment of the observer and the specific events that occurred at that time. Each observer would make somewhat different judgments, and the events to be observed will differ from day to day. Thus, in research on the quality of afterschool programs, we are interested in determining the impact of observers, occasions (which we refer to as rounds of assessment), and their combinations on the reliability of our observational measures. 5 More specifically, our measurement design allowed us to estimate five separate sources of variance: (a) between-site variance, which corresponds to true score variance in classical test theory given that site is the target of measurement; (b) observer variance, reflecting observer-to-observer differences in their average ratings of afterschool program quality; (c) variance across rounds, nested within site, which represents the changes in the ratings of the quality of any program from one round to another; (d) site-by-observer interaction, indicating the extent to which between-site differences in the ratings varied across observers; and (e) error variance confounded with the interaction between observer and round nested within site, which reflects the extent to which between-observer differences varied across rounds within sites.
We used repeated-measures analysis of variance framework to conduct a G-study of these sources of variation. The resulting variance component estimates were then used to calculate reliability coefficients under the given measurement condition and also with hypothetical variation in numbers of observers and rounds. The latter is referred to as a decision study or D-study. We calculated two types of reliability coefficients: generalizability coefficient for relative decisions and dependability index for absolute decisions (Shavelson & Webb, 1991). Online Appendix B provides greater detail on generalizability theory-based methods.
As mentioned earlier, each of the afterschool programs in our study was visited 5 times for site observations. Among the five rounds of data collection, the first two rounds were intended to establish pre-intervention characteristics of the afterschool program while the last two rounds were used to obtain stable estimates of post-intervention program characteristics. To conduct a generalizability study independent from the influences of the intervention, we stacked pre- and post-intervention data after assigning new site IDs to post-intervention data, thereby treating the pre- and post-data as though they represented different sites. The data from the interim round (third round) were not included in the current analysis. As a result, the analysis includes a total of 276 data points (44 × 2 sites, 2 rounds, 1-2 observers).
Results of the G-study
Table 6 presents the variance component estimates for each of three CSI and five PPRS scales as well as the reliability coefficients obtained for our research design. The amount of variance attributable to each component varied across scales. The “true score” variance of interest, site (
Variance Components Analysis Results (N = 276).
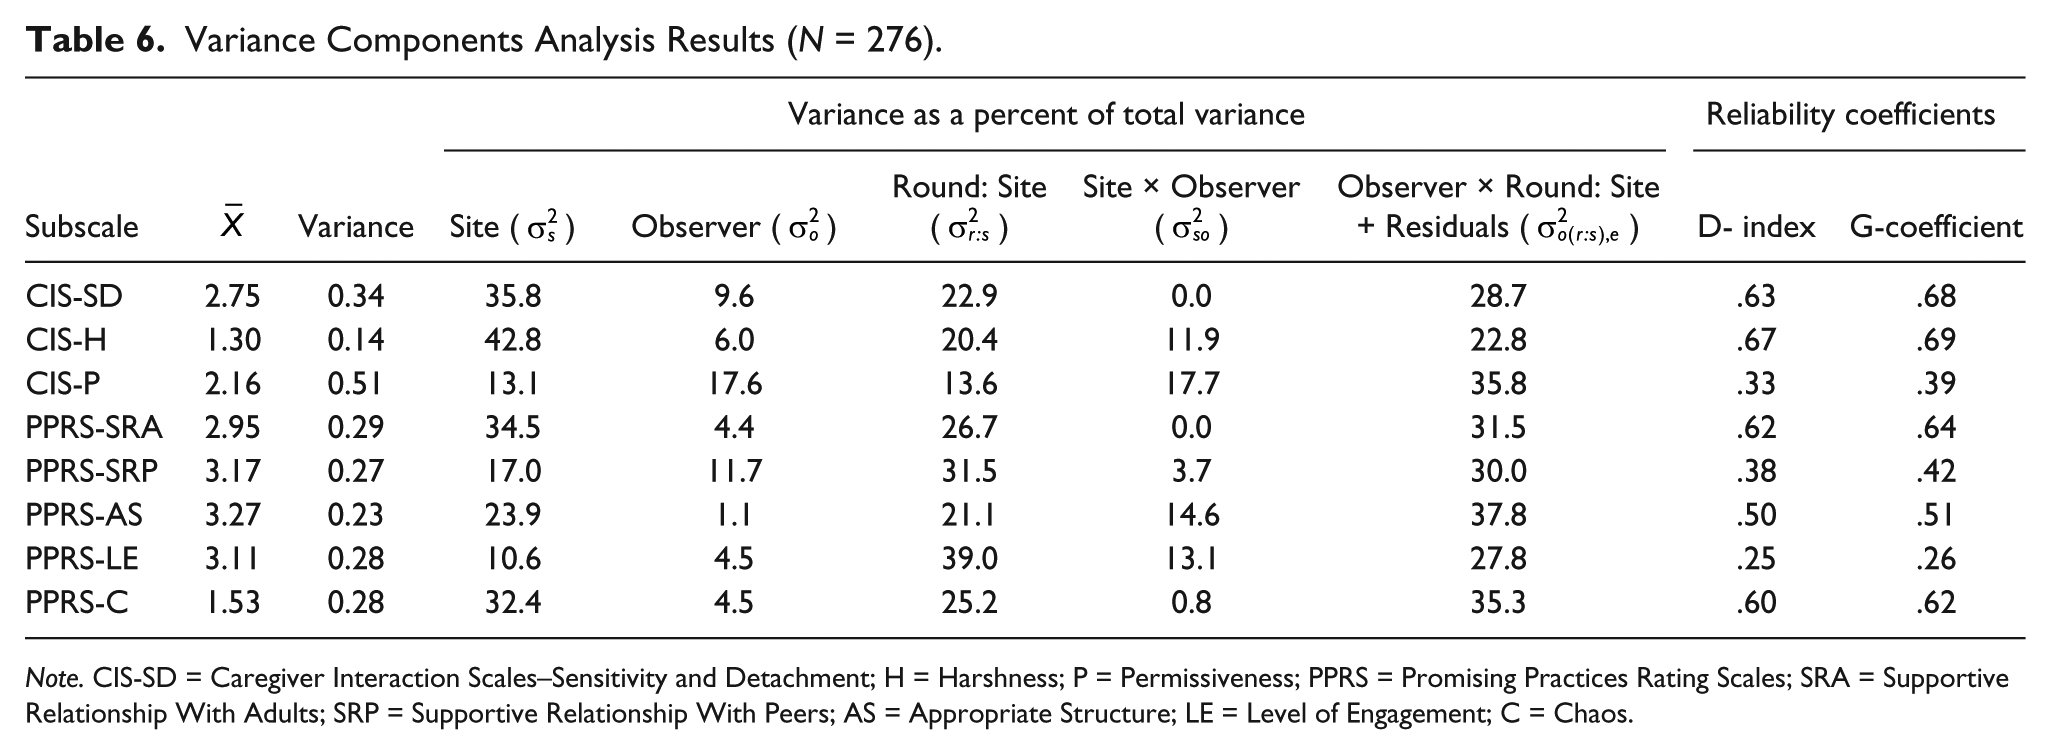
Note. CIS-SD = Caregiver Interaction Scales–Sensitivity and Detachment; H = Harshness; P = Permissiveness; PPRS = Promising Practices Rating Scales; SRA = Supportive Relationship With Adults; SRP = Supportive Relationship With Peers; AS = Appropriate Structure; LE = Level of Engagement; C = Chaos.
Table 6 also reports the two types of reliability coefficients calculated, given the number of rounds and observers for the current research design. Reliability coefficients varied across the scales, with generalizability coefficients ranging from .26 to .69 and dependability indices ranging from .25 to .67. There was little difference between generalizability coefficients and dependability indices because the variance attributable to observer was small relative to the other components. Detailed variance component results specific to each scale are presented below.
For CIS-SD, CIS-H, and PPRS-SRA, the largest proportion of observed score variance was accounted for by site (35%-43%), indicating that these afterschool programs differed systematically in terms of staff’s sensitivity-detachment and harshness and overall relationship between staff and youth. The second largest proportion of variance was attributed to the observer-by-round interaction plus unexplained variance (23%-32%). The next largest proportion of variance was explained by round nested within site (20%-27%), indicating that there were fairly substantial changes in the ratings of program quality from round to round within sites. The variances due to observer and site-by-observer interaction were relatively small, revealing that the relative standing of afterschool programs was constant across observers. The small proportion of variance attributable to observer (4%-10%) also indicates that there were minimal differences in the mean ratings of these three scales across observers. Reliability coefficients were relatively high for these scales. Under the given measurement condition, generalizability coefficients were .64, .68, and .69, and dependability indices were .62, .63, and .67, for PPRS-SRA, CIS-SD, and CIS-H, respectively.
For PPRS-C and PPRS-AS, a substantial amount of variance was explained by site (32% and 24%), but the largest amount of variance was attributable to the observer-by-round interaction confounded with residual error (35% and 38%). Another large source of error was the variance due to round-to-round differences within a site (21% and 25%). The site-by-observer variance was negligible for PPRS-C (0.8%), but fairly substantial for PPRS-AS (15%). The proportion of variance attributable to observer was small for both scales, 1% for PPRS-AS and 5% for PPRS-C. Given the conditions of our measurement procedure, both generalizability coefficients and dependability indices were about .6 for PPRS-C and around .5 for PPRS-AS.
The last three scales, CIS-P, PPRS-SRP, and PPRS-LE, consisted of a relatively small percentage of variance attributable to sites (13%, 17%, and 11%, respectively) and thus a relatively larger percentage of variance due to the error components. This led to low reliability coefficients, with generalizability coefficients of .26 (PPRS-LE), .39 (CIS-P), and .42 (PPRS-SRP), and dependability indices of .25 (PPRS-LE), .33 (CIS-P), and .38 (PPRS-SRP). In particular, for PPRS-SRP and PPRS-LE, the between-round variance and observer-by-round interaction plus error together explained roughly two thirds of the observed score variance. For CIS-P, the between-observer variance and site-by-observer variance together accounted for 35% of the total variance, much more than the other scales.
Results of the D-study
Using the variance component estimates obtained from the generalizability study, we calculated dependability indices for different numbers of observers (1-10) and different numbers of rounds within a site (1-4). Figure 1 shows how dependability indices will change across different combinations of numbers of observers and rounds for each of eight observation scales. It is evident that a single round of observation would not produce an adequate level of reliability. Figure 1 also shows that increasing the number of observers and/or the number of rounds raises the dependability index, but that returns diminish as the number of either increases beyond a few. For example, the estimated dependability index of the CIS-H scores is about 0.80 for a 4-observer and 4-round design and around 0.85 for a 10-observer and 4-round design.
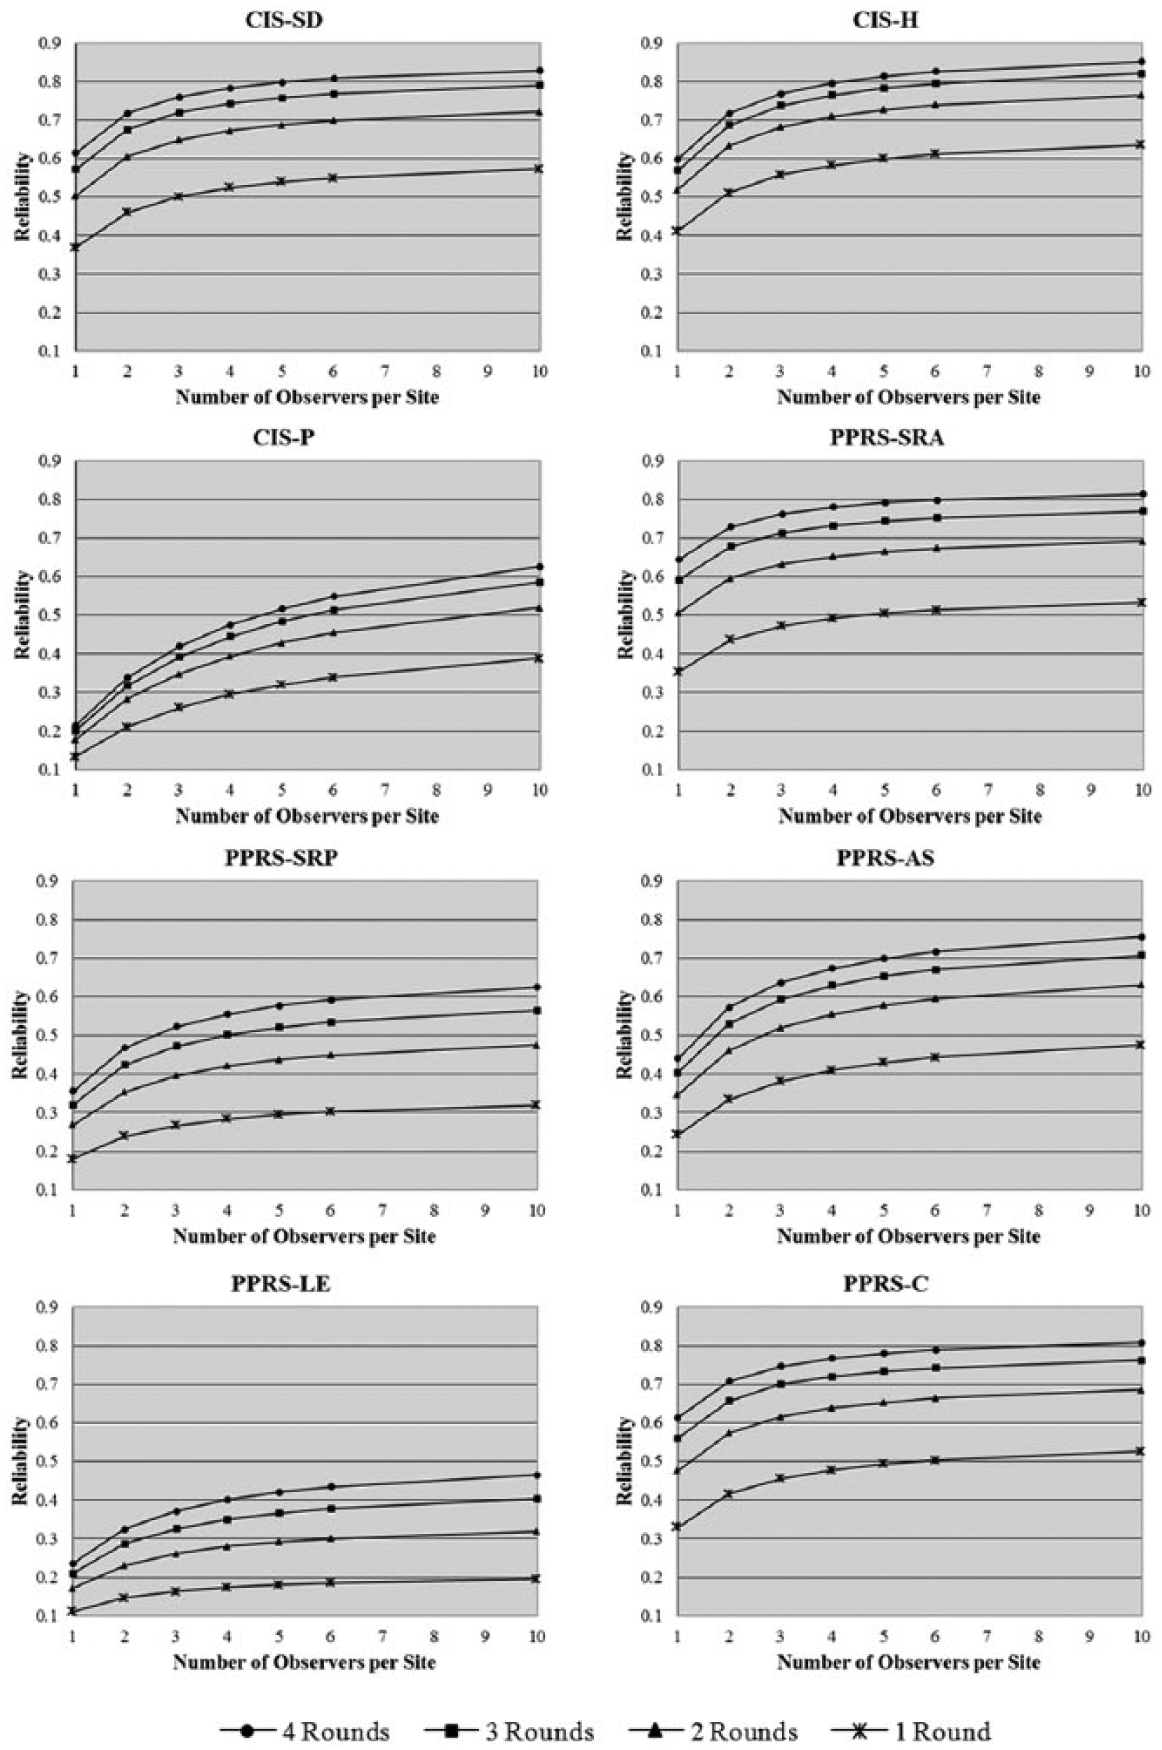
Reliability coefficients across observers and rounds for the CIS and PPRS scales.
However, the extent of gains achieved by adding the number of rounds or observers varies somewhat across scales, reflecting which error variance components are largest for each of them. Particularly notable is that the CIS-P Scale benefits more by increasing the number of observers than the number of rounds while the opposite is generally the case for other scales. Figure 2 illustrates that the addition of observers and rounds has substantially different impacts on CIS-P and PPRS-LE, for example.
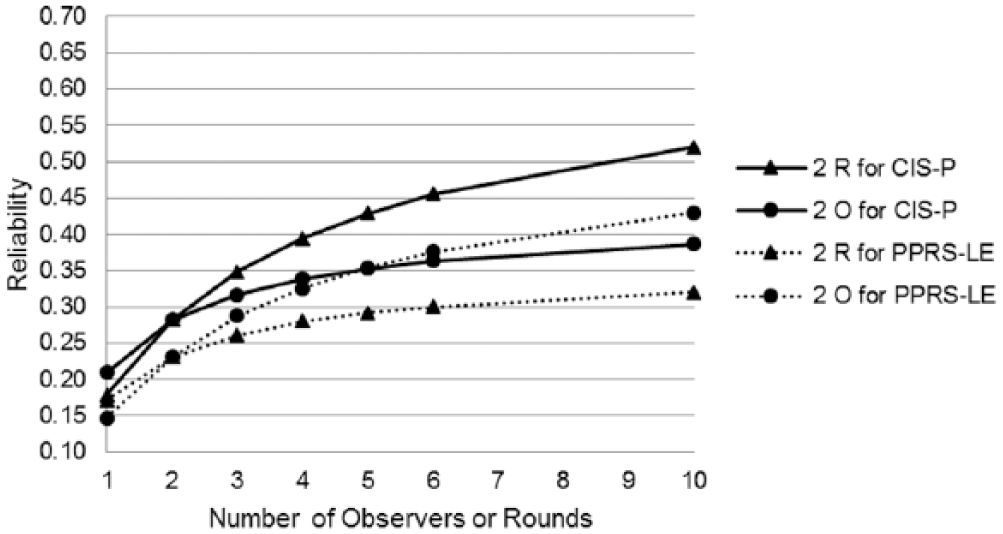
Reliability coefficients for different combinations of observers and rounds for CIS-P and PPRS-LE.
Discussion
Assessment of settings is a more complex enterprise than assessment at the individual level. Given the importance of social ecological settings for youth development, however, it is as important to assess the quality of these settings as units in their own right as it is to measure individual-level features (Raudenbush & Sampson, 1999). As today’s youth spend a considerable amount of time in afterschool settings, these settings are increasingly viewed as a major social context for youth development, and they are of great interest to parents, educators, researchers, and policy makers. The quality of afterschool settings is particularly relevant to school practices and policies, given a wealth of research evidence that teaching and learning processes could be enhanced or impeded by what students bring into class (Davis, 2006). Students’ behaviors, attitudes, skills, and competencies are likely improved by positive experiences and activities available in high-quality afterschool settings, which would, in turn, lead to creating better contexts for teaching and learning in school.
In response to a growing need for tools to assess the quality of afterschool settings (Granger, 2005), the present study examined whether the CIS and PPRS could serve as reliable and valid measures of the quality of afterschool settings, and the results are promising. Since its publication (Arnett, 1989), the CIS has been widely used to rate caregiver–child interactions in early child care research (e.g., Campbell & Milbourne, 2005; de Kruif, McWilliam, Ridley, & Wakely, 2000). Most of this research has reported good interrater reliability and internal consistency, but despite its wide use, its hypothesized factor structure or dimensionality has been relatively unexplored.
Our analyses revealed that a three-factor solution best described our data, indicating that the dimensions underlying the CIS are sensitivity-detachment, harshness, and permissiveness, merging the sensitivity and detachment factors from the original factor structure. According to Arnett (1989), the Sensitivity subscale reflects warmth, enthusiasm, and developmentally appropriate interactions while the detachment factor reflects uninvolvement, indifference, and lack of interest and engagement. Our result suggests that sensitivity and detachment represent the opposite ends of the same continuum rather than two distinct dimensions, consistent with an earlier finding of an unduly high negative correlation between the two (de Kruif et al., 2000). Also, consistent with previous research, our results demonstrated good internal consistency and satisfactory interrater reliability. In combination, these results suggest that this observational scale of caregiver–child interactions within early child care settings can be reliably and validly applied to afterschool settings that serve older children and youth.
While the CIS focuses on staff–child interactions, the PPRS measures broader aspects of afterschool program processes and practices, including staff–child relationships, peer relationships, level of engagement, and appropriate structure and supervision. Afterschool research has recently begun to adopt the PPRS (Mahoney et al., 2007; Vandell et al., 2007), but little is known about its psychometric properties. Our analyses revealed that the hypothesized five-factor model fit the modified version of the PPRS very well, and each subscale displayed good internal consistency. Like the CIS, the PPRS also showed satisfactory performance in terms of interrater reliability, which suggests that our observation system was successful in training the observers to use the scales in a similar manner.
Well-validated setting-level measurement tools can be used for both research and practice purposes. For research, they can be used to enhance our understanding of how afterschool programs work and how to make them work better. For practice, validated measurement tools can be used to provide program directors and staff information about areas of strengths and weaknesses in their practice and to give them practical guidance on what changes should be made to better serve their students. This will help hold afterschool programs accountable for ongoing assessment of their practice and continuous improvement (Granger, Durlak, Yohalem, & Reisner, 2007). Furthermore, we found that the factor structure differed little between programs serving primarily disadvantaged, urban, and minority populations and those serving mainly advantaged non-minority populations in suburban and rural settings. This result suggests that these instruments may have relatively broad applicability for afterschool settings.
The findings of this study confirm the potential promise of the instruments, on one hand, and reveal a critical new issue for improving measurement design, on the other hand. Observation data collection involves multiple sources of measurement error, and our research has revealed one that has received little attention in prior work in this area. Day-to-day fluctuations in the events observed were often bigger sources of variation in scores than were differences between observers and between items comprising the measures. Although strategies to reduce between-observer inconsistencies may be needed for CIS-P, this was not true for other measures. In general, an increase in the number of rounds of observation is of greater utility rather than an increase in the number of observers. Furthermore, additional rounds bring definite improvement to the reliability of virtually all of the subscales simultaneously assessed by each measure, where additional observers benefit a smaller portion of subscales. Thus, the results of the generalizability and decision analyses suggest that future assessment designs should place more weight on increasing the number of occasions that afterschool programs are observed, rather than the number of observers. Increasing the number of segments per round of observation may be an equally valid way of improving reliability. Indeed, the PPRS observational protocol recommends at least six segments of observation per visit (Vandell et al., 2004), while in our observation system three successive activities were observed for each round.
The current study has several limitations that should be addressed in future research concerning the measurement of afterschool program quality. First, although direct observation has obvious merits as a method for measuring setting-level quality, it is restricted to the observable aspects of quality, that is, overt behaviors and concrete events. Psychological and perceptual processes such as social norms, sense of belonging, emotional engagement are not readily captured using observational approaches. Rather, survey-based methods are more suitable for gathering such information. Thus, more complete assessment of settings should include both direct observation and survey methods (Raudenbush & Sampson, 1999). It would be desirable if observational measures were further validated using survey-based measures. Second, our study did not include three subscales of the PPRS, so additional research is needed to extend our work to those portions of this measure. Given that an ultimate goal of afterschool interventions is to improve youth outcomes through the enhancement of the quality of afterschool settings, our observational measures definitely need to be further validated by evidence of associations with a range of important youth and staff outcomes. Similarly, future research also needs to explore the extent to which the measures of afterschool program quality mediate the effects of interventions.
We believe that our research adds much-needed evidence on the measurement properties of observational instruments for afterschool settings, particularly given the importance of program quality for youth behavioral and academic outcomes. Our research addresses two widely known measures of dimensions of program quality prominent in research on program effectiveness, and our sample includes programs serving diverse populations in terms of race-ethnicity, urban to rural locales, and socio-economic status. Findings from generalizability analyses indicate future directions for improving observational measurement that help inform how to obtain more accurate and informative assessment of afterschool program quality.
Footnotes
Acknowledgements
We also gratefully acknowledge the involvement of Lisa White and the Pennsylvania State University Survey Research Center; the team of data collectors; the participating afterschool staff, students, and their parents; and Daniel Perkins, Jason Rose, Jill Schulte, Lindsay Unger, Sharon Childs, Linda Halgunseth, and Alba Blandino who assisted in the coordination and collection of these data.
Authors’ Note
Emilie P. Smith is now at Department of Human Development and Family Science, University of Georgia.
Declaration of Conflicting Interests
The author(s) declared no potential conflicts of interest with respect to the research, authorship, and/or publication of this article.
Funding
The author(s) disclosed receipt of the following financial support for the research, authorship, and/or publication of this article: The authors acknowledge funding support from the William T. Grant Foundation (Grant 8529), the Wallace Foundation (Grant 20080489), and the National Institute for Drug Abuse (Grant R01 DA025187).