
Abstract
This study combines the perspective of students (n = 137) and sales instructors (n = 248). It compares how well selling and sales management simulation games, case discussions, and traditional lectures are perceived to conform to the seven principles for good practice in undergraduate education. The study further compares each method’s performance on perceived learning outcomes. Differences between instructors who adopted a simulation game and nonadopters are investigated. Finally, we investigate the reasons why some instructors adopt and others choose not to adopt simulation games for their selling and sales management classes. We find that students consider simulation games more fun, but less useful than lectures, and about equally useful as case discussion. Computerized simulation games are less frequently used in sales education than in other business disciplines. The perceived lack of suitable games is the main reason why instructors do not adopt simulation games for sales education. Contrary to earlier speculation, prior professional work experience of the instructor is unrelated to simulation game adoption, and years of teaching experience is positively related to the use of simulation games.
Keywords
Simulation games are highly engaging learning tools that help introduce more experiential learning into the marketing curriculum (Gray, Peltier, & Schibrowsky, 2012). In sales education, selling simulations and sales management simulation (SMS) games have been studied from a pedagogical perspective for well over two decades (e.g., Bobot, 2010; Castleberry, 2014; Chapman & Sorge, 1999; Cook, 2004; Ullmann & Brink, 1992). However, in recent years, the number of published articles on marketing simulations has dropped substantially (Gray et al., 2012), and particularly research on selling and SMS games has been scarce (Cummins, Peltier, Erffmeyer, & Whalen, 2013). The limited available research suggests that the adoption of a simulation game into a sales or sales management course increases student involvement and helps better meet course objectives. At the same time, the last additions to the sales simulation offerings are nearly 10 years old, that is, the “Lakeside Ethics Simulation” described by Castleberry (2014) dates back to 2006. Likewise, the Sales Management Simulation game by Cook, Cook, and Cook’s (2003) “Shoot for MARS” is over 20 years old and saw its last major overhaul more than a decade ago, with a minor adjustment to decision weights in 2012.
With the novelty factor of selling and SMS games gone, the question remains: Who uses these educational tools and for what reasons? The present study sets out to investigate how student and instructor perceptions about simulation games compare, evaluate whether benefits of sales simulations found in prior research are still applicable today, and assess if and how the views of adopters and nonadopters of simulation games in sales and sales management differ.
The computerized sales simulation games available today can be categorized as simulations designed to practice selling skills, including customer service and sales negotiation skills (NexLearn, 2012), sales ethics simulations (Castleberry, 2014), in-basket exercises (Pearson, Barnes, & Onken, 2006), and sales management skills (Swift & Cook, 2004). The selling and negotiation skills simulations, as well as the sales ethics simulations are typically frame-based decision trees, where students are confronted with written scenarios or short video sequences and have to select decisions from a limited number of options. This differentiates these games from SMS games, where participants need to make multiple decisions simultaneously, often combined with a component of dynamic competition. The interactive nature of these SMS games suggests they are representatives of what Celsi and Wolfinbarger (2002) call “Wave 3” technology. In terms of this typology, Wave 1 and Wave 2 technologies are those that support and replicate traditional teaching tools, respectively. Wave 3 technologies, on the other hand, enhance the teaching experience in a way not possible with traditional teaching tools. The successful application of Wave 3 technology improves learning by making it more active and engaging.
Although prior research into reasons to adopt simulations games in business exists, some of this work has become obsolete or is not relevant in a sales education context. For example, the Lean, Moizer, Towler, and Abbey (2006) framework identifies the availability of resources, views of suitability, and risk attached to using a simulation game as key components to explain the adoption of simulation games in business education. However, this framework has never been tested with sales curricula. In addition, baseline data about the adoption rate of sales simulation games are mostly lacking. The 2004 version of the largest and longest running research project regarding the academic use of business simulation games in general (Faria, 1987, 1998; Faria & Wellington, 2004) with a sample frame of 14,497 included only 15 observations of instructors using (11) or having used (4) a sales simulation game (Faria & Wellington, 2004). Other limitations in the extant literature are the reliance on student-only samples (Bobot, 2010; Chapman & Sorge, 1999; Cook, 2004), the overrepresentation of SMS games and lack of attention to other sales simulation games, or the fact that the author of the simulation game is also the author of the assessment of that simulation game (Cook, 2004). This study addresses these limitations by investigating the adoption of an SMS game and a sales ethics simulation game and including both instructor and student perspectives. We focus on computerized sales simulation games, such as ethics simulations, selling skills simulation, and SMSs. This classification excludes the role-play games that are increasingly part of sales curricula (Forbes, Loe, Peterson, Erffmeyer, & Boehm, 2014; Newberry & Collins, 2012) or noncomputerized sales board games.
Benefits of Sales Simulation Games
Although the benefits of business simulation games in general have been extensively researched (Faria & Wellington, 2004; Wolfe, 1997), the same is not true for sales simulation games. Only a small number of studies has evaluated the benefits of SMS games for students (Cummins et al., 2013), and we know of just one study that focused on an ethics simulations in the classroom (Castleberry, 2014). An example of the assessment of SMS was by Chapman and Sorge (1999) who studied the classroom performance of the 1995 version which later became Dalrymple and Sujan’s (2004) “Sales Management Simulation.” Similarly, Cook (2004) and Devasagayam (2004) assessed how students evaluated the “Shoot for MARS” game (Cook et al., 2003). An overview of these studies is included in Table 1.
Overview of Previous Studies of Selling and Sales Management Simulation Games.
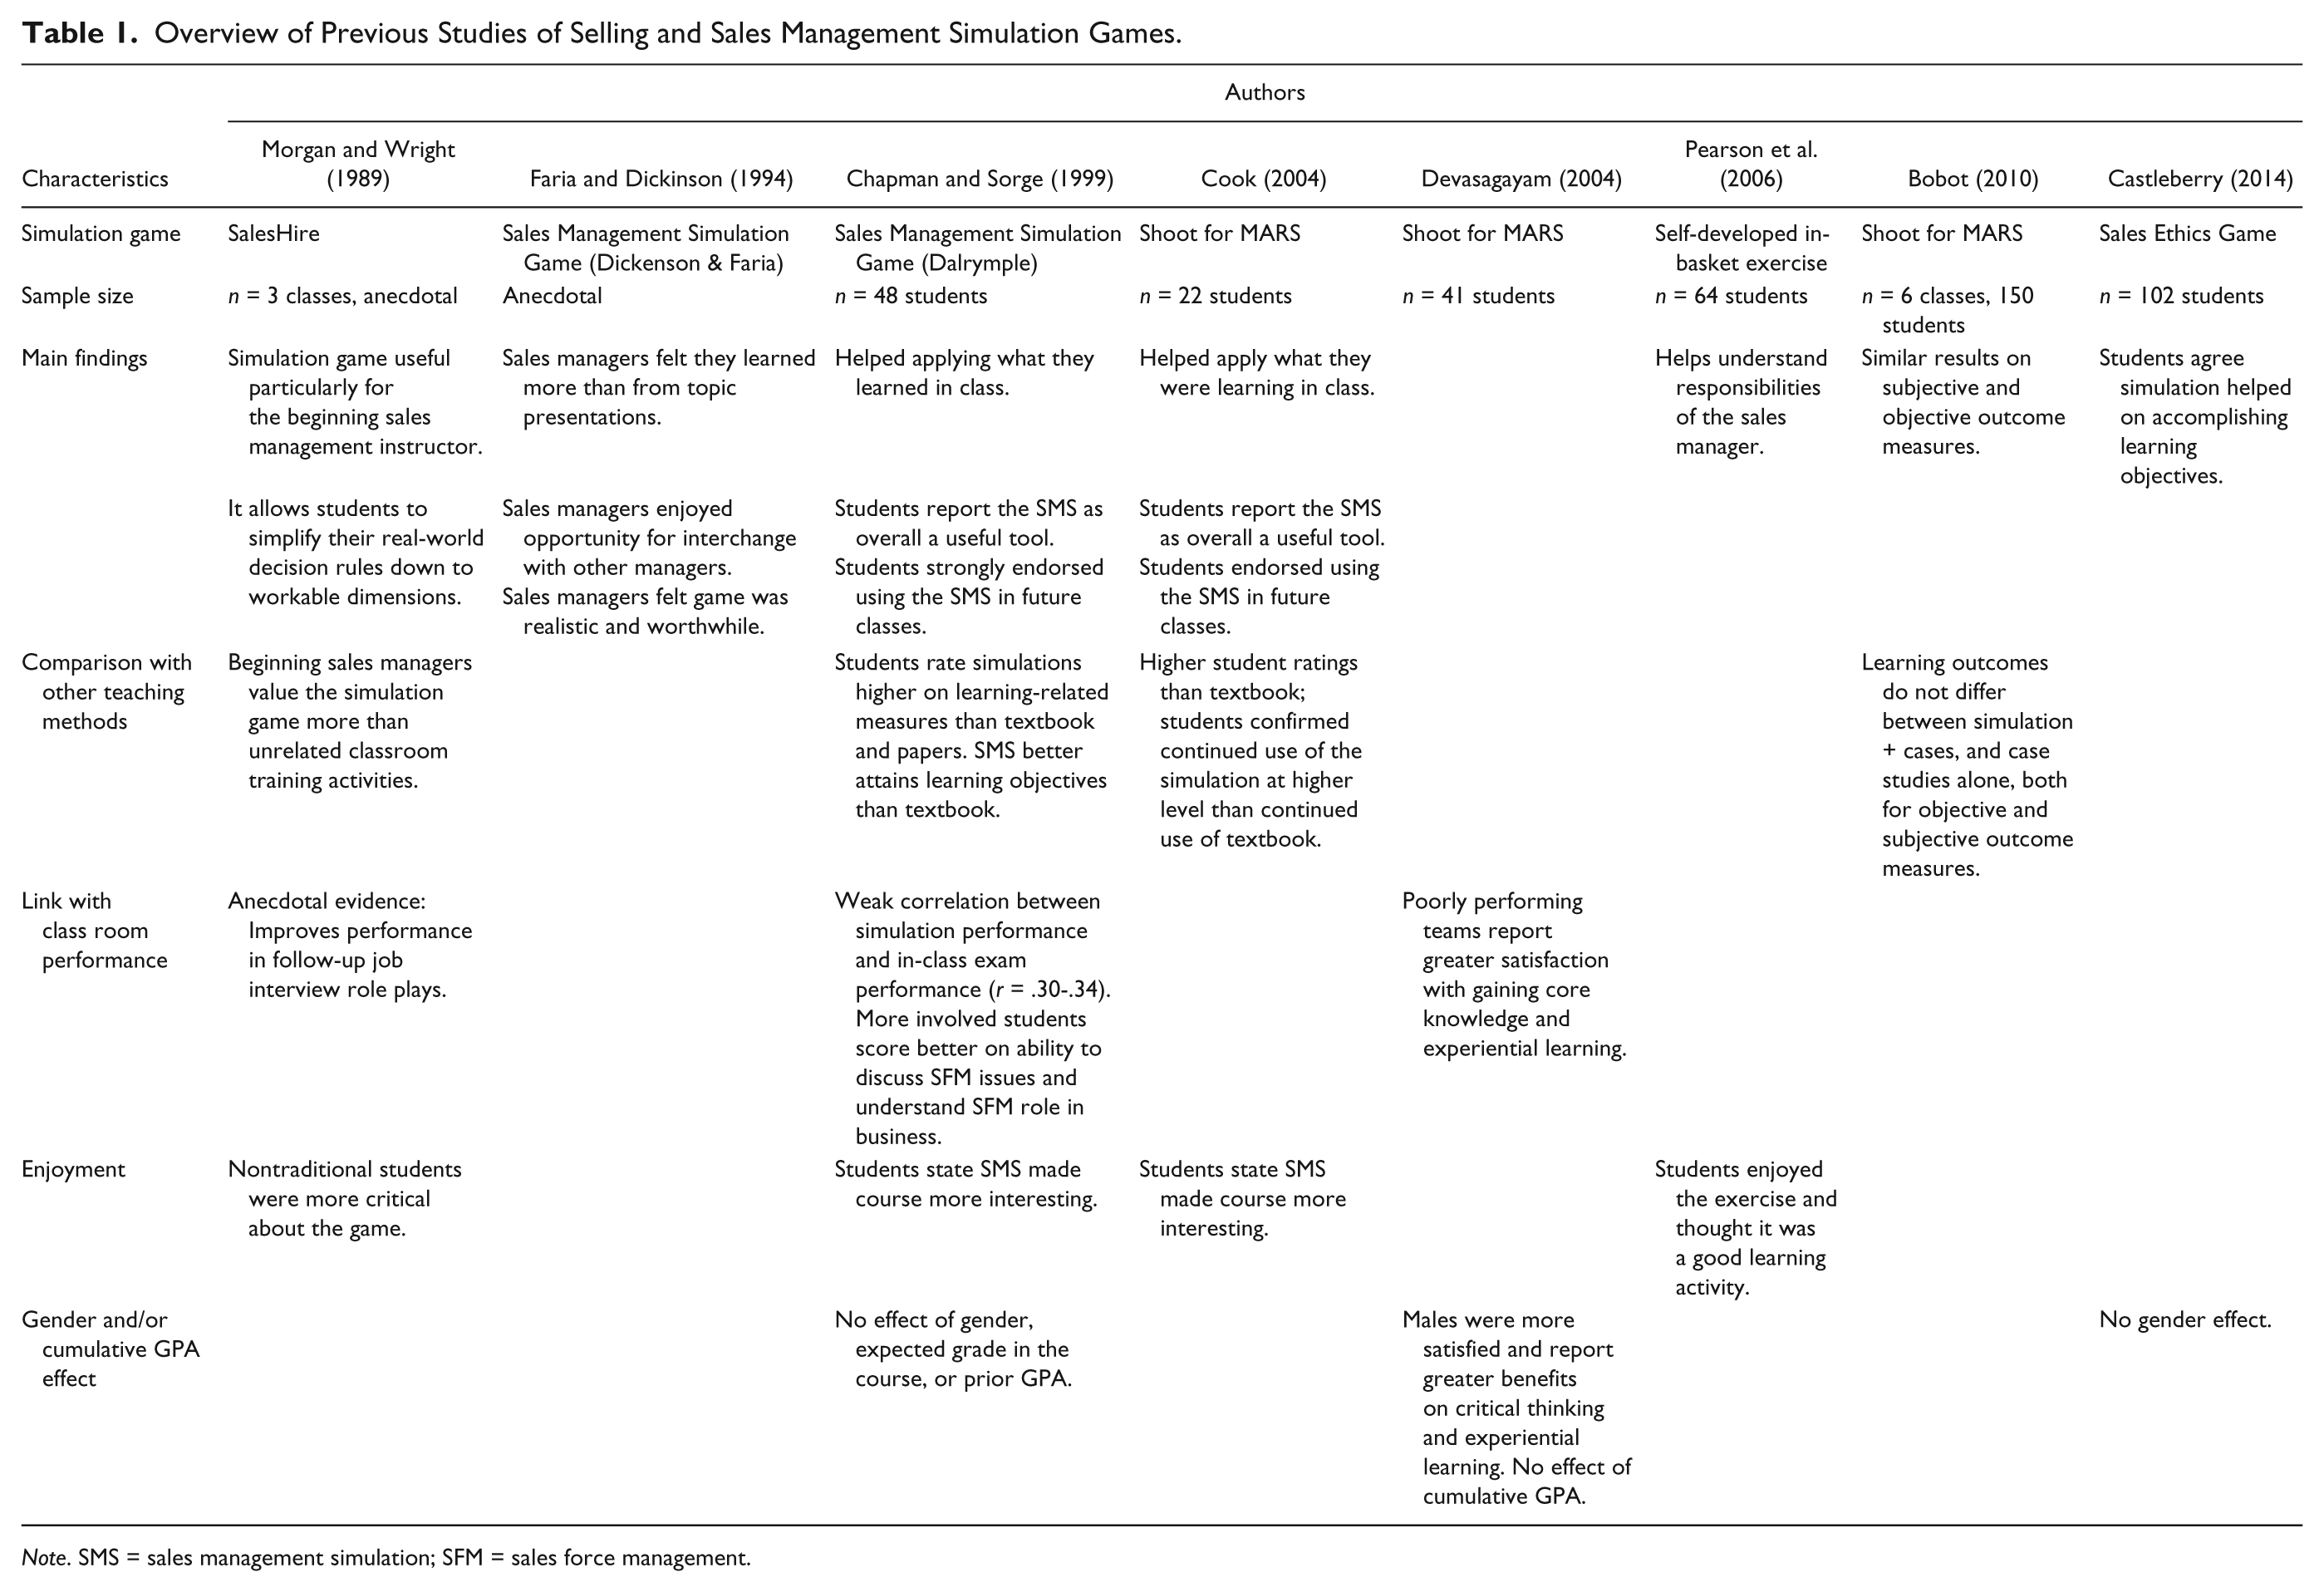
Note. SMS = sales management simulation; SFM = sales force management.
These works demonstrate that SMS games perform better at teaching higher level skills, such as problem solving, decision making and analytical thinking, as well as aiding in the development of teamwork skills. In addition, SMS games fill the gap in work experience that prevents most undergraduate students from fully understanding what sales managers actually do (Cook, 2004). Devasagayam (2004) finds that SMS games allow students to use the knowledge and skills obtained throughout their (academic) career not just from their sales management course. Moreover, SMS games can enhance the perceived value of the other teaching materials used in class (Swift & Cook, 2004). Bobot (2010) finds that SMS games are especially useful to let students experience the role and responsibilities of senior management, to emulate the uncertainties and surprises of a competitive environment, and to encourage student involvement. Yet Bobot finds no difference in objective nor self-reported learning outcomes between an exclusively case-based course design and a course design that replaces half of the case studies with a SMS game.
The Student Perspective
Despite the critical note of Bobot (2010), as well as reports of incidental negative student reactions, and some level of student opposition to learning through simulation games (Ellington, 2004; Kane, 2004; Sutcliffe, 2002), sales and sales management students appear to “like” simulation games (Cook, 2004). Student involvement particularly increases from using sales simulation games compared with textbooks and lectures (Bobot, 2010; Chapman & Sorge, 1999). Sales management students prefer a simulation game over the use of textbooks (Cook, 2004), and even first-time sales managers rated the value of a SMS game, in this case “SalesHire,” to be considerably higher than other classroom training activities (Morgan & Wright, 1989). These findings are mirrored by undergraduate students who rank simulation games higher than all other teaching methods in meeting general course-learning objectives (Chapman & Sorge, 1999; Cook, 2004; Devasagayam, 2004). When specifically comparing case discussions with simulation games, Widmier, Loe, and Selden (2007) and Ullmann and Brink (1992) find that involvement of students is higher with simulation games than with case discussions. To fully understand the student perspective, we break the student preference down in perceived usefulness of the teaching method and enjoyment of the teaching method (cf. Wolfe, 1985). We hypothesize the following:
The Instructor Perspective
In addition to the student perspective, we investigate the views of instructors regarding the benefits of sales and SMSs. For general business education, instructors can rely on a rich literature regarding the comparison of simulation games relative to, or in combination with, other teaching methods (e.g., Sauaia, 2006; Wolfe & Guth, 1975). However, prior studies specific to selling and sales management are scarce or include only a few representatives of sales instructors as part of a much larger business instructor audience (Faria & Wellington, 2004).
Previously reported benefits of general business simulations are that they are interactive and dynamic exercises and that simulations allow for theory application (Faria & Wellington, 2004). Other benefits that sales instructors mention are the immediate quantitative feedback, consistency of feedback, and that simulations engage students to discuss the material in the classroom (Pearson et al., 2006). To dig deeper into the underlying reasons why instructors prefer one teaching method over the other, we explore how sales and SMS games perform on Chickering and Gamson’s (1987, 1999) seven principles for good practice in undergraduate education. As these principles have frequently been summarized and reviewed, we suffice by listing them: encouraging contact between students and faculty, encouraging cooperation among students, communicating high expectations, respecting diverse talents and different ways of learning, encouraging active learning, providing prompt feedback, and allowing students to manage the time they spend on learning. McCabe and Meuter (2011) provide an excellent review of how these seven principles relate to the use of technology in the classroom. The perceived effectiveness of each teaching method plays an important role in their classroom use. Faria (1998) finds that adopters of simulation games rank these tools as the most effective teaching tools, whereas nonadopters consider them less effective than cases, lectures, and textbooks. In this study, we define adopters as any instructor who has used, or is still using a selling or SMS game. We hypothesize in terms of learning outcomes and the effectiveness in accomplishing the seven principles that
Barriers to Adopt Sales Simulations
To better understand the value that selling and SMS games provide in the classroom, we investigate potential barriers that need to be overcome before an instructor adopts these simulations. Lean et al. (2006) developed and tested a framework that identifies the three most common adoption barriers for business simulation games. These barriers are Perceived Risk of adopting new teaching methods, Suitability of the available simulations, and lack of Teaching Resources. These three barriers are interconnected (Moizer, Lean, Towler, & Abbey, 2009) and should therefore be examined simultaneously. In line with Lean et al. (2006), we argue that individual instructors’ risk perceptions differ and play a substantial role in explaining which instructors are willing to adopt a new teaching tool and which instructors are not. The risk perception is especially relevant as simulation games, more so than any other teaching tool, operate to an extent as a black box, obscuring most of their internal logic and mechanisms that calculate the outcomes students will encounter. From an instructor’s perspective, this results in a loss of control over student learning (Zülch & Fischer, 2003). Finally, the perceived risk of technical problems with the simulation may play a role in the instructor’s decision to not adopt a sales simulation (Davies, 2002; Sutcliffe, 2002). We therefore hypothesize that those instructors who perceive the highest amount of risk associated with adopting a simulation game will be the least likely to be adopters.
The current generations of sales educators are all trained in an era in which simulation games are readily available. In fact, it has been over six decades since the very first SMS game was developed by ARS Corporation in 1959, the “Amston Business Game” (Faria & Dickinson, 1994). That game already allowed participants to manipulate the salesperson’s time allocation, call rate per segment, and allowed for hiring and firing decisions. For a long time, SMS games were on the forefront of the revolution in business simulation games that started in 1955 with the logistics game “MONOPOLOGS” (Faria & Wellington, 2004). Yet given the fact that there have not been any new or substantially updated products on the market for well over a decade, it is quite possible that some instructors believe there are no suitable alternatives available. Especially those instructors most in touch with the changing nature of the sales process, from individual sales calls to more process-based longer cycle sales opportunities (Plouffe, Holmes-Nelson, & Beuk, 2013), may in fact believe that the current simulation products available have become obsolete and insufficiently reflect the realities of today’s changed sales processes (Rolfe, 1991). We therefore hypothesize that:
Finally, teaching innovations and risk taking go hand in hand with the teaching resources an instructor has available (Lean et al., 2006; Moizer et al., 2009). Particularly in the early days of selling and SMS games, adopting a game required a substantial investment in classroom logistics, collecting decision disks, teaching students the necessary computer skills to play these games, and distributing the game’s output back to students. Although this variable has played a substantial role in the past and in other business disciplines (Sutcliffe, 2002), the current generation of selling and SMS products available has made great progress in automating these support functions, often completely eliminating the need for instructor involvement with the input and output processes, while already facilitating the student performance assessment phase (Cook, 2004). We therefore expect that present-day sales instructors are not as sensitive to this variable as other business discipline instructors, but in order to stay consistent with Lean et al.’s (2006) framework, we hypothesize that:
In addition to these three perceptual variables, we investigate the impact of experience on the adoption of sales simulation games. This variable is especially interesting, as relatively inexperienced instructors may be more open to teaching innovations and the use of teaching technology than more experienced instructors (Pierson, 2001). Morgan and Wright (1989) suggest that beginning sales management instructors, particularly those with limited relevant work experience, benefit the most from using simulation games. This aligns with Faria’s (1998) observation that instructors who use general business simulation games tend to be younger and have fewer years of teaching experience. Faria and Wellington (2004) find that former users of general business simulation games tend to be more experienced instructors who, on average, ceased using simulation games after approximately 5 years. Less experienced instructors benefit the most from simulation games because it allows them to illustrate theory by referencing the simulation game (Morgan & Wright, 1989) in lieu of examples based on their own teaching or professional experience. We therefore hypothesize that:
Method
Student and Instructor Samples
The student sample comprised six classes of traditional undergraduate “sales management” students and one class of “professional selling” students all at a member school of the University Sales Center Alliance. After the simulation game concluded, all registered students were approached to provide feedback in exchange for extra credit on the course’s final exam. The majority, 137 out of 154 (89%), participated. Following Ullmann and Brink’s (1992) recommendation, 15% course credit was assigned to the simulation itself, with grades being distributed based on the students’ ranking in the simulation. The grading weight is in line with the findings of Castleberry (2014) who reports that a 10% weight is enough to ensure that students take the task seriously and Chapman and Sorge (1996) who assigned a 20% weight to the performance of students in the SMS they investigated.
For the instructor sample, we used a sample frame of 643 higher education sales educators. These educators were primarily based in North America. We used four main sources to compile our sample frame. First, we identified educators who participated in sales-specific conferences or were members of so-called sales special interest groups at leading marketing conferences. Second, we identified educators who participated in collegiate sales competitions. Third, we identified recently published authors of academic sales research, and finally, we searched for sales faculty on the websites of universities with a sales program or sales concentration. By using a range of sources, we captured a wider range of responses including educators with different foci on research and teaching. In total, 248 instructor surveys were completed in April 2014, giving a response rate of 38.6%, which is considerably higher than similar surveys regarding the use of simulation games among academics.
Sample Descriptions
Our student sample consists of 54% females. The average GPA was 3.08 (SD = .42). Thirty-six percent of the students had played a simulation game in a nonsales class before. Two different simulations were used: 104 students of sales management participated in the “Shoot for MARS” simulation that was run for 10 rounds over a 12-week period. Students reported spending on average 65 minutes (SD = 64 minutes) for the first three rounds and 36 minutes (SD = 42 minutes) for the last three rounds. The “Lakeside Ethics Simulation Game” consisted of over 48 multiple choice scenarios, which 33 students of an introduction to professional selling course completed outside the classroom. Students were timed during the simulation and spent 102 minutes on average (SD = 47 minutes) working on their decisions.
For the instructor sample, respondents had, on average, 14 years of sales teaching experience (SD = 9.9 years). The instructor sample consisted of 27% females. Fifty-eight percent of the respondents primarily taught a selling skills class, 22% of the respondents primarily taught sales management classes, and 4% primarily taught a negotiations skills class. Fourteen percent of the respondents had not taught a sales class in the past 5 years. Faria (1998) reports that 28% of professors among all business disciplines use a simulation game. Our current sample shows that among sales educators, this percentage is substantially lower. Only 42 (16.9%) were current or previous adopters of selling or SMS games, and 206 (83.1%) had never adopted a sales or SMS game. One third of the adopters had most recently used “Shoot for MARS” (Cook et al., 2003), and 17% had most recently used Dalrymple’s Sales Management Simulation (Dalrymple & Sujan, 2004). Managing Customers and Segments (Harvard Business School Press) was mentioned by 7% of the respondents. Other simulation games used in sales or sales management classes were KAM2WIN, EchoPort, Links, Mercuri Business Game, The Race and Time Trial, SimSales, BTS Winning Major Sales, and the Manager’s Workshop. The final 14% of respondents did not report the name of the sales simulation they had most recently used.
Measures
To measure the student reaction, we collected two items regarding the perceived usefulness, and the level of fun associated with each teaching method. Justification for the “fun” item can be found in Pearson et al. (2006) who recognize that although the degree to which a teaching method is enjoyable is not part of Bloom’s (1956) original taxonomy of educational objectives, it is preferable to have an enjoyable activity over a nonenjoyable activity.
For instructors, we used a six-item scale from McCabe and Meuter (2011) to assess how sales instructors perceived learning outcomes for different teaching methods. Next, we used single-item descriptors to capture how well each teaching method performed on the seven principles for good practice in education (Chickering & Gamson, 1987; McCabe & Meuter, 2011). Finally, we used 9 of the original 10 items from Lean et al. (2006) to investigate the impact of Suitability, Resources, and Risk as barriers that sales instructors perceive when considering whether or not to adopt simulation games. One of the items from Lean et al. (2006) loaded on a second factor in addition to the factor for which it was designed, and hence we excluded this item (see the appendix). This process is not uncommon when using measures that were designed and tested for a population different than the population being studied (Hinkin, 1995). The number of years of teaching experience was self-reported by each instructor, and the number of years of work experience was collected from instructors’ LinkedIn pages or publicly available curricula vitae.
Analysis
To test Hypothesis 1, we used a repeated-measures one-way analysis of variance (ANOVA) to compare the three teaching methods. To test Hypothesis 2, we used repeated-measures and regular one-way ANOVAs to analyze the scores given to the three teaching methods on McCabe and Meuter (2011) six-item learning outcome scale, as well as to compare each instruction method on the seven principles for good practice in undergraduate education. Differences were analyzed separately for adopters and nonadopters of simulation games. Finally, to test all of the subhypotheses for Hypothesis 3 simultaneously, we ran a logistic regression model to investigate factors that predict adoption of simulation games in selling and sales management courses. Logistic models fit the data better when the dependent variable is binary such as adoption and nonadoption of a simulation game. Independent variables added were the instructor’s risk perception of adopting new teaching methods (Risk), the instructor’s perception of how suitable available simulations were for their course (Suitability), and the perceived amount of teaching resources available to them at their institution (Resources). We also included the nonacademic work experience of instructors (Experiencework) and self-reported years of experience teaching sales (Experienceteaching). Control variables were added for instructors who primarily taught to professional students, as these students are known to be more critical toward, and benefit less from, the use of simulation software (Hite, Bellizzi, & Busch, 1987; Morgan & Wright, 1989), as well as a dummy variable to control for instructors who most frequently taught sales management classes.
Results
Student Perspective
Our results indicate that students do not perceive simulation games as the most useful teaching method, rejecting Hypothesis 1a. For students exposed to the Shoot for MARS game, a repeated-measures one-way ANOVA of student evaluations of the different teaching methods was marginally significant, F(2, 58) = 2.68, p < .08, η2 = .15. Post hoc tests using the Bonferroni correction revealed that contrary to our expectation and extant literature, students rated lectures as a more useful teaching tool than the sales simulation (ΔM = .57, p < .03, d = .45). Lectures were even rated higher than case studies (ΔM = .50, p = .10, d = .39). There was no significant difference between case discussion and the simulation game (ΔM = .07, p = .79; see Table 2).
Student Ratings of Most Useful Teaching Method.
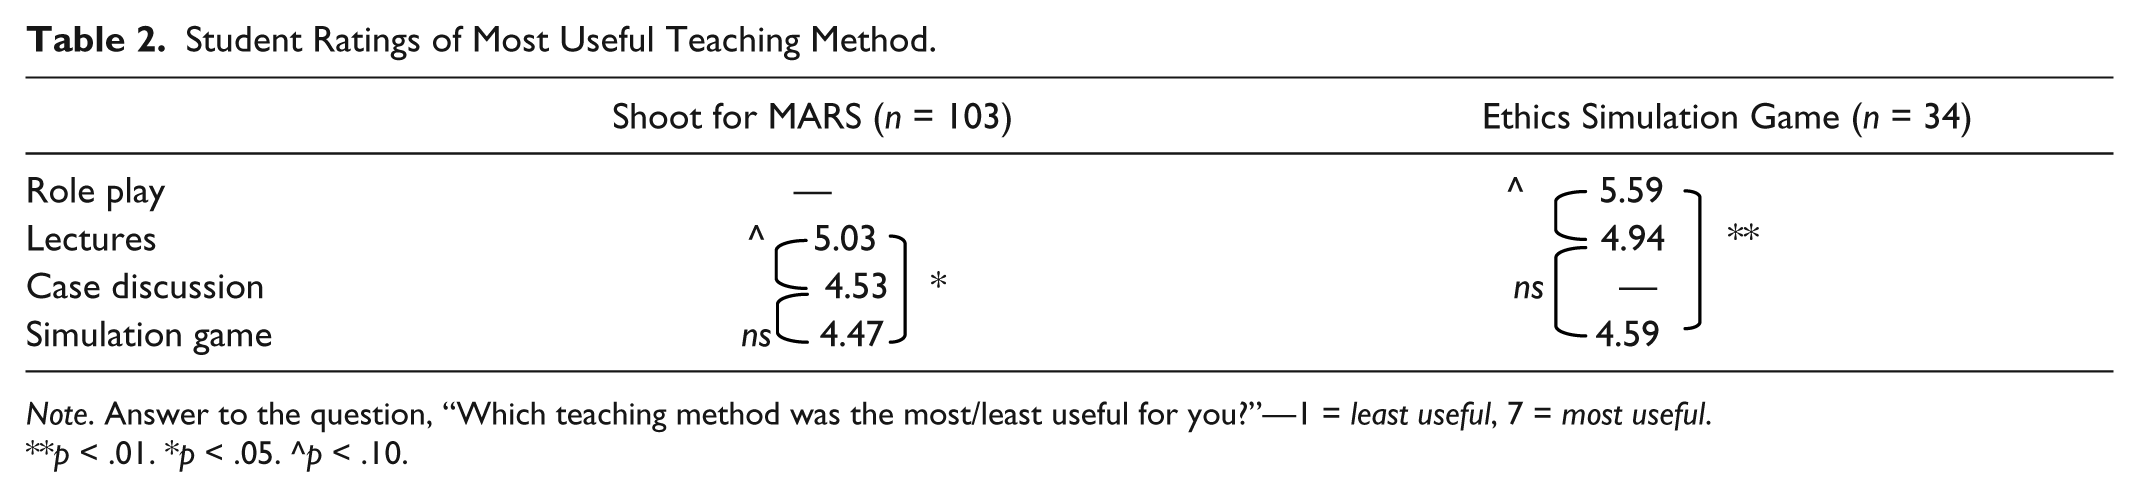
Note. Answer to the question, “Which teaching method was the most/least useful for you?”—1 = least useful, 7 = most useful.
p < .01. *p < .05. ^p < .10.
For students exposed to the ethics simulation game, the repeated-measures one-way ANOVA was significant, F(2, 66) = 4.98, p = .01, η2 = .13. These students did not engage in case discussions, but instead performed an in-class role play exercise. Students found this exercise more useful than the lectures (ΔM = .67, p = .09, d = .52), as well as the simulation game (ΔM = 1.00, p < .01, d = .78). The difference between usefulness rating of lectures and the simulation game was not significant (ΔM = .35, p = .22). In sum, we find no support for Hypothesis 1a.
We find partial support for Hypothesis 1b, that students consider simulation games the most fun teaching method compared with case discussions and lectures. The strongest support comes from the Shoot for MARS group. The repeated-measures one-way ANOVA for the most “fun” teaching method yielded significant results for this group, F(2, 56) = 5.70, p < .01, η2 = .17, and marginally significant results for the ethics simulation game group, F(2, 66) = 5.70, p < .09, η2 = .07.
The Shoot for MARS simulation group rated this game as more “fun” than lectures (ΔM = .55, p = .05, d = .41) and substantially more fun than case discussions (ΔM = 1.00, p < .01, d = 1.08). There was no significant difference between lectures and cases (ΔM = .45, p = .11). Students exposed to the ethics simulation game rated the role play as more “fun” than lectures (ΔM = .85, p = .03, d = .60), but perceived no significant difference between role plays and the simulation game (ΔM = .47, p = .21) nor between lectures and the simulation game (ΔM = .38, p = .32; see Table 3).
Student Ratings of Most Fun Teaching Method.

Note. Answer to the question, “Which teaching method was the most/least ‘fun’ for you?”—1 = least fun, 7 = most fun.
p < .01. *p < .05. ^p < .10.
There was no gender effect in the preference for simulation games or their perceived usefulness. Additional analyses revealed a small but statistically significant effect indicating that students who scored relatively well in the simulation found the simulation more fun and rated it as more useful.
Finally, we surveyed students about the sales topics they had learned most about from the simulation game they used during the semester. The list of topics was selected based on two popular sales management textbooks, but included topics suited for professional selling classes as well, such as ethics and training. According to our student sample, strongest points of the Shoot for MARS SMS game are the ability to learn about forecasting, compensation, and sales force motivation. Students rate the game’s ability to teach account management, sales analytics, performance evaluations, and training substantially lower. Not surprisingly, as the game does not explicitly address these topics, students score the game poorly on its ability to teach territory management, ethics, and hiring and firing decisions. Students exposed to the ethics simulation game ranked “ethics” as the single topic they learned the most about, and all other topics were ranked substantially lower. In short, the Shoot for MARS game scores good to adequate on six of the nine topics, whereas the ethics game scores best on one single topic. Although we did not perform the same follow-up for the other methods of instruction, both the case studies and the lectures used in class were designed to explicitly cover all nine topics, and it is possible that students reflected this broader range in topics in their rating of the usefulness of the simulation game.
Instructor Perspective
A one-way ANOVA was used to conclude there are no significant differences in the overall outcome measures within the group of simulation adopters based on the primary course they teach, that is, a selling, negotiations, or sales management course, F(2, 40) = .12 to 2.38, p = .11 to .89. We therefore group all the adopters, regardless of their primary course, together for further analysis.
We find only partial support for Hypothesis 2a, that is, when considering McCabe and Meuter’s (2011) outcome measures, nonadopters rate case discussions higher than both simulation games and lectures, ΔMsim = .42, p < .01, d = .53. The pattern holds for all subitems, except the ability to stay interested in the topic, and the ability to enhance the experience outside the classroom (see Table 4). Compared with lectures, nonadopters perceive simulation games as superior in keeping students interested, M = 3.38 versus 2.82, p < .01, d = .64, and in enhancing the experience outside the classroom, M = 3.04 versus 2.43, p < .01, d = .64. However, taken over all six outcome measures together, nonadopters do not consider simulation games to perform better or worse than lectures, which leads us to ultimately reject Hypothesis 2a.
Instructor Ratings of Learning Outcomes for Lectures, Simulation Games, and Case Discussions.

Note. Scores reflect the answer to the question, “How well does [teaching method] help students. . . . ” The scale ranged from 1 (poor) to 5 (excellent). Repeated-measures ANOVA with a Greenhouse–Geisser correction determined that on each learning outcome dimension, there were significant differences between the three teaching methods. Post hoc tests results using the Bonferroni correction are reported for the difference between the simulation game and the other two teaching methods.
p < .01. *p < .05. ^p < .10.
For adopters of simulation games, the results are different. Contrary to Hypothesis 2b, adopters perceive no significant difference between the learning outcomes of simulation games and case discussions. However, similar to the nonadopters, they perceive the simulation game as superior on some learning outcomes compared with lectures, most notably on its ability to stay interested in the topic, M = 3.51 versus 2.56, p < .01, d = .99, and to enhance the experience outside the class room, M = 3.34 versus 2.42, p < .01, d = .98. On average, adopters rate simulation games marginally higher than lectures, M = 2.72 versus 3.18, p < .10, d = .57, but they do not perceive a significant difference between simulation games and case discussions. In sum, all instructors rate case discussions superior to lectures. However, adopters rate both case discussions and simulation games over lectures, and nonadopters rate case discussions over both lectures and simulations.
To further investigate how simulation games compare with lectures and case studies, we compare the perceived performance of each method on the seven principles of good practice in undergraduate education. Scores over 4, the midpoint, suggest that simulations perform better than the alternative method. Compared with lectures, simulation games score, M = 4.63 and 4.24 for adopters and nonadopters, respectively, F(1, 42) = 14.91, p < .01, d = .52, and F(1, 132) = 34.68, p < .01, d = .24. Compared with case studies, adopters and nonadopters perceive no significant difference with simulation games, F(1, 41) = 2.13, p = .15, and F(1, 122) = 1.97, p = .16, that is, neither adopters nor nonadopters differ significantly from the midpoint. However, the two groups do significantly differ from each other, M = 4.25 versus 3.86, p = .05, d = .35 (Figure 1). The scores for each of the seven principles are summarized in Table 5. All instructors believe that simulation games perform better than lectures when it comes to providing prompt feedback, encouraging active learning, and encouraging cooperation among students. Adopters of simulations also believe that simulation games perform somewhat better at respecting diverse talents and different ways of learning, M = 4.44, p < .10, d = .26. Interestingly, nonadopters believe that simulation games perform worse than lectures at encouraging student–faculty contact, M = 3.51, p < .01, d = .31. Nonadopters also rate lectures as better in communicating high expectations, M = 3.38, p < .01, d = .44. Compared with case discussions, adopters see simulations as superior on encouraging active learning, M = 4.62, p = .02, d = .39, and cooperation among students, M = 4.60, p < .01, d = .43. However, as mentioned before, on average, adopters perceive no difference on the seven principles with case discussions, M = 4.25, p = .15. Nonadopters see simulation games as inferior to encouraging student–faculty contact, M = 3.37, p < .01, d = .42, and communicating high expectations, M = 3.49, p < .01, d = .35. However, when looking at the average of all seven principles, nonadopters do not perceive a significant difference between simulations and case discussion, M = 3.86, p = .16.
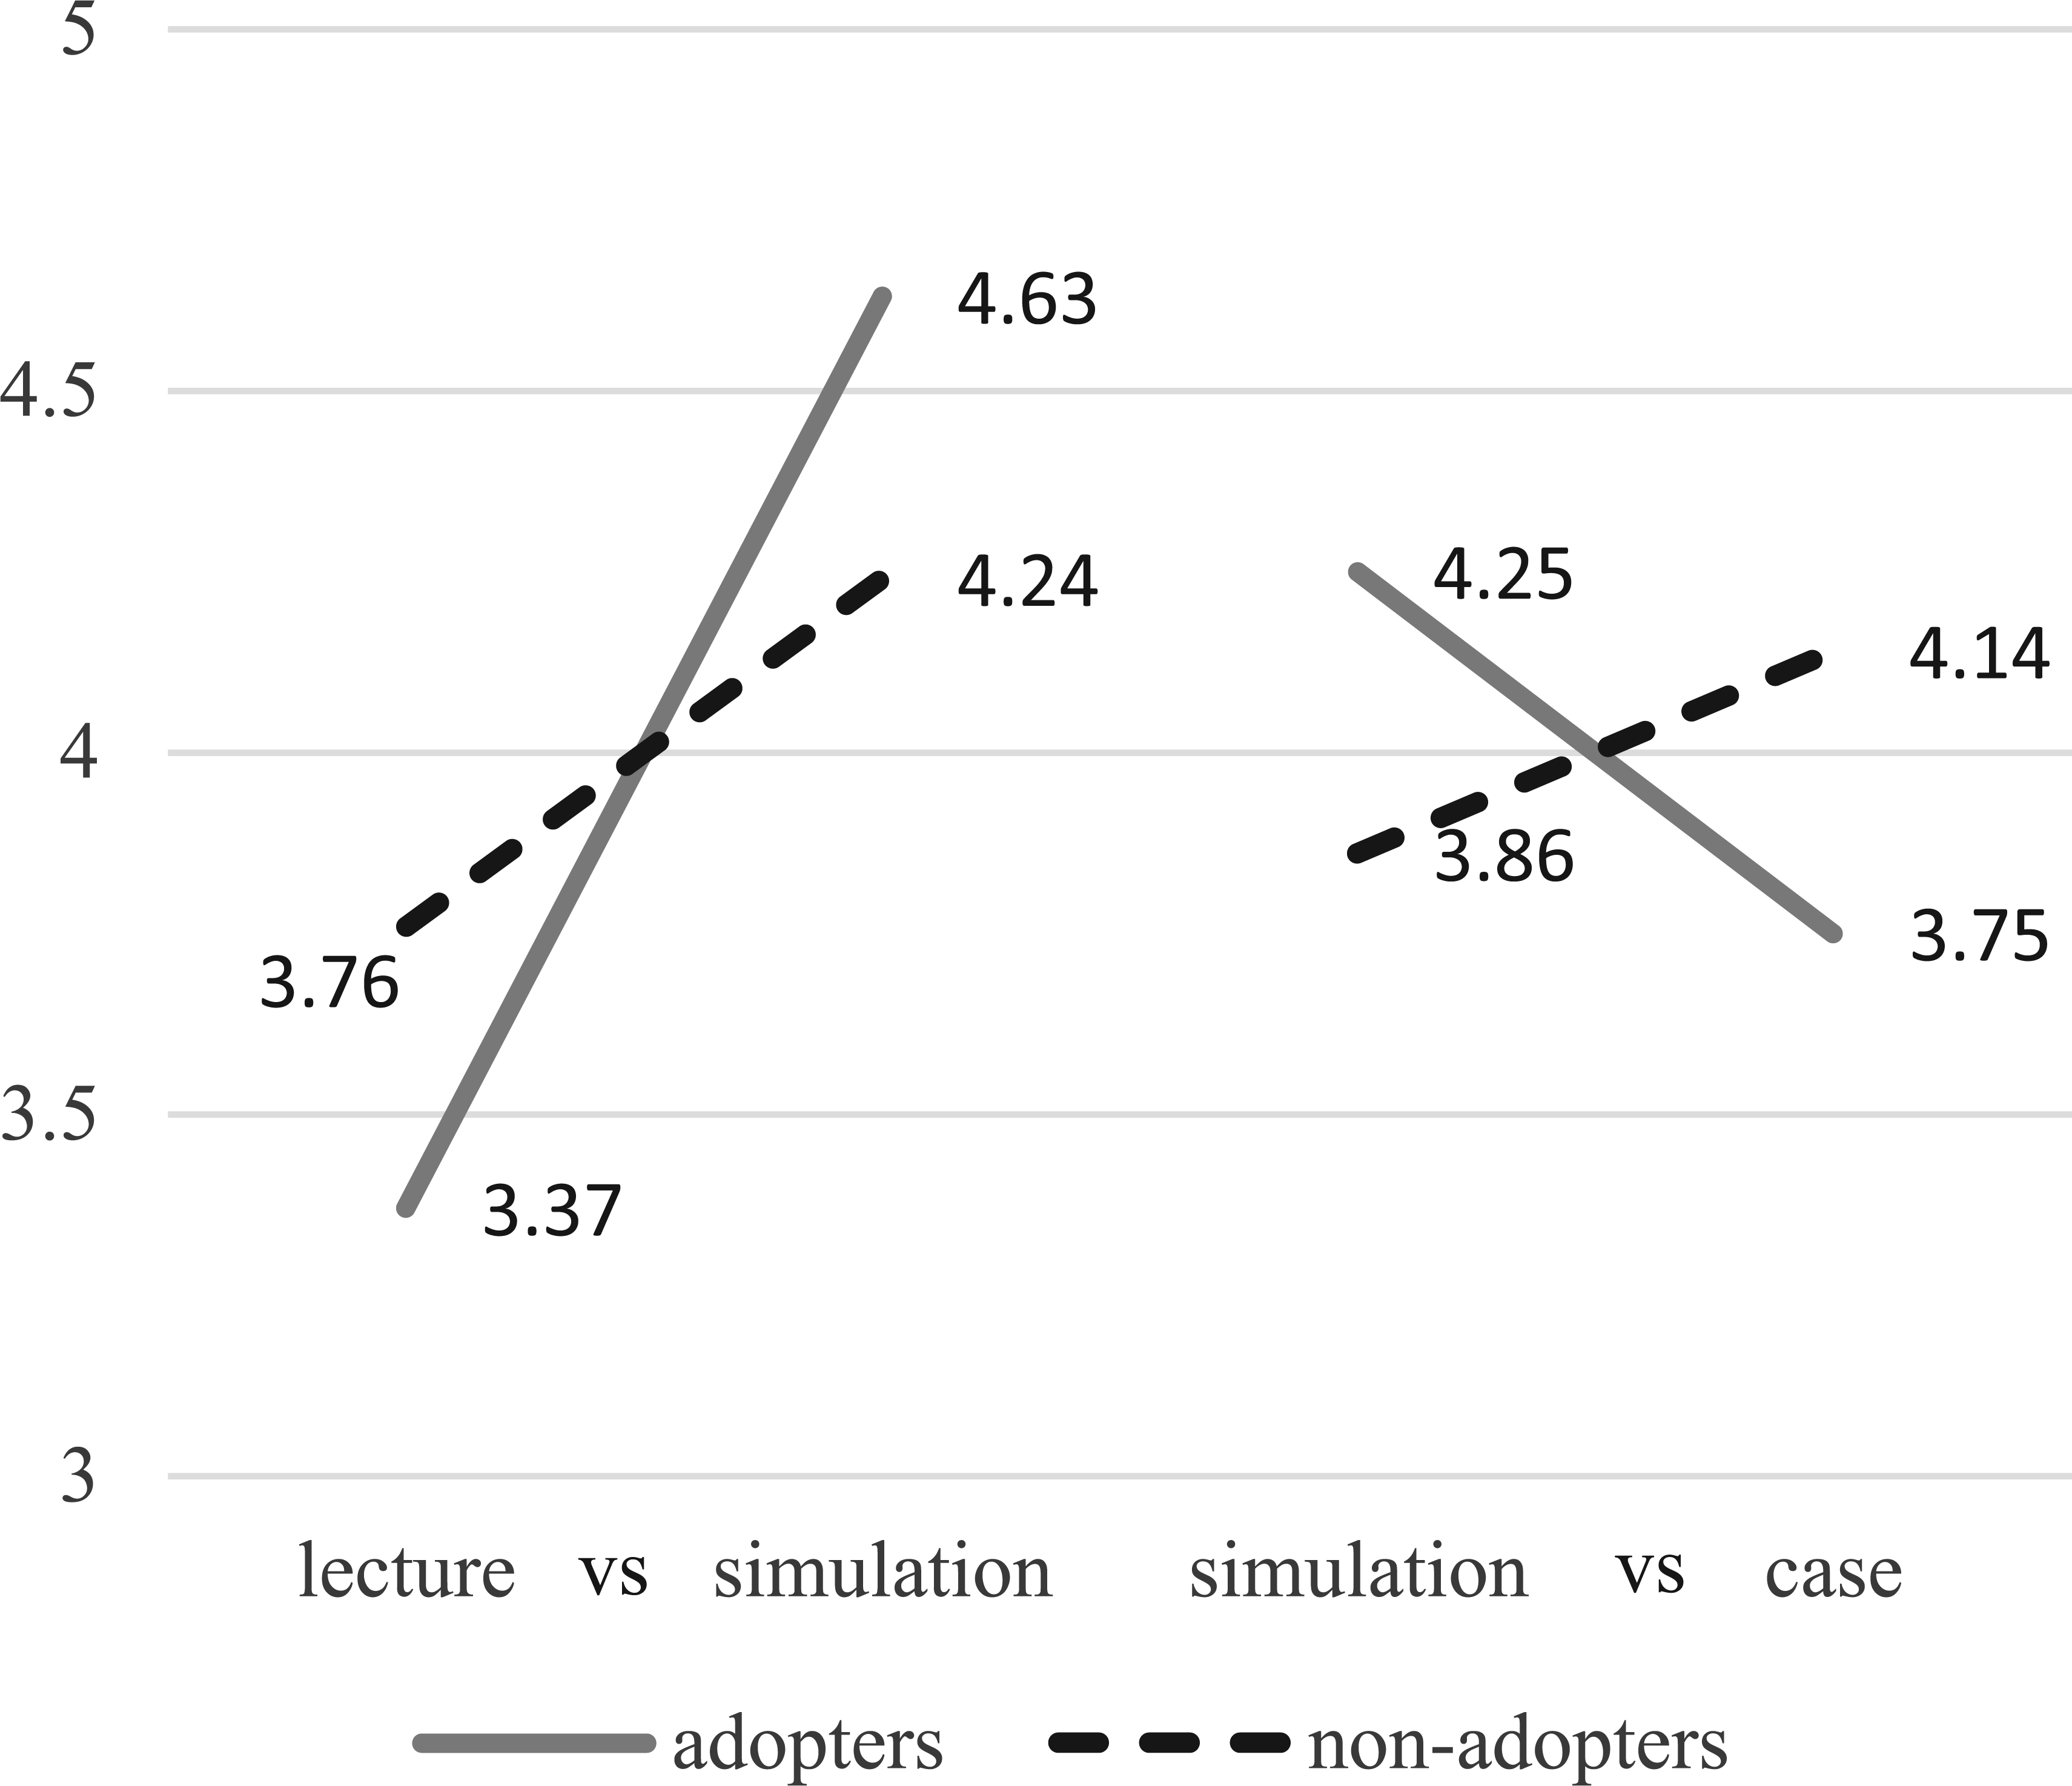
Difference in average score between adopters and nonadopters of simulation games.
Instructor Ratings of Seven Principles for Good Practice in Education for Lectures and Case Discussions Versus Simulation Games.

Note. Scores reflect the answer to the question, “Please compare how you think sales simulation games versus [lectures/case-study discussions] perform relative to each other for the sales class you teach most.” Responses are measured on a 7-point scale, where the midpoint (“4”) indicates that both teaching methods perform equally well on that principle. For example, the average score of 4.63 for adopters means that lectures and simulations are .63 × 2 = 1.26 scale points apart. The presented p values between adopters and nonadopters reflect the results of one-way analyses of variance and indicate whether the two groups significantly differ from each other. The symbols directly after each rating represent whether this number is significantly different from the midpoint, with **p < .01, *p < .05, ^p < .10.
As neither group sees simulation games as clearly superior or inferior to all other teaching methods, we reject both Hypothesis 2a and Hypothesis 2b.
We also asked instructors what percentage of total class time they would ideally spend on each instruction method, assuming the ideal teaching tools were available. All instructors like to spend approximately half of their class time on traditional lectures, either in person (M = 41.7, SD = 19.4) or online (M = 7.5, SD = 9.5). Unsurprisingly, 42% of the nonadopters prefer to spend no time on a simulation game in class at all. However, the remaining 58% of the nonadopters are open to the idea of spending class time on simulation games if the ideal game were available (M = 18.2, SD = 10; see Table 6).
Ideal Percentage of Class Time Spent on Different Teaching Methods.

The final part of our analysis concerns factors that can predict which instructors do and which instructors do not adopt sales and SMS games. First, we directly asked which of the reasons to adopt a simulation game identified by Faria and Wellington (2004) applied to the simulation adopters in our sample. The most frequently selected reasons were to offer students decision-making experience (88%), because simulations are interactive exercises (69%), to stimulate student involvement (69%), to add variety to the classroom (57%), to motivate students (55%), to have students integrate business concepts (55%), apply theory (55%), and to encourage teamwork (48%). Simulation games were also adopted because they are “fun” for students (48%), because a mentor recommended it (12%), or because it reduces the instructor’s teaching workload (5%).
In addition to these descriptive results, we formally tested Hypothesis 3 by means of a logistic regression to investigate the applicability of Lean et al. (2006) barriers to adoption for sales or SMS games. The dependent variable was whether instructors had ever adopted a computerized selling or SMS game. For the basic Lean et al. model, we added only Suitability, Resources, and Risk as predictors. A test of the full model compared with a model with only a constant was statistically significant, χ2 = 26.2, degrees of freedom (df) = 3, p < .00, indicating that the Lean et al. model reliably distinguished between adopters and nonadopters. However, the model has a Nagelkerke R2 of 21%, indicating only a weak relationship between predictors and adoption of a simulation game. The model predicts 97% of the nonadopters, but only 33% of the adopters correctly, for an overall 82% correct predictions. The Wald criterion demonstrated that only Suitability made a significant contribution to prediction, Wald = 20.92, p < .01. To test Hypothesis 3d, we expanded the model to include both teaching and work experience. This model also reliably distinguishes between adopters and nonadopters, χ2 = 36.4, df = 5, p < .00, and it significantly improves the base model, Δχ2 = 10.2, df = 2, p < .01. Nagelkerke’s R2 for this model is 29%, indicating a weak to moderate relationship between the predictors and adoption of a simulation game. The expanded model classifies 96% of the nonadopters and 45% of the adopters correctly. Based on the Wald criterion, Suitability is still a strong predictor, Wald = 22.9, p < .00, with respondents and so are years of teaching experience, Wald = 9.3, p < .01. After standardizing the independent variables, an analysis of the odds ratios reveals that a standardized unit reduction in Suitability perception decreases the likelihood of adopting a simulation game by 3.32 times. A standardized unit increase in teaching experience increases the likelihood of adopting a simulation game by 1.85 times. Interestingly, the effect of teaching experience is positive, meaning that contrary to the hypothesized relationship, the more years of teaching experience an instructor has, the greater the probability that he or she has adopted a sales simulation game. In sum, we find no support for Hypothesis 3a (risk), Hypothesis 3c (resources), nor Hypothesis 3d (lack of professional or teaching experience). We do find consistent support for Hypothesis 3b (suitability).
Discussion
Students see traditional lectures as the most useful method of instruction, even though they recognize they are not as fun as simulation games. Indeed, the strong point of simulation games appears to be their ability to engage students. Yet our student sample supports Wildman and Reeves’s (1997) assertion that simulation games occupy and entertain but are not necessarily seen as directly promoting learning. Simulation game developers should therefor attempt to emphasize the usefulness of their products. Not only will this likely affect student perceptions but it may also serve as a means to convince nonadopters to try their products. Additionally, instructors already using simulation games can better illustrate the learnings that can be obtained from playing the game, for example, as part of the simulation game briefing and debriefing.
Instructors, especially those who adopted a simulation game, evaluate simulation games more positively on learning outcomes than lectures. Nonadopters see case studies as the best teaching method, whereas adopters consider case studies about as effective as simulation games. This is in line with Bobot’s (2010) finding that simulation games combined with some case studies do not outperform case studies alone. Nevertheless, the engagement that simulation games can bring to a sales class should not be underestimated. Sitzmann (2011) finds that active engagement itself explains most of the effectiveness differences between teaching methods. When students were actively engaged in alternative methods, simulation games performed worse on learning outcomes than these alternative methods. However, when students did not actively engage in the alternative methods, the simulation game outperformed these alternatives.
The difference between adopters and nonadopters also begs the question whether these differences are the driver or the result of their adoption decision. As our study is cross-sectional in nature, we cannot answer this question, but nonadopters who are hesitant about using a selling or SMS game should at least consider that adopters on average are much more positive about these games. The possibility exists that the unknown also simply has become the unloved. Interestingly, several research findings in other business disciplines could not be replicated in the sales education context. For example, there is no evidence that particularly inexperienced sales instructors adopt simulation games. To the contrary, there is a positive relationship between teaching experience and the use of sales simulations. It is possible that more experienced instructors simply had more opportunity to work with simulation games over the years. It is also possible that it just takes time and experience to develop a sales curriculum that expands beyond the material offered by textbook publishers, none of which currently offers a simulation game as part of their standard textbooks. In either case, the adoption of a simulation game in sales education appears not to be a sign of inexperience or teaching weakness as previously hypothesized but rather the result of experience and the ability to tailor the curriculum based on multiple teaching resources. Although somewhat speculative, this finding could also mean that it could pay off for (potential) producers of simulation games to work together with a textbook publisher to optimally integrate their game with the textbook material.
The perceived risk of adopting a simulation game and lack of teaching resources do not play a role in instructor’s decision to adopt a game in their selling and sales management classes. It is likely that the current product offering plays a role in this. The currently available simulation games are well tested and require very little instructor input. Hence, risk perceptions and resource intensity are probably lower than in other business disciplines. Also, the most frequently used SMS game “Shoot for MARS” is well documented, which makes it possible for instructors to delve into some of the inner workings of the game and so reduce the previously mentioned black-box problem.
Finally, the finding that 58% of nonadopters indicate that when the ideal game would be available, they would like to spend about 18% of their class time on simulation games, suggests there is an opportunity for the development of new or improved simulation games. In light of this, it is no surprise that suitability was the one factor from the Lean et al. (2006) model that significantly predicted whether instructors were adopters or nonadopters. To address this perceived lack of suitable simulation games, we call for the introduction of new or substantially improved simulation games that better address recent changes in the thinking about the sales process, as well as better cover the topics of account management, sales analytics, performance evaluations, training, territory management, and hiring and firing decisions. In a decade in which collegiate sales education has developed substantially (Deeter-Schmelz & Kennedy, 2011), it is a missed opportunity that the offering of new and improved simulation games has fallen behind.
Limitations and Future Research
The enthusiasm and skill with which an instructor uses a certain teaching method undoubtedly affects student perceptions about the effectiveness of that method (Sitzmann, 2011). Similarly, the intrinsic quality of the teaching method, such as the quality of the textbook used, the cases studied, or the simulation game adopted, affect how students perceive each method. We tried to address these issues by varying the teaching tools used in the different classes. For example, we used multiple types of sales case studies in each class: video cases, end of book chapter cases, and an MBA-level case as a capstone to the class. Similarly, we used seven different class sections that used two different textbooks. Although we found no significant differences between these groups, this range of different teaching methods was not a fully randomized part of the study design, and hence the possibility that some of our findings are still confounded by the strengths and weaknesses of the instructor, and the quality of the teaching materials used, cannot be excluded. As this study is one of the first after a hiatus in marketing simulation research papers (Gray et al., 2012), it is obvious further research is warranted. For example, this study focusses on students’ and instructors’ perceptions. It does not investigate the wide range of individual- and group-level variables that may predict simulation game performance, or, more importantly, students’ learning outcomes. Investigating the factors that help predict or shape the learning outcomes of simulation games will be a fruitful area of future research and may contribute to increase the efficacy of simulation games in the classroom. Finally, this study includes the results of two different simulation games that are designed to accomplish similar yet different learning goals. A “Consumer Reports” approach, where the strengths and weaknesses of different simulation games are contrasted rather than pooled, could provide more opportunities to uncover the simulation design factors that would contribute the most to realizing students’ learning outcomes.
Footnotes
Appendix A
Acknowledgements
The author would like to acknowledge four anonymous reviewers who contributed substantially to this article in the form of helpful suggestions and critique.
Declaration of Conflicting Interests
The author(s) declared no potential conflicts of interest with respect to the research, authorship, and/or publication of this article.
Funding
The author(s) received no financial support for the research, authorship, and/or publication of this article.