
Abstract
Government should serve the public good. Yet critics argue that “big government” is a major cause of corruption. This article assesses the empirical validity of their argument through cross-national statistical analysis, addressing two of previous research’s key weaknesses: lack of controls for potential reverse causation and for the likely confounding impact of nonprofit sector size. Contrary to critics’ claims, the analysis presented here finds no evidence that a larger government generally contributes to higher corruption. Instead, both government and nonprofit sector size generally have an inverse relationship with the level of corruption. To combat corruption, therefore, public administrators should be skeptical of recommendations for sweeping government cuts and should instead consider policies that strengthen the public and the nonprofit sectors.
Introduction
The government is supposed to serve the public good. Yet critics accuse it of doing precisely the opposite. Academics and policy makers alike commonly suggest that government is a main, if not the main, cause of corruption. Indeed, a few analysts have discerned the emergence of a “a general consensus . . . that the reduction of state bureaucracies and the encouragement of more transparent, free-market operations . . . are the most effective methods of controlling corruption” (Tulchin & Espach, 2000, p. 5). Critics argue that government size—that is, public spending, subsidies and taxes, as well as government ownership of industry—reduces the space for the market and increases the opportunity for public officials to pursue their private greed for public resources. According to Gary Becker, an influential Economics Nobel Laureate, “the source of official corruption is the same everywhere: large governments with the power to dispense many goodies to different groups” and, therefore, the policy recommendation should be clear: “If you want to cut corruption cut government” (Becker & Becker, 1997, p. 203). This advice is echoed by libertarian politicians and think tank researchers, such as Cato Institute’s Dan Mitchell, whose Youtube video “Want less corruption? Shrink the size of government” has attracted considerable attention.
This article assesses the empirical validity, through cross-national analysis, of the popular “big government is bad government” argument with respect to corruption, that is, that a larger government is generally a more corrupt government. This argument has important implications for public administration. Corruption robs government of precious revenues and undermines its service delivery and regulatory capacity (Elliott, 1997; Transparency International, 2008; United Nations, 2005). Corruption also “constitutes a challenge to the very foundations of development cooperation,” by undermining the achievement of program goals and tax payers’ willingness to support development cooperation (Swedish International Development Cooperation Agency [SIDA], 2004, p. 6). According to the World Bank, corruption is “the single greatest obstacle to economic and social development.” 1 Lowering public sector corruption, therefore, is a critical goal of public administration (see, for example, Grimes & Wängnerud, 2010; Grönlund & Setälä, 2011).
The intensifying fight against corruption and the widespread belief that public sector size contributes to corruption has legitimized policy recommendations for sweeping government cuts, especially in developing and transition countries (e.g., Natal, 2006; Treisman, 2000). But although the relationship between government size and corruption has been a focus of research for many years, there are good reasons to believe that the significance of government size may have been overstated. For one thing, the influence of the nonprofit sector on the relationship between government and corruption has not been systematically examined (see Grimes & Wängnerud, 2010). Assuming, for example, that corruption generally declines after policy makers implement government cuts and boost the nonprofit sector, was an observed decline in corruption due to the reduction in government size or the expansion of the nonprofit sector? Previous research cannot answer this question and, thus, may have overestimated the impact of government size. Moreover, most studies have failed to control for the potential for reverse causation between government size and corruption. A government could be larger because its low corruption leads to higher tax revenues and not the other way around.
By combining an examination of government and nonprofit sector impacts on corruption and controlling for potential reverse causation, this study avoids two potentially significant sources of bias that are typical in previous research. The analysis presented here shows no evidence that government size is directly associated with corruption, questioning the validity of the popular “big, bad government” thesis. In fact, government size has a robust inverse relationship with the level of corruption across nations. On the other hand, in line with the popular view that a strong nonprofit sector helps to promote public integrity, nonprofit sector size also has a robust inverse relationship with the level of corruption at the national level. The lowest levels of corruption, therefore, can be found in countries with a large government and a large nonprofit sector. One of the implications of these findings is that the current pressures for public and nonprofit budget cuts are likely to create a more favorable environment for corruption, while simultaneously depressing service provision capacity. After reviewing the literature and analyzing the cross-national evidence, this article discusses in the conclusion a few policy options that might help alleviate this bleak scenario.
Corruption, Government, and the Nonprofit Sector: Theory and Evidence
Corruption is defined here as the “abuse of entrusted office for private gain” (Transparency International, 2008, p. 2). Corruption includes several different types of behavior identified with wrong doings, such as bribery, embezzlement, extortion, and nepotism. There is increasing evidence that these diverse local events are facilitated or hindered by structural influences, which frame agents’ power and incentives to engage in corrupt behavior (e.g., Elliott, 1997; Lambsdorff, 2005; Transparency International, 2008). Thus, although cross-national analyses of macro-level data miss the richness of the local, they are invaluable in helping to understand macro-level influences on corruption, such as the size of government, the presence of an independent judiciary, and the level of democracy in a society. Cross-national analyses also help assess the empirical generalizability of qualitative research findings, test hypothetical mechanisms linking micro- and macro-level effects, and provide a check on popular ideologically based claims (see Treisman, 2000). It is not surprising, therefore, that cross-national research has intensified significantly in the past two decades (Grimes & Wängnerud, 2010).
The dominant view of the relationship between government and corruption is that government participation or “intervention” in the economy is a main cause of corruption. This view, which is referred to here as the “big, bad government” thesis, is supported by various theoretical and empirical analyses. Theoretically, Public Choice scholars have applied neoclassical market principles to examine government affairs and have long argued that a large government leads to a concentration of bureaucratic power and elimination of market competition, which provide an opportunity for public officials to extract political rents based on their monopoly power (e.g., Klitgaard, 1988; Rose-Ackerman, 1999). As La Porta, Lopez-De-, Shleifer, and Vishny (1999, p. 225) put it, “On average, greater interventionism should be associated with lower [government] efficiency, since entrusting officials with greater regulatory and taxing powers invites corruption.” As Rose-Ackerman wrote in a report for the United Nations Development Programme (UNDP; 1997),
Corruption is a symptom of something gone wrong in the management of the state. Institutions designed to govern the relationships between citizens and the state are used instead for the personal enrichment of public officials and the provision of benefits to the corrupt. (p. vii)
Empirically, Joseph LaPalombara (1994) finds that corruption and the size of the government budget relative to GDP are highly correlated. Similarly, Treisman (2000) finds that state intervention is directly associated with corruption, while Goldsmith (1999) finds an inverse correlation between economic liberalization and corruption. Ades and Di Tella (1997) find that openness, used as a proxy for economic competition and measured as the ratio of imports to GDP, is negatively associated with corruption. Thus conservative governments and international organizations, such as the International Monetary Fund and the World Bank, have seized on this evidence to legitimize their privatization and market deregulation agendas, with far-reaching consequences for governments and citizens in poor countries (Hopkin & Rodriguez-Pose, 2007).
The internal logic of the “big, bad government” thesis is undeniable. All else being equal, public sector monopoly power and lack of market competition probably do create opportunities for rent-seeking and other forms of corruption. Yet the argument is unidimensional, focusing on some of big government’s potential weaknesses and ignoring its potential strengths. A strong government may be better equipped to fight corruption than a weak government (Elliott, 1997). Presumably, the size of government, in terms of the amount of resources it commands, is directly linked to the capacity of government to oversee public officers, sanction wrongdoings, and promote transparency in public affairs. A better resourced government is also more able to offer competitive salaries to public officers, reducing their incentives to embrace corruption. Less obviously, it is possible that government size is also inversely linked to social inequality, which has been shown to increase corruption. Notably, Eric Uslaner (2008) argues that stronger governments, with more resources to redistribute, are better able than weaker governments to fight social inequality. In turn, by fighting social inequality government strengthens the social contract between state and citizens, which is a precondition for generalized citizen compliance with state rules and lower corruption. Lastly, a larger government with more resources is more likely to attract citizen interest and oversight, than a smaller government. Citizen oversight, moreover, should strengthen government accountability and reduce corruption (e.g., Florini & Simmons, 2000). There’s some evidence in support of this argument. It is widely recognized that Scandinavian countries have among the largest public sectors and lowest levels of corruption in the world. However, is it simply a case of “Scandinavian exceptionalism,” while others must limit the intrinsically corrupt orientation of our governments? A few cross-national studies suggest that Scandinavian governments are in fact part of a broader trend. They have found that larger governments are generally associated with lower corruption (Elliott, 1997, pp. 182-183; Hopkin & Rodriguez-Pose, 2007; La Porta et al., 1999). The relationship between corruption and government size is, therefore, less obvious than advocates of the “big, bad government” thesis would generally concede and deserves further theoretical and empirical scrutiny.
Another weakness of the dominant thesis is methodological and relates to a general limitation of cross-national research on corruption. The vast majority of such studies do not control for the potential endogeneity between corruption and its causes. Elliott (1997), however, argues that reverse causation is probable: a more accountable and less corrupt government should be better able to attract revenue and boost its budget. Thus a larger government size may be caused by a lower level of corruption. Or the opposite could be true: less corrupt government officials may not be interested in expanding the government budget. In this case, more accountable governments would have smaller budgets than more corrupt governments, in which public officials can obtain private benefits from public resources. This study employs instrumental-variables to address this potential bias in regression analysis (explained below).
A final and critical weakness of the “big, bad government” thesis, and of our knowledge of the relationship between government size and corruption more generally, is that previous research has not taken the potential influence of the nonprofit sector into account. Because the nonprofit sector is generally thought to help reduce corruption and to be correlated with government size, failing to control for the nonprofit sector’s effect on corruption may lead to an overestimation of government size’s effect. To address this gap, this study also examines the relationship between corruption and the nonprofit sector, which has received relatively little systematic attention (Brooks, 2002; Greenlee, Fischer, Gordon, & Keating, 2007; Natal, 2006).
The inclusion of nonprofit sector size in the analysis deserves further consideration. There is strong agreement among influential international agencies, including the World Bank, European Union, Organization for Economic Development and Cooperation (OECD), and the U.S. Agency for International Development (USAID), that a strong nonprofit sector is essential in the struggle against corruption (Bailey, 2004; Johnston, 2005; OECD, 2003; Themudo, 2009; USAID, 2000). Past research offers several plausible mechanisms through which the nonprofit sector may help fight corruption. First, proponents of the “big, bad government” thesis claim that nonprofits and other private organizations may inject competition in service provision, reducing the monopoly power of government officials and their ability to extort “special fees.” Donor interest in NGOs in foreign aid delivery has in part been a strategy to bypass corrupt governments, thus helping to reduce corruption in foreign assistance (see Anheier & Themudo, 2005; Lewis, 2003) Second, nonprofit sector organizations may contribute to a system of “checks and balances” by performing an independent watchdog function, which increases public sector transparency and holds government officials accountable to proper uses of public funding and office (Elliott, 1997; Grimes & Wängnerud, 2010). One example is the Debt Action Network in Uganda, a volunteer nonprofit group that regularly monitors the uses of foreign aid and debt relief on the ground. By increasing transparency, making public both corrupt acts and actors, the nonprofit sector increases the likelihood of sanctions against corrupt behavior (Lambsdorff, 2005). Third, nonprofit sector organizations may educate citizens and public officials about corruption’s negative social consequences, creating essential political will for change (Johnston, 2005; OECD, 2003; Ralchev, 2004). For example, Transparency International’s Global Corruption Report has played an important role in raising international awareness about corruption and its negative social impacts. More generally, the rise and expansion of an international nonprofit sector is clearly associated with increasing global awareness of corruption and its negative social impacts (Florini & Simmons, 2000; Glynn, Kobrin, & Naím, 1997; McCoy & Heckel, 2001).
The dominant virtuous nonprofit sector thesis also deserves further empirical scrutiny. Typical characteristics of nonprofit organizations, such as a voluntary board of governance, fiscal benefits, and ambiguous performance measurement, may make them a propitious environment for corruption (Gibelman & Gelman, 2001; Greenlee et al., 2007). Indeed, since many nonprofit organizations are either corrupt or serve as conduits for corruption (Zinnes & Bell, 2003), it is possible that a larger nonprofit sector may actually increase corruption (Bailey, 2004). Despite policy makers’ recurring references to the nonprofit sector’s general role in fighting corruption, a systematic examination of the empirical generalizability of such claims has yet to be undertaken. This study helps to address this gap, taking the potential influence of government size also into account.
Empirical Analysis
Cross-national research on the macro-level causes of corruption has intensified significantly in the past two decades. Such research has been facilitated by the emergence of systematic measures of corruption across nations. The Transparency International’s Corruption Perceptions Index (CPI) has emerged as an important indicator of corruption at the national level. The CPI is based on perceptions of public sector corruption from surveys of experts and business leaders. While perceptions of corruption can be biased, by combining estimates from a several different surveys the index reduces the influence of idiosyncratic measurement errors (Lambsdorff, 2005). Indeed, the CPI has been noted both for its internal consistency and for its consistency with other major corruption indexes (Treisman 2000). 2 Also, perceptions of corruption are important as they have been shown to influence investment, economic growth, and the political attitudes and behavior of citizens (Treisman, 2000) and are increasingly used in foreign aid allocation decisions (OECD, 2003). Nevertheless, the question of whether the CPI can be used as a proxy indicator of actual corruption deserves further attention. Being based on surveys of primarily Western experts and business leaders, the CPI can suffer from a Western bias. 3 Fortunately for our purposes, systematic empirical examinations of this issue generally find that the CPI is closely associated with measures of corruption based on local, non-Western sources. For example, Canache and Allison (2005) and Holmberg (2009) find a very high correlation between the CPI and estimates of corruption based on random surveys of the local population. Consistent with their findings, the correlation between the CPI and the World Values Survey question of whether compatriots generally accept bribes is remarkable (r = .901) within this study’s sample. The correlation between CPI and Mocan’s (2008) indicator of Bribery to Government Officials, which is based on the percentage of the population that had been asked or expected to pay bribe by government officials in the previous year, is also very strong (r = .799) within this study’s sample. The Pearson correlation between the CPI and Transparency International’s Corruption Barometer, a grassroots measure of actual bribe paying, is .693. This indicator is based on the percentage of the population who answered “Yes” to the question “In the past 12 months, have you or anyone living in your household paid a bribe in any form?” (Transparency International, 2005). Lastly, the CPI has a strong correlation (r = .803) with the measure of whether local businesses commonly pay irregular additional payments (based on Country averages of business representatives’ answers to the question “It is common for firms in my line of business to have to pay some irregular ‘additional payments’ to get things done” from the World Bank’s survey of local businesses (World Bank, 2000). Of note, these grassroots-level indicators also point directly to negative consequences of corruption, such as resource wastage (in terms of bribe paying); distortion of public provision based on side payments, rather than socially desired goals; failure to deliver the quantity and quality of services the public has purchased with taxes; and economic distortions based on restriction in businesses’ access to markets. Importantly, the close association between the CPI at the macro-level and these more local indicators of corruption suggest the CPI is also a relevant proxy indicator for many of corruption’s serious consequences.
For all this, as well as to ensure consistency with a large number of previous studies, this study employs the CPI as a measure of corruption. The CPI for the year 2005 was chosen to ensure consistency with available measures of the main independent variables of interest. For convenience of interpretation, the original index has been reversed so that a score of 10 reflects the highest level of corruption and a score of 0 the lowest.
This study employs two measures of government size. The first is the Frasier Institute’s Size of Government index in 2003. The index combines several measures of government size, namely, (a) the share of general government consumption in total consumption; (b) transfers and subsidies as a share of GDP; (c) government enterprises and investment as a share of gross investment; and (d) top marginal tax rate. The index measures government size in terms of the extent to which resources in the economy are directly controlled by government. The index was reversed to facilitate interpretation so that a higher value indicates a larger government. Contrary to the “big, bad government” thesis, a simple bivariate correlation between corruption and the Size of Government index displays an inverse relationship (Figure 1), which is significant in both statistical and policy senses (r = –.491, p < .01). 4 The second measure of government size is government expenditure as a proportion of GDP. As a simpler indicator, it offers an important robustness check on the analysis based on the Size of Government index. Again, contrary to the “big, bad government” thesis, a simple bivariate correlation between corruption and government expenditure as a proportion of GDP displays an inverse relationship, which is significant in both statistical and policy senses (r = –.585, p < .001). 5

Corruption and government size.
The lack of empirical studies on the link between the nonprofit sector and corruption is partly due to the paucity of data on the former. This study uses the data produced by the Johns Hopkins International Comparative Nonprofit Sector Project. 6 Thus far, the project has measured several dimensions of nonprofit sector size in 40 countries, with a combined population of around three billion people. 7 The indicator of nonprofit sector size used here is nonprofit sector spending minus government funding to the nonprofit sector. In many countries, government is a main funder of the nonprofit sector. Thus, to avoid potential double counting between government and nonprofit spending, the indicator of nonprofit sector size must exclude government funding to the nonprofit sector. 8 The Pearson correlation of new measure of nonprofit sector size with the Size of Government index is .094 and with government spending as a proportion of GDP is .366. Nonprofit sector size data was collected between 1995 and 2003. Figure 2 shows that nonprofit sector size and corruption display a strong inverse relationship (r = –.506, p < .01). 9
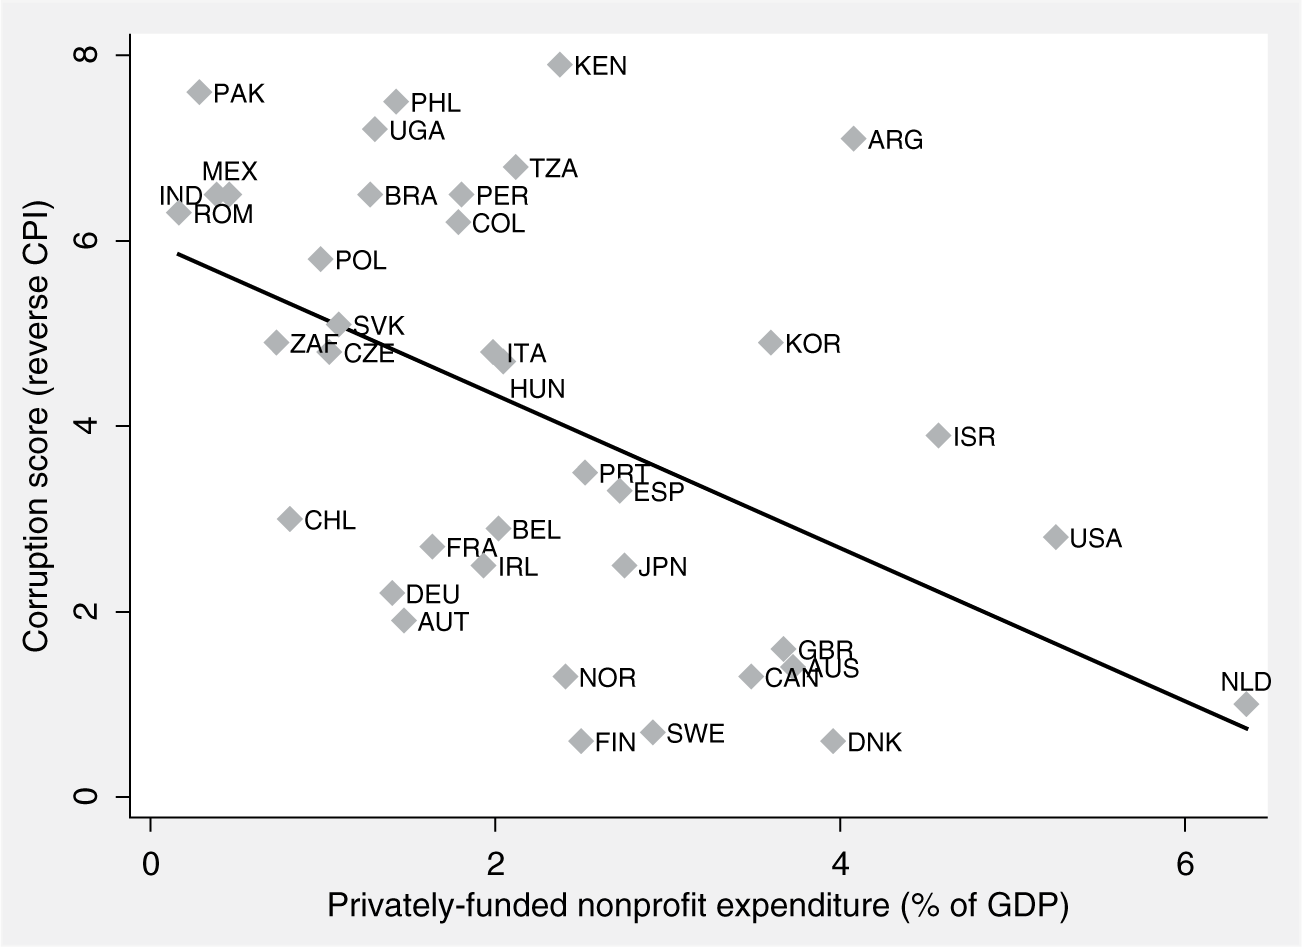
Corruption and nonprofit sector size.
Regression analysis is used to mitigate the concern that such strong bivariate relationships may be driven by omitted variables. The analysis includes controls for nonprofit sector size as well as various underlying institutional and structural characteristics that, according to previous research, are most likely to influence the relationship between corruption, government, and nonprofit sector. Unless otherwise stated, all figures refer to 2003. Economic development is commonly associated with lower corruption (e.g., Treisman, 2000). To control for economic development the analysis uses the natural log of income per capita as calculated by the World Bank and included in the World Development Indicators data set. Openness to trade has been linked to lower corruption at the national level (e.g., Ades & Di Tella, 1997). It is measured here as exports plus imports as a percentage of GDP in constant prices, using the estimates included in the Penn World Tables.
To control for the effects of political institutions, the analysis includes controls for the level of democracy, federalism, and an independent judiciary. Level of democracy, which has been has been found to have an inverse relationship with corruption (Treisman, 2000), is measured using the combined Polity Score based on the Polity IV data set (Marshall & Jaggers, 2002). Federalism may also contribute to lower corruption as it introduces competition across government units with overlapping jurisdiction (Rose-Ackerman, 1999). Federalism is controlled for using a dichotomous variable estimated by Treisman (2000) and included in the Quality of Governance data set (Teorell, Holmberg, & Rothstein, 2007). The presence of an independent judiciary, which previous research has associated with lower corruption, is controlled for using a dummy variable denoting an independent judiciary in the year 2000, as estimated by Henisz (2002).
Several controls for known structural and cultural determinants of corruption are also included. To control for cultural heritage, the model includes a dummy variable to denote countries with a Socialist legacy, that is, countries which were historically under Soviet Union influence, which tend to have higher levels of corruption (Hopkin & Rodriguez-Pose, 2007). To control for ethnic fragmentation, the analysis uses Ethnolinguistic Fractionalization in 1985, as calculated by Roeder and included in the Quality of Governance data set (Teorell et al., 2007). The measures reflect the probability that two randomly selected people from a given country will not belong to the same ethnolinguistic group. Table 1 presents summary statistics for all variables.
Descriptive Statistics.

To minimize potential measurement bias, the analysis employs weighted least squares regression (WLS), which introduces analytical weights to ordinary least squares regression. In this case, the analytical weight of each observation is inversely proportional to the standard error of the corruption index for that observation. Thus the estimates of corruption perception that are more uniform across sources are considered more reliable and get a higher weight in the regression.
To disentangle cause-effect relationships between corruption and government size as well as between corruption and nonprofit sector size, the analysis employs weighted two-stage least squares regression (2SLS). In 2SLS, an instrumental variable—that is correlated with the independent variable of interest, but not with the dependent variable once independent variable controls have been included—parses out the independent variable of interest’s exogenous effect from its endogenous one. Such an instrumental variable, therefore, controls for the potential reverse causality between corruption and government or nonprofit sector size. The instrument for government size is the natural logarithm of population size. A larger population permits economies of scale in the public sector and, consequently, a relatively smaller government is needed to meet population needs, other things being constant. The instrument for nonprofit sector size is the country’s surface area. Governments probably face greater challenges in providing public goods in larger countries with more dispersed populations than in smaller countries. Those greater challenges encourage the emergence of a stronger nonprofit sector. Both instruments were significant predictors of the endogenous variables in first-stage regressions and the Anderson test rejects the null hypothesis of underidentification using the chosen instrument set.
Table 2 presents the regression results. Models 1 to 4 present WLS while Models 5 to 8 present 2SLS analyses. Models 1 and 5 do not include control variables. All other models control for level of economic development and level of democracy as well as a different set of other control variables. 10 Models 4 and 8 employ an alternative indicator of government size, government expenditure as a proportion of GDP. As indicated by the adjusted R2 measure, the models explain most of the variation in corruption within the sample.
Regression Results.

Note: Robust standard errors reported between parentheses under unstandardized coefficients.
p < .15. *p < .10. **p < .05. ***p < .01.two-tailed.
The statistical results presented on Table 2 clearly suggest that both government and nonprofit sector size are consistently associated with lower levels of corruption at the cross-national level. There is no evidence in support of the popular “big, bad government thesis.” The size of government is associated with lower corruption and reaches statistical significance in all models. As a robustness check, Models 4 and 8 employ government expenditure as a proportion of GDP, as the measure of government size. The inverse association between government size and corruption remains consistent. Of note, controlling for potential reverse causation actually strengthens the effects of government size on corruption.
There is also no evidence to suggest that a larger nonprofit sector contributes to higher corruption. Consistent with the common view that the nonprofit sector helps to reduce corruption, nonprofit sector size is inversely associated with the level of corruption in all models, though it fails to reach statistical significance in two of the models. Importantly, nonprofit sector size reaches statistical and policy significance in all 2SLS models. From a policy perspective the association between nonprofit sector size and corruption is stronger than the relationship between government size and corruption. This has important implications as discussed below.
Generally, other variables have the expected relationship with corruption. Level of economic development and democracy, independent judiciary, federalism, and openness to trade have an inverse relationship with corruption, though only the coefficients for level of democracy and independent judiciary reach statistical significance. On the other hand, a Socialist legacy and ethnolinguistic fragmentation display the expected direct relationship to corruption though only Socialist legacy reaches statistical significance in all models.
Conclusion
Corruption poses a major threat to public administration. By adversely impacting public resource availability, government effectiveness, and public trust in government, corruption obstructs the efficient and responsive management of public affairs. Thus policies that successfully reduce corruption will bring about large social benefits. Yet this study’s findings suggest that anticorruption policy is regularly hindered by oversimplistic analyses suggesting that “government size” must be synonymous with “corruption,” and that by cutting its government a country is concomitantly reducing the opportunities for the abuse of public office. In contrast with such analyses, this study found no evidence that government size is directly associated with corruption. In fact, the findings presented here indicate that generally the reverse is true. Government size is inversely linked to the level of corruption across nations. This was robust to the inclusion of a wide range of control variables in the analysis, control for potential reverse causation, and changes in the operationalization of government size. This study’s results are thus consistent with the few dissenting cross-national analyses suggesting that government size and corruption are inversely associated (Elliott, 1997; Hopkin and Rodriguez-Pose, 2007; La Porta et al., 1999) and historical analyses showing that widespread privatization in Russia and Latin America has produced more rather than less corruption (e.g., Tanzi, 2000). This study is distinct from previous analyses in that it examines the potentially confounding influence of the nonprofit sector and from previous cross-national analyses in that it controls for the possibility of reverse causation between corruption and size of government. In so doing, this study produces a more accurate picture of the relationship between both sectors and corruption. Because, as the analysis presented here finds, a nonprofit sector size also has a significant inverse relationship with corruption at the national level, countries with a large government and a large nonprofit sector tend to have the lowest levels of corruption.
A few causal mechanisms might explain why larger and better resourced governments and nonprofit sectors are commonly associated with lower levels of corruption. . Government size may reduce the level of corruption through its direct effect on state capacity, social equality, and citizen interest in the functioning of government. A larger, better resourced government can hire enough employees to ensure adequate bureaucratic oversight, can pay higher wages that reduce the incentives for bribe taking, can redistribute more resources to fight social inequality, which previous research has identified as a cause of higher corruption (Uslaner, 2008), and may increase the incentives for citizen monitoring of government activities (because larger governments have more resources at stake). A larger and better resourced nonprofit sector, on the other hand, can better develop the capacity to monitor the government and have a stronger redistributive role, better helping to reduce social inequality than a weaker nonprofit sector. Indeed, within this study’s sample nonprofit sector size is inversely associated with social inequality, which suggests that nonprofit impact on corruption may also be partly due to its role in reducing social inequality. 11 Nonprofit sector’s impact on corruption, therefore, might depend on a much broader spectrum of organizations than are typically acknowledged in past corruption and good governance research, which has focused almost exclusively on advocacy-oriented groups. Unfortunately, a systematic empirical assessment of the relative explanatory power of each hypothetical mechanism is beyond the scope of this article and must be left for future research.
This study’s findings have implications for anticorruption policy, the most important of which is that skepticism is warranted regarding most recommendations for government cuts in the effort to reduce corruption. The analysis presented here suggests that reductions in government size are robustly associated with higher levels of corruption at the national level. Government cuts, therefore, must be justified by policy goals other than reducing corruption or they must justified by how cuts in government may generate an anticorruption effect that is larger than the corruption-boosting effect resulting from any cuts. In this context, the question of whether anticorruption policy should seek a stronger government or nonprofit sector (or both) deserves careful consideration. This study’s analysis suggests that an increase in nonprofit sector size should have the greatest anticorruption effect. Following the results in Table 2 (2SLS results in column 8), a 1% increase in government spending as a proportion of GDP would produce a .265 decrease in the (reversed) CPI, while a 1% increase in privately financed nonprofit sector spending as a proportion of GDP would produce a larger .697 decrease after controlling for other likely influences. Of course, these results are true only within the range of government and nonprofit sector spending included in the sample. It is unclear whether these findings can be extrapolated beyond those values.
Government cuts, therefore, may be justified if they directly boost the nonprofit sector. An important policy implication is that tax deductibility for philanthropic donations is potentially a powerful anticorruption policy option. The reduction in government size due to lower tax revenue should be compensated by an increase in nonprofit spending equivalent to the lost taxation revenue (i.e., the tax benefit) plus any private donations net of tax benefits, which produce a net increase in the combined government and nonprofit sector size. Combined with the stronger anticorruption effect of nonprofit sector size, the larger size of both government and nonprofit sectors should contribute to lower levels of corruption. An implication from this argument is that the low level of tax benefits typically afforded to the nonprofit sector in poor and middle income countries (Salamon & Toepler, 2000) may be an important factor contributing to the high level of corruption in those countries and it must be reassessed in the context of anticorruption policy. An important limitation of cuts in the size of government to promote nonprofit sector size is that policy makers have limited influence over privately funded nonprofit spending. The effect of tax benefits for philanthropy is determined by the elasticity with which donations respond to changes in tax benefits and, ultimately, the supply and demand for nonprofit services.
An alternative strategy to boost the nonprofit sector, which would have no impact on government size, is to avoid excessive government regulation of nonprofits. Government must oversee nonprofits to fight corruption within the nonprofit sector. But oversight should be commensurate with the size of the organization, which is often not the case. Generally, small nonprofits face inordinate government demands for financial and organizational reports, while large nonprofits face only slightly more demanding reporting obligations (see Kumar & Nunan, 2002). Such burdensome regulatory environment stifles nonprofit entrepreneurship and nonprofit sector development (Salamon & Toepler, 2000).
The optimal size of public and nonprofit sectors, of course, should be determined by many factors. While corruption has often been used to legitimize cuts in government intervention, this study suggests that in pursuing policies that successfully increase government and nonprofit sector size, policy makers will encourage less, not more, corruption. Attention to the relationship between corruption and government and nonprofit sector size is especially relevant against the current background of macroeconomic stagnation, which threatens both government and nonprofit budgets and, as a result, is likely to promote corruption and weaken public administration.
Footnotes
Declaration of Conflicting Interests
The author(s) declared no potential conflicts of interest with respect to the research, authorship, and/or publication of this article.
Funding
The author(s) received no financial support for the research, authorship, and/or publication of this article.